
ABSTRACT
Background
Data on the prevalence of monoclonal gammopathy of undetermined significance (MGUS) in China are very limited. Our aim was to determine the prevalence and clinical characteristics of MGUS in a large Chinese population.
Methods
This study included 49,220 healthy people who received serum immunofixation electrophoresis (sIFE) and serum protein electrophoresis (SPE) tests. Serum free light chain ratio, immunoglobulin quantification, and other clinically correlates of MGUS were performed for all patients with M-protein.
Results
A total of 576 MGUS patients were identified by sIFE, with a median age of 58 years and an overall prevalence of 1.17% (95% CI, 1.08–1.27). Among those aged 50 years and older, the prevalence of MGUS was 2.26% (95% CI, 2.04–2.50). The prevalence of MGUS was significantly higher in males than in females (P < 0.05). The median concentration of M-protein was 3.1 g/L, ranging from 0.5 g/L to 25.1 g/L. The M-protein type was IgG in 55.4% of MGUS patients, followed by IgA (31.1%), IgM (9.5%), IgD (0.5%), biclonal (2.3%), and light chain (1.2%). Abnormalities in SPE, FLC ratios, and immunoglobulin levels were observed in 78.3%, 31.1%, and 38.4% of MGUS patients, respectively.
Conclusions
The prevalence of MGUS is substantially lower in southern China than in whites and blacks.
1. Introduction
Monoclonal gammopathy of undetermined significance (MGUS) is a common clinically asymptomatic plasma cell disorder. It is defined by the presence of asymptomatic circulating serum monoclonal immunoglobulin protein (M-protein) below 30 g/L, along with a lymphoplasmacytic bone marrow infiltration of less than 10% [Citation1,Citation2]. MGUS is prevalent in the middle-aged and older population, occurring in about 3% of people 50 years of age or older, and tends to increase with age [Citation3,Citation4]. A proportion of patients with MGUS can progress to multiple myeloma (MM). In previous follow-up studies of MGUS patients, the mean annual risk of progression from MGUS to MM ranged from 0.5% to 1.0%, and malignant transformation was found in about 10% of MGUS patients after 10 years [Citation5–7]. Therefore, it is essential to screen patients with MUGS and monitor them with long-term follow-up to promptly initiate appropriate therapeutic interventions.
M-protein serve as a serum tumor marker for plasma cell proliferative diseases. Because of the diverse manifestations of M-protein associated with plasma cell proliferative disorders. Current methods for detecting M-protein include a variety of assays such as serum protein electrophoresis (SPE), serum immunofixation electrophoresis (sIFE), free light chain (FLC) quantification, and immunoglobulin quantification [Citation8,Citation9]. The most commonly used test is SPE, but its detection limit is only one-tenth of that of sIFE [Citation10]. Therefore, a SPE-negative result does not completely exclude the possibility of monoclonal gammopathy. Although sIFE is the most sensitive assay for detecting M-protein, it is not generally used for routine M-protein screening due to the high cost and manual handling of sIFE. The typical procedure in most laboratories is to screen for M-protein with SPE and then confirm SPE-positive samples with sIFE. Consequently, most previous prevalence data were based on SPE results, which would have missed a considerable number of MGUS patients.
There are extremely limited data on the prevalence of MGUS in the Chinese population, with only a few reports to date [Citation11–14], some of which are limited by small sample sizes. In addition, the prevalence of MGUS in southern China is still unknown. In this study, we investigated the prevalence and clinical characteristics of MGUS in a large Chinese population using sIFE as a screening method.
2. Materials and methods
2.1. Patients and samples
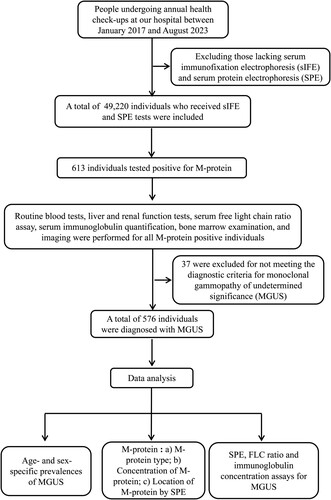
shows the patient flowchart. From January 2017 through August 2023, a total of 219,294 people received annual health check-ups at our hospital. These individuals represent a relatively healthy population in Shenzhen, China. Among them, all individuals (n = 49,220) with sIFE and SPE tests were included in this study. Serum FLC ratio, routine blood tests, liver and renal function tests serum immunoglobulin quantification, and imaging were completed for all individuals who tested positive for M-protein. The criteria for the diagnosis of MGUS include an M-protein level of less than 30.0 g/L, marrow plasma cells below 10% of the total, and the absence of hypercalcemia, anemia, renal insufficiency, and bone lesions. The study received approval from the Ethics Committee of Peking University Shenzhen Hospital. Written informed consent was waived because of the retrospective and anonymous nature of this study. All procedures were conducted in accordance with the ethical standards of the Committees (institutional and national) responsible for human experimentation, as well as the 1975 Declaration of Helsinki (revised in 2008).
Figure 1. Patient flowchart.
2.2. Laboratory test
2.2.1. Serum immunofixation electrophoresis (sIFE)
To detect the presence of M-protein and determine their types, sIFE was conducted on a Sebia HYDRASYS system (Sebia, Lisses, France) using anti-IgG, anti-IgA, anti-IgM, anti-kappa (free and bound light chains), and anti-lambda (free and bound light chains). The visual appearance of gathered bands was considered positive. Another sIFE was performed using IgD and IgE heavy chains, as well as free light chain antigens, if a monoclonal light chain was visible but no corresponding heavy chain was present.
2.2.2. Serum protein electrophoresis (SPE)
Serum protein electrophoresis (SPE) was analyzed using capillary electrophoresis on a Sebia Capillarys3 TERA instrument (Sebia, Lisses, France). Normal serum proteins were separated into six major fractions, including albumin, α1, α2, β1, β2, and γ. The position of the M-spike in the capillary electropherogram was analyzed for all samples that tested positive for M-protein. M-protein was quantified by measuring the M-spike area and albumin concentration. The formula for calculating M-protein concentration is peak ratio multiplied by albumin concentration.
2.2.3. Free light chain (FLC) ratio
Free light chains (FLC) were measured on a fully automated protein analyzer (IMMAGE 800, Beckman Coulter, California, USA) using a commercially available reagent kit (Hevylite, Binding Site, Birmingham, UK). The published reference ranges for kappa, lambda, and kappa/lambda ratios were used, which were 3.3–19.4 mg/L, 5.7–26.3 mg/L, and 0.26–1.65, respectively [Citation15].
2.2.4. Quantification of serum immunoglobulin and albumin
To determine serum immunoglobulin and albumin levels in MGUS patients, we measured IgG, IgM, IgA, and albumin levels on a Beckman AU5821 automatic biochemical instrument (Beckman Coulter, Brea, CA, USA). The reference used were 8.6–17.4 g/L, 0.5–2.8 g/L, 1.0–4.2 g/L, and 40–55 g/L for IgG, IgM, IgA, and albumin, respectively.
2.3. Data analysis
The MGUS prevalence was obtained by dividing the number of persons with MGUS in each group by the total number of participants in that group by age and sex. The 95% confidence intervals (CIs) for prevalence were calculated with a binomial distribution. Descriptive statistics are used to summarize data, including median, minimum, and maximum values. The Student's t-test was used to analyze differences between groups, and the chi-square test was used to analyze categorical data. P-values less than 0.05 were considered statistically significant. Statistical analyses were performed using Microsoft Excel 2016 and SPSS 19.0 software (SPSS, Chicago, IL, USA).
3. Results
3.1. Prevalence of MGUS
and show details of the prevalence of MGUS in different age and sex groups. Out of the 49,220 individuals who underwent health check-ups, 613 tested positive for M-protein, excluding 37 with anemia, hypercalcemia, urea, or creatinine abnormalities. The remaining 576 were diagnosed with MGUS, resulting in an overall prevalence of 1.17% (95% CI, 1.08–1.27). MGUS was identified in 357 of 26525 males and 219 of 22695 females (1.35% vs. 0.96%, P < 0.05). The median age of MGUS patients was 58 years, with a range of 28–92 years. The prevalence among people aged 50 and above was 2.26% (95% CI, 2.04–2.50).
Figure 2. Prevalence of monoclonal gammopathy of undetermined significance (MGUS) by age and sex.
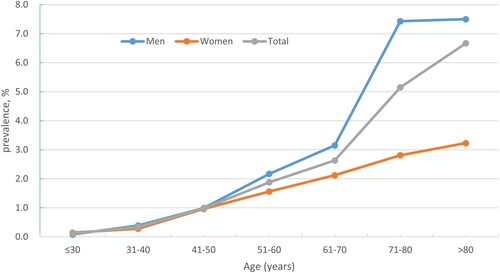
Table 1. Prevalence of monoclonal gammopathy of undetermined significance (MGUS) by age and sex.
Supplementary Table 1 compares the prevalence of MGUS in the current study with that in all previous surveys in China [Citation11–14]. In two of these surveys, only 9 and 8 MGUS patients were identified, respectively, which is too small to accurately represent the real prevalence of MGUS [Citation11,Citation12]. Two other surveys in northern and northwestern China used SPE as a screening method and found that the prevalence of MGUS among people over 50 years of age was 1.11% and 3.01%, respectively[Citation13,Citation14].
3.2. M-protein
3.2.1. M-protein type
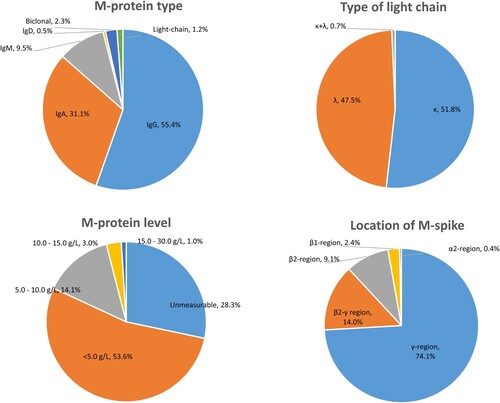
lists the characteristics of patients with MGUS. Among the MGUS patients, 319 (55.4%) were IgG, 179 (31.1%) were IgA, 55 (9.5%) were IgM, 3 (0.5%) were IgD, 13 (2.3%) biclonal, and 7 (1.2%) were light chain. The type of serum light chain was kappa in 298 (51.8%) patients and lambda in 273 (47.5%) patients. Additionally, 4 (0.7%) patients with biclonal M-protein had both kappa and lambda serum light chain types.
Figure 3. Characteristics of patients with monoclonal gammopathy of undetermined significance.
3.2.2. M-protein concentration
The concentration of M-protein was too low to be quantified in 163 (28.3%) patients with MGUS. The median measurable serum M-protein concentration was 3.1 g/L, ranging from 0.5 g/L to 25.1 g/L. Of these MGUS patients, 309 (53.6%) had M-protein concentrations between 0.5 and 5.0 g/L, and only six patients had M-proteinconcentrations exceeding 15.0 g/L.
3.2.3. M-protein location
The distribution of M-spikes was as follows: 74.1% in the γ-fraction, 14.0% in the β-γ junction, 9.1% in the β2-fraction, 2.4% in the β1-fraction, and 0.4% in the α2-fraction. Most IgG and IgM M-proteins were present in the γ-fraction. However, among IgA M-proteins, 34.6% were in the β-fraction (β1+β2), 33.1% were in the β-γ junction, 1.5% were in the α2-fraction, and only 30.8% were in the γ-fraction.
3.3. Laboratory tests for MGUS screening
SPE, FLC, and immunoglobulin quantification were performed on all patients with MGUS identified by sIFE. SPE detected 78.3% of MGUS. Further, it was observed that IgA type M-proteins accounted for 51.2% of cases undetectable by SPE, IgG for 30.4%, IgM for 16.0%, FLC for 2.4%, and IgD for 1.6%. Only 31.1% of MGUS patients had abnormal FLC ratios and 38.4% had abnormal immunoglobulin concentrations.
4. Discussion
The prevalence of MGUS varies globally depending on factors such as age, gender, ethnicity, and screening techniques. A National Health and Nutritional Examination Survey (NHANES) showed that the prevalence of MGUS was significantly higher in blacks than in whites [Citation16]. Among patients aged 50 years and older, the prevalence of MGUS was reported as 3.2% in the USA [Citation7], 3.5% in Germany [Citation17], 6.7% in France [Citation18], and 3.7% in African Americans [Citation19]. Compared to Europe and the United States, the prevalence of MGUS is generally lower in Thai, Korean, and Japanese populations [Citation20–23]. Additionally, MGUS is associated with HIV status and its prevalence is significantly higher in populations with higher rates of HIV infection [Citation24].
In China, there have been few reports on the prevalence of MGUS to date, all of which are based on the data of screening for M-protein by SPE [Citation11–14]. A representative study conducted in Beijing revealed a prevalence of 1.11% in people aged 50 years and older [Citation13]. In comparison, we found a prevalence of 2.26%, which is similar to the findings from Japan but significantly higher than those from Beijing [Citation23]. The reasons for this discrepancy may be due to differences in the study populations and, most importantly, to the sIFE screening technique that we used, which greatly improves the sensitivity of the M-protein assay compared with SPE.
The isotype of M-protein is associated with patient prognosis, disease progression, and risk stratification [Citation19,Citation25]. Non-IgM MGUS has an overall risk of progression of 1% per year, with the possibility of progression to smoldering multiple myeloma (SMM), MM, or light-chain amyloidosis (AL). The risk of progression to Waldenström macroglobulinemia (WM) for IgM MGUS is approximately 1.5% per year, but progression to lymphoma or AL amyloidosis is also possible. Light chain MGUS has a 0.3% risk of progressing to light chain MM and AL amyloidosis [Citation10]. In the present study, IgM M-protein accounted for 9.5% of the total samples, which is consistent with the findings in Beijing and Japan [Citation14,Citation23]. However, this percentage is significantly lower than that in Europe and the United States, which is about 17.0% [Citation7,Citation16].
In normal serum, polyclonal immunoglobulins secreted by plasma cells are distributed in the γ-region. In monoclonal gammopathy, M-proteins show restricted migration regions in the electropherogram, with each M-protein migrating to a specific location. An early cohort study showed that over 50% of M-type spikes were in the γ-region, followed by the β-γ border and the β-region, with only a very small number in the α2-region [Citation26]. We found that almost all IgG and IgM M-spikes migrated to the β-region, while more than half of the IgA M-spikes migrated to the β-region. Notably, 51.2% of the SPE-negative MGUS cases were IgA, indicating that IgA M-protein migrating to the β-region can be easily hidden under the the β-spikes, thus masking the presence of M-protein.
M-protein concentration can be quantified by nephelometry or SPE M-spike to monitor monoclonal gammopathy [Citation27]. Although nephelometry quantification is a simple automated method, it would include both monoclonal and polyclonal immunoglobulins. For SPE M-spikes, if the serum concentration of M-protein is sufficiently high, the M-spike size can be easily quantified. However, when M-protein concentration is low, polyclonal background can interfere with its accurate measurement [Citation28]. When IgA-type M-protein migrate to the β-fraction, it is recommended to quantify immunoglobulins using a nephelometric assay, as the quantification of immunoglobulins is more useful for detecting hypogammaglobulinemia than SPE [Citation10]. Nevertheless, neither nephelometry nor SPE M-spike accurately quantify M-protein levels in the presence of hypoproteinemia. Recent measurements using time-of-flight mass spectrometry have enabled the detection of extremely low concentrations of intact monoclonal proteins, which has facilitated the detection of minor residual disease in the serum of MM patients [Citation29,Citation30].
The current laboratory assays for M-protein detection mainly rely on SPE, sIFE and serum FLC quantification, of which, sIFE has the highest sensitivity and can detect more than 90% of MGUS patients [Citation10]. Traditionally, SPE has been the primary method for M-protein detection. Given the low sensitivity of SPE, additional sIFE should be used to confirm the presence of M-protein. Many studies have been conducted to determine the optimal panel for detecting M-protein [Citation31]. The combination of SPE and FLC detected 88.7% of MGUS. When sIFE, SPE, and FLC were combined, the detection rate increased to 97.1% [Citation10,Citation31]. Previous studies have shown that abnormal FLC ratios are present in approximately 22%−45% of MGUS [Citation10,Citation31,Citation32]. However, for multiple myeloma (MM), FLC ratio alone can detect up to 98.6% of them [Citation10,Citation31]. Our findings demonstrate that FLC or immunoglobulin quantification alone can only detect a small proportion of MGUS.
In conclusion, we have provided reliable geographically representative, age – and sex-specific data on the prevalence of MGUS. The data was obtained by screening M-protein using sIFE in a large Chinese population.
Author contributions
XA, GT, ZS, YY, and JL designed the study; XA, GT, ZS, SM, YY, and LH collected and analyzed the data; XA, GT, YY, and JL wrote and revised the manuscript; YY and JL reviewed the manuscript. All authors have read and approved the final manuscript.
Ethics approval
The present study received approval from the Ethics Committee of Peking University Shenzhen Hospital.
Supplementary table 1.docx
Download MS Word (18.7 KB)Acknowledgments
The authors thank the support of Shenzhen High-level Hospital Construction Fund.
Disclosure statement
No potential conflict of interest was reported by the author(s).
Data availability
The data that support the findings of this study are available from the corresponding author upon reasonable request.
References
- Kumar SK, Rajkumar V, Kyle RA, et al. Multiple myeloma. Nat Rev Dis Primers. 2017;3:17046. doi:10.1038/nrdp.2017.46
- Rajkumar SV, Dimopoulos MA, Palumbo A, et al. International Myeloma Working Group updated criteria for the diagnosis of multiple myeloma. Lancet Oncol. 2014;15:e538–e548. doi:10.1016/S1470-2045(14)70442-5
- Kyle RA, Therneau TM, Rajkumar SV, et al. Prevalence of monoclonal gammopathy of undetermined significance. N Engl J Med. 2006;354:1362–1369. doi:10.1056/NEJMoa054494
- Landgren O, Graubard BI, Kumar S, et al. Prevalence of myeloma precursor state monoclonal gammopathy of undetermined significance in 12372 individuals 10-49 years old: a population-based study from the National Health and Nutrition Examination Survey. Blood Cancer J. 2017;7:e618. doi:10.1038/bcj.2017.97
- Cowan AJ, Allen C, Barac A, et al. Global Burden of Multiple Myeloma: A Systematic Analysis for the Global Burden of Disease Study 2016. JAMA Oncol. 2018;4:1221–1227. doi:10.1001/jamaoncol.2018.2128
- Sigurdardottir EE, Turesson I, Lund SH, et al. The role of diagnosis and clinical follow-up of monoclonal gammopathy of undetermined significance on survival in multiple myeloma. JAMA Oncol. 2015;1:168–174. doi:10.1001/jamaoncol.2015.23
- Kyle RA, Larson DR, Therneau TM, et al. Long-Term follow-up of monoclonal gammopathy of undetermined significance. N Engl J Med. 2018;378:241–249. doi:10.1056/NEJMoa1709974
- Murray DL, Seningen JL, Dispenzieri A, et al. Laboratory persistence and clinical progression of small monoclonal abnormalities. Am J Clin Pathol. 2012;138:609–613. doi:10.1309/AJCPT6OWWMHITA1Y
- Keren DF, Bocsi G, Billman BL, et al. Laboratory detection and initial diagnosis of monoclonal gammopathies. Arch Pathol Lab Med. 2022;146:575–590. doi:10.5858/arpa.2020-0794-CP
- Willrich MA, Katzmann JA. Laboratory testing requirements for diagnosis and follow-up of multiple myeloma and related plasma cell dyscrasias. Clin Chem Lab Med. 2016;54:907–919.
- Wu SP, Minter A, Costello R, et al. MGUS prevalence in an ethnically Chinese population in Hong Kong. Blood. 2013;121:2363–2364. doi:10.1182/blood-2012-11-466011
- Li J, Wen L, Tang J, et al. Prevalence of monoclonal gammopathy of undetermined significance in an apparently healthy yixing population in mainland China. Acta Haematol. 2017;137:17–19. doi:10.1159/000450881
- Han JH, Wang JN, Zhang YL, et al. Prevalence of monoclonal gammopathy of undetermined significance in a large population with annual medical check-ups in China. Blood Cancer J. 2020;10:34. doi:10.1038/s41408-020-0303-8
- Ma L, Xu S, Qu J, et al. Monoclonal gammopathy of undetermined significance in Chinese population: A prospective epidemiological study. Hematol Oncol. 2019;37:75–79. doi:10.1002/hon.2548
- Katzmann JA, Clark RJ, Abraham RS, et al. Serum reference intervals and diagnostic ranges for free κ and free λ immunoglobulin light chains: relative sensitivity for detection of monoclonal light chains. Clin Chem. 2002;48:1437–1444. doi:10.1093/clinchem/48.9.1437
- Landgren O, Graubard BI, Katzmann JA, et al. Racial disparities in the prevalence of monoclonal gammopathies: a population-based study of 12,482 persons from the National Health and Nutritional Examination Survey. Leukemia. 2014;28:1537–1542. doi:10.1038/leu.2014.34
- Eisele L, Dürig J, Hüttmann A, et al. Prevalence and progression of monoclonal gammopathy of undetermined significance and light-chain MGUS in Germany. Ann Hematol. 2012;91:243–248. doi:10.1007/s00277-011-1293-1
- Lecluse Y, Comby E, Mariotte D, et al. Prevalence of monoclonal gammopathy of undetermined significance (MGUS) among farmers involved in open field farming and/or cattle breading in France. Leuk Lymphoma. 2016;57:1727–1730. doi:10.3109/10428194.2015.1113277
- Kyle RA, Durie BG, Rajkumar SV, et al. Monoclonal gammopathy of undetermined significance (MGUS) and smoldering (asymptomatic) multiple myeloma: IMWG consensus perspectives risk factors for progression and guidelines for monitoring and management. Leukemia. 2010;24:1121–1127. doi:10.1038/leu.2010.60
- Watanaboonyongcharoen P, Nakorn TN, Rojnuckarin P, et al. Prevalence of monoclonal gammopathy of undetermined significance in Thailand. Int J Hematol. 2012;95:176–181. doi:10.1007/s12185-011-0995-4
- Lee YG, Bang SM, Lee JO, et al. Five-Year follow-up study of monoclonal gammopathy of undetermined significance in a Korean elderly urban cohort. Cancer Res Treat. 2015;47:215–220. doi:10.4143/crt.2013.262
- Park HK, Lee KR, Kim YJ, et al. Prevalence of monoclonal gammopathy of undetermined significance in an elderly urban Korean population. Am J Hematol. 2011;86:752–755. doi:10.1002/ajh.22095
- Iwanaga M, Tagawa M, Tsukasaki K, et al. Prevalence of monoclonal gammopathy of undetermined significance: study of 52,802 persons in Nagasaki City, Japan. Mayo Clin Proc. 2007;82:1474–1479. doi:10.1016/S0025-6196(11)61090-2
- Cicero KI, Joffe M, Patel M, et al. Prevalence of monoclonal gammopathy of undetermined significance in black South African Men. Cancer Epidemiol Biomarkers Prev. 2022;31:2192–2198. doi:10.1158/1055-9965.EPI-22-0525
- van de Donk NW, Mutis T, Poddighe PJ, et al. Diagnosis, risk stratification and management of monoclonal gammopathy of undetermined significance and smoldering multiple myeloma. Int J Lab Hematol. 2016;38:110–122. doi:10.1111/ijlh.12504
- Kyle RA, Gertz MA, Witzig TE, et al. Review of 1027 patients with newly diagnosed multiple myeloma. Mayo Clin Proc. 2003;78:21–33. doi:10.4065/78.1.21
- Murray DL, Ryu E, Snyder MR, et al. Quantitation of serum monoclonal proteins: relationship between agarose gel electrophoresis and immunonephelometry. Clin Chem. 2009;55:1523–1529. doi:10.1373/clinchem.2009.124461
- Katzmann JA, Snyder MR, Rajkumar SV, et al. Long-term biological variation of serum protein electrophoresis M-spike, urine M-spike, and monoclonal serum free light chain quantification: implications for monitoring monoclonal gammopathies. Clin Chem. 2011;57:1687–1692. doi:10.1373/clinchem.2011.171314
- Barnidge DR, Dasari S, Botz CM, et al. Using mass spectrometry to monitor monoclonal immunoglobulins in patients with a monoclonal gammopathy. J Proteome Res. 2014;13:1419–1427. doi:10.1021/pr400985k
- Kohlhagen MC, Barnidge DR, Mills JR, et al. Screening method for M-proteins in serum using nanobody enrichment coupled to MALDI-TOF mass spectrometry. Clin Chem. 2016;62:1345–1352. doi:10.1373/clinchem.2015.253781
- Katzmann JA, Kyle RA, Benson J, et al. Screening panels for detection of monoclonal gammopathies. Clin Chem. 2009;55:1517–1522. doi:10.1373/clinchem.2009.126664
- Bertrand KA, Zirpoli G, Niharika Pillalamarri B, et al. Prevalence of monoclonal gammopathy of undetermined significance in US black women. Am J Hematol. 2022;97:E341–E343. doi:10.1002/ajh.26638