
ABSTRACT
Background:
Hemolytic disease of the newborn (HDN) is a common condition that can have a severe impact on the health of newborns due to the hemolytic reactions it triggers. Although numerous studies have focused on understanding the pathogenesis of HDN, there are still many unanswered questions.
Methods:
In this retrospective study, serum samples were collected from 15 healthy newborns and 8 infants diagnosed with hemolytic disease. The relationship between different metabolites and various IgG subtypes in Healthy, HDN and BLI groups was studied by biochemical technique and enzyme-linked immunosorbent assay (ELISA). Metabolomics analysis was conducted to identify the differential metabolites associated with HDN. Subsequently, Pearson's correlation analysis was used to determine the relation of these differential metabolites with IgG isoforms. The relationship between the metabolites and IgG subtypes was observed after treatment.
Results:
The study results revealed that infants with hemolytic disease exhibited abnormal elevations in TBA, IgG1, IgG2a, IgG2b, IgG3, and IgG4 levels when compared to healthy newborns. Additionally, differences in metabolite contents were also observed. N, N-DIMETHYLARGININE showed negative correlations with TBA, IgG1, IgG2a, IgG2b, IgG3, and IgG4, while 2-HYDROXYBUTYRATE, AMINOISOBUTANOATE, Inosine, and ALLYL ISOTHIOCYANATE exhibited positive correlations with TBA, IgG1, IgG2a, IgG2b, IgG3, and IgG4. Through metabolomics-based research, we have discovered associations between differential metabolites and different IgG isoforms during the onset of HDN.
Conclusion:
These findings suggest that changes in metabolite and IgG isoform levels are linked to HDN. Understanding the involvement of IgG isoforms and metabolites can provide valuable guidance for the diagnosis and treatment of HDN.
KEYWORDS:
1. Introduction
Hemolytic disease of newborn (HDN), also known as erythroblastosis fetalis, is a hemolytic disorder [Citation1]. HDN is caused by maternal alloimmunization through exposure to incompatible red blood cell antigens of the fetus or incompatible blood transfusion [Citation2, Citation3]. The then-formed immunoglobulin G (IgG) antibodies are actively transported across the placenta [Citation4, Citation5] and can cause fetal hemolysis and anemia. When untreated, progressive fetal anemia results in hydrops fetalis and ultimately fetal demise [Citation6]. Consequently, the newborn experiences hemolysis either during birth or even before. Symptoms may include jaundice, anemia, an increased count of reticulocytes, decreased hemoglobin levels, and elevated bilirubin levels. The bilirubin can then penetrate the underdeveloped blood–brain barrier in the newborn and bind to the basal ganglia and cerebellum, resulting in bilirubin-induced neurological dysfunction [Citation7]. There have been numerous studies on the antigens of IgG in newborn hemolytic disease. IgG subtypes may become a mainstay of future testing, so we are interested in IgG subtypes and their association with newborn hemolytic disease.
HDN is commonly seen in clinical practice and is caused by ABO or Rh blood type incompatibility. It can result in jaundice, edema, hepatosplenomegaly, and may also lead to bilirubin encephalopathy. The treatment of HDN includes prenatal and postnatal interventions [Citation8]. Prenatal treatment involves timely delivery, intrauterine blood transfusion, intravenous immunoglobulin therapy to inhibit hemolysis, and oral enzyme inducers to ensure intrauterine safety. Postnatal treatment includes: 1) Phototherapy: newborns diagnosed with HDN who have jaundice are treated with blue light to reduce bilirubin levels. The blue light, with a wavelength of 425–475 nm, breaks down the unconjugated bilirubin into conjugated bilirubin, which is then excreted through urine and stool [Citation9]. 2) Medication: Hepatic enzyme inducers, such as phenobarbital, promote liver metabolism, synthesis, and the breakdown of bilirubin. Intravenous immunoglobulin therapy suppresses hemolytic reactions and acts as immunotherapy. Additionally, human albumin helps convert free bilirubin into conjugated bilirubin for excretion in urine, reducing the amount of unbound bilirubin entering the brain. 3) Exchange transfusion: Severe anemia often occurs in severe hemolysis and may be treated with small transfusions [Citation10]. In cases of severe jaundice that meet the criteria for exchange transfusion, rapid removal of free bilirubin antibodies and lethal red blood cells is done to reduce hemolysis and prevent bilirubin encephalopthy [Citation11, Citation12]. To ensure the consistency and minimize interference in the treatment of HDN, we selected blood samples from mild cases treated with phototherapy for non-targeted metabolomic analysis.
Metabolomics is the study of small endogenous molecules derived from cells, tissues, or biological fluids [Citation13]. Analytical methods for metabolomics are usually divided into non-targeted (global analysis) or targeted (analysis of a defined set of compounds) [Citation14]. Both global and targeted metabolite analyses use common detectors such as mass spectrometry (MS) or nuclear magnetic resonance (NMR). Global analysis aims to capture as many metabolite features as possible [Citation15]. These massive datasets are then used to compare normal and disease states and identify valuable metabolic features. A major strength of non-targeted metabolomics is its ability to discover new and potentially relevant metabolites, which can serve as the basis for further treatment or prognostic markers [Citation16, Citation17]. Therefore, we plan to collect blood samples from HDN and HDN treatment groups for non-targeted metabolomic analysis to discover new and potentially relevant metabolites, which can serve as the basis for further treatment or prognostic markers.
Although previous studies have supported the use of IgG as a diagnostic marker for HDN [Citation18], there are few studies on the relationship between IgG isoforms and metabolites in blood and HDN. Through this study, we hope to discover certain differential metabolites in HDN and analyze their correlation with IgG subtypes to determine their relevance in HDN.
2. Material and methods
2.1. Material preparation
In this retrospective study, we collected plasma 23 samples from newborns born within one week of full-term delivery at Zhuzhou 331 Hospital, including 15 healthy newborns, 8 newborns with hemolytic disease (HDN group), and 5 newborns with blue light exposure (BLI group). The mothers of all 8 patients had blood type O, the fathers of 3 patients had blood type A, 4 patients had blood type B, and 1 patient had blood type AB. All neonates had no other underlying disease and were breastfed only. The study was approved by the Medical Ethics Committee of Zhuzhou 331 Hospital (No. ZZS331YYLL-202112-K1-H1). The research was conducted according to the World Medical Association Declaration of Helsinki. All the information about the study was fully explained to the subjects of their parents by the researchers, and their parents signed informed consent forms.
2.2. Serum biochemistry
At room temperature, the blood was allowed to coagulate for 30 min before centrifugation (3000 rpm, 10 min) to obtain the serum samples. Next, the levels of total bilirubin (TBiL), direct bilirubin (DBiL), and total bile acids (TBA) in the serum samples were determined using the Olympus AU5400 fully automated biochemistry analyzer.
2.3. Enzyme-linked immunosorbent assay (ELISA)
ELISA kits for IgG1 (E-EL-H6087, Elabscience, WuHan), IgG2a (YJ038048, YuanJu, Shanghai), IgG2b (YJ038047, YuanJu, Shanghai), IgG3 (E-EL-H6088, Elabscience, WuHan), and IgG4 (E-EL-H6186, Elabscience, WuHan) were purchased. Standard wells and test sample wells were set up. Each well was loaded with 100 μL of standard or test sample. The test samples were gently mixed. The plate was covered with a sealer. The samples were incubated at 37°C for 2 h. Then, 100 μL of horseradish peroxidase-conjugated avidin working solution was added to each well, covered with a new sealer, and incubated at 37°C for 1 h. Substrate solution (90 μL) was added to each well and incubated at 37°C in the dark for 15-30 min. The optical density (OD) of each well was sequentially measured at a wavelength of 450 nm using an ELISA reader within 5 min after terminating the reaction.
2.4. Liquid chromatograph-mass spectrometer (LC-MS)
After collecting the three groups of serum samples, 100 μL of sample was taken, and 300 μL of methanol (67-56-1, CNW, Shanghai) and 20 μL of internal standard were added. After vortex mixing for 30 s, the mixture was subjected to ultrasonic extraction in an ice bath for 5 min. It was then allowed to stand at −20°C for two hours and centrifuged at 4°C, 13,000 rpm for 15 min. The supernatant (200 μL) was transferred to a 2 mL sample vial for LC-MS analysis. The quality control samples (QC) were prepared by combining equal amounts of extracted samples to assess the repeatability of the analysis under consistent processing conditions. To monitor the consistency of the analysis process, a QC sample was inserted every 6–10 test samples during instrument analysis. The LC-MS analysis instrument platform utilized an Agilent 1290 UHPLC system coupled with a Q Exactive Orbitrap mass spectrometer from Thermo Fisher Scientific. The UPLC HSS T3 column (1.7 μm, 2.1*100 mm, Waters) was used for chromatographic separation. Mobile phase A was a 0.1% formic acid aqueous solution (631-61-8, CNW, Shanghai), and mobile phase B was acetonitrile (75-05-8, CNW, Shanghai). The negative mode was as follows: mobile phase A was 5 mM ammonium acetate aqueous solution adjusted to pH 9.0 with ammonia water, and mobile phase B was acetonitrile. The Q Exactive Orbitrap mass spectrometer was used to acquire primary and secondary mass spectrometry data.
2.5. Statistical analysis
All measurement data are expressed as Mean ± standard deviation (SD). Each test was repeated independently three times. All data were analyzed using SPSS 26.0 software (IBM, Armonk, NY, USA). One-way Analysis of Variance (ANOVA) and Tukey's HSD post-hoc test were used to compare data among three groups. Pearson's method was used to analyze the correlation between metabolites. The degrees of freedom, the sum of squares and the mean of the sum of squares were used to present the analysis results. The difference was statistically significant at P < 0.05.
3. Results
3.1. HDN
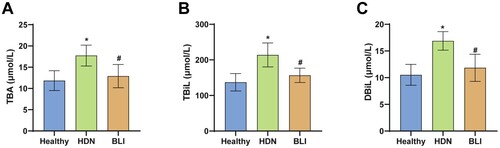
Serum samples were collected from healthy newborns and newborns with hemolytic disease. The levels of TBA, TBiL, and DBiL were measured in the biochemical analysis of the samples. The results showed that compared to the Healthy group, the HDN group had significantly higher levels of TBA, TBiL, and DBiL, indicating overabundance of heme breakdown into the bile pathway. Compared to the HDN group, the BLI group had lower levels of TBA (A), TbiL (B), and DbiL (C), which returned to healthy levels. In summary, HDN is associated with levels of TBA, TBiL, and DBiL.
Figure 1. Abnormal levels of TBA, TBiL, and DBiL in newborns with hemolytic disease. A. Levels of TBA in the serum of newborns in each group. B. Levels of TBiL measured in biochemical analysis. C. Levels of DBiL in the serum of newborns in each group. * indicates a significant difference compared to the Healthy group, P < 0.05. # indicates a significant difference compared to the HDN group, P < 0.05.
3.2. Levels of IgG subtypes IgG1, IgG2a, IgG2b, IgG3, and IgG4 in HDN
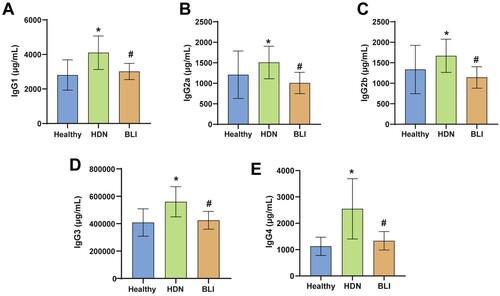
Previous results indicated abnormal bile metabolism in newborns with hemolytic disease. To explore the diagnostic role of multiple indicators in newborns with hemolytic disease, we measured the levels of IgG subtypes in the serum of each group. Compared to the Healthy group, the HDN group exhibited significantly elevated levels of IgG1 (A), IgG2a (B), IgG2b (C), IgG3 (D), and IgG4 (E), suggesting abnormal levels of IgG subtypes in newborns with hemolytic disease. Compared to the HDN group, the BLI group had significantly lower levels of IgG1, IgG2a, IgG2b, IgG3, and IgG4, which were reduced to healthy levels. In summary, HDN is associated with levels of IgG subtypes.
Figure 2. Abnormal levels of IgG subtypes in HDN. A. ELISA was used to measure the levels of IgG1 in the serum of newborns in each group. B. ELISA was used to measure the levels of IgG2a in the serum of newborns in each group. C. Levels of IgG2b in each group. D. Levels of IgG3 in the serum of newborns in the Healthy, HDN, and BLI groups. E. Levels of IgG4 in the serum of newborns in the three groups. * indicates a significant difference compared to the Healthy group, with statistical significance set at P < 0.05. # indicates a significant difference compared to the HDN group, with statistical significance set at P < 0.05.
3.3. Differential metabolites in HDN
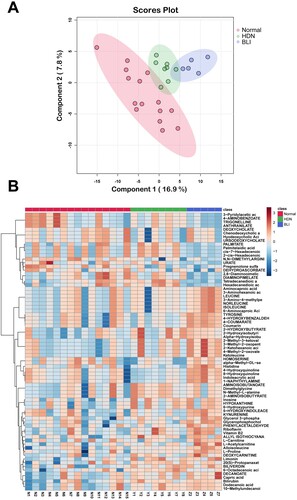
The above results showed abnormal levels of bile metabolites and IgG subtypes in HDN. We further explored whether other metabolites in newborn serum were abnormal. Principal component analysis (PCA) results showed a distance between the three groups of metabolites, with the first principal component accounting for 16.9% and the second principal component accounting for 7.8% (A). This suggested significant differences in metabolism among the Healthy, HDN, and BLI groups. We selected the top 71 different metabolites and created a heatmap to compare their levels among the groups. The heatmap showed that compared to the Healthy group, the HDN group had decreased levels of Histidine, 4-Hydroxyquinoline, and Indoleacrylic acid, and increased levels of PALMITATE, Palmitelaidic acid, cis-7-Hexadecenoic, 2-cis-7-Hexadecenoic, and other metabolites. Compared to the HDN group, the BLI group had decreased levels of PALMITATE, Palmitelaidic acid, cis-7-Hexadecenoic, 2-cis-7-Hexadecenoic, and increased levels of Histidine, 4-Hydroxyquinoline, Indoleacrylic acid, and other metabolites (B). In summary, there are abnormal levels of metabolites in HDN.
Figure 3. Abnormal levels of metabolites in HDN. A. PCA showing the differences in metabolites among the Healthy, HDN, and BLI groups. B. The top 71 different metabolites among the Healthy, HDN, and BLI groups.
3.4. Correlation analysis
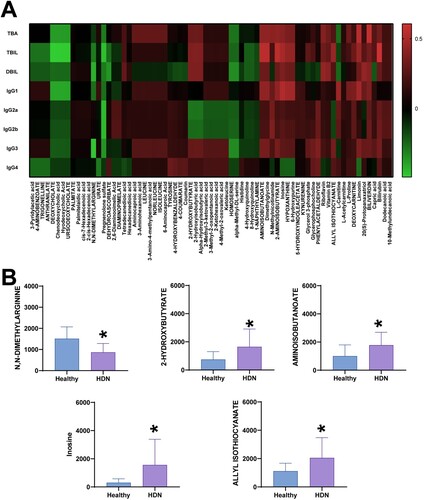
The above results showed differences in total bilirubin, IgG subtypes, and metabolites in the serum of HDN in the Healthy, HDN, and BLI groups. As total bilirubin is an important indicator for the traditional diagnosis of HDN, we further analyzed the correlation between TBA, TBiL, DBiL, IgG subtypes, and the 71 different metabolites. The results showed negative correlations between 3-Pyridylacetic acid, 4-AMINOBENZOATE, TRIGONELLINE, ANTHRANILATE, DEOXYCHOLATE, and TBA, TBiL, DBiL, and IgG subtypes. In contrast, Aminocaproic acid, 3-Aminohexanoic acid, LEUCINE, 3-Amino-4-methylpentanoic acid, and NORLEUCINE showed positive correlations with TBA, TBiL, DBiL, and IgG subtypes (A). The data indicate that compared to the Healthy group, the HDN group had decreased levels of N, N-DIMETHYLARGININE, and increased levels of 2-HYDROXYBUTYRATE, AMINOISOBUTANOATE, Inosine, ALLYL ISOTHIOCYANATE, and other metabolites (B). In summary, differential metabolites are correlated with IgG subtypes.
Figure 4. Correlation between HDN and metabolites. A. Correlation heatmap. B. Levels of metabolites in the two groups. * indicates a significant difference compared to the Healthy group, P < 0.05.
4. Discussion
In our research, we found abnormal increases in the levels of TBA, TBiL, and DBiL in newborn with hemolytic disease. There were differences in the levels of metabolites and IgG subtypes in the serum among different groups. Data analysis results showed significant correlations between different metabolites, IgG subtypes, and TBA, TBiL, and DBiL.
Immunoglobulin G (IgG) subtypes include IgG1, IgG2a, IgG2b, IgG3, IgG4, and other indicators [Citation19–22]. The hinge region of IgG is a major regulator of IgG2 and IgG3 activity [Citation23]. It has been reported that IgG1 promotes immune reactions against tumors. The production of tumor-specific IgG1 promotes the development of macrophages, dendritic cells, and natural killer cells to bind to IgG1-associated tumors [Citation24]. The antigens expressed in hybrid glucosides are characterized by the production of IgG-mediated autoimmunity, in contrast to the most common phenotype in Caucasians, which usually produces autoimmunity of an IgM nature after blood transfusion or pregnancy [Citation25]. Nevertheless, anti-M and anti-N antibodies have been identified as the cause of hemolytic reactions following blood transfusion and neonatal anemia, the latter with severe consequences [Citation26, Citation27]. Our findings showed abnormally elevated levels of IgG1, IgG2a, IgG2b, IgG3, and IgG4 in newborn with hemolytic disorders compared to normal newborns, which is consistent with the abnormal levels of IgG in these disorders. This indicated that IgG subtypes play a certain role in diagnosing the severity of hemolytic disease.
There are multiple metabolic abnormalities in newborn with hemolytic disease, including 3-Pyridylacetic acid, 4-AMINOBENZOATE, TRIGONELLINE, ANTHRANILATE, DEOXYCHOLATE, Aminocaproic acid, 3-Aminohexanoic acid, LEUCINE, 3-Amino-4-methylpentanoic acid, NORLEUCINE, and others. It has been reported that 3-Pyridylacetic acid is a leading compound in the development of androgen biosynthesis inhibitors for the treatment of hormone-dependent prostate cancer [Citation28]. TRIGONELLINE significantly reduces tumor size, restores Nrf2, NF-кB p65, Bcl-2, Cyclin D1, ICAM-1, and MMP-2, improves cGMP and active caspase 3, and improves tissue structure, showing potential therapeutic effects on lung cancer [Citation29]. Treatment with anti-leucine transporter protein may be an important choice for prostate cancer treatment. In the absence of leucine, LNCaP, DU145, and PC-3 cell lines all show a 90% decrease in vitality [Citation30]. The results showed a negative correlation between 3-Pyridylacetic acid, 4-AMINOBENZOATE, TRIGONELLINE, ANTHRANILATE, and DEOXYCHOLATE with TBA, while Aminocaproic acid, 3-Aminohexanoic acid, LEUCINE, 3-Amino-4-methylpentanoic acid, and NORLEUCINE showed a positive correlation with TBA. 3-Pyridylacetic acid and TRIGONELLINE may be beneficial factors for the treatment of hemolysis, while LEUCINE may be a detrimental factor. The differential metabolites in newborn with hemolytic disease can be a research direction for future studies. Metabolomics findings may also be affected by a variety of patient-related variables (e.g. formula versus breastfeeding, age, etc.), which warrants further exploration.
In summary, there is a disruption in the levels of metabolites in the blood of newborn with hemolytic disease compared to healthy newborns, and there are correlations between TBA, TBiL, DBiL, IgG1, IgG2a, IgG2b, IgG3, IgG4, and different metabolites. Among them, there is a negative correlation between 2-HYDROXYBUTYRATE, AMINOISOBUTANOATE, Inosine, ALLYL ISOTHIOCYANATE, and a positive correlation with N, N-DIMETHYLARGININE. These metabolites have a certain diagnostic role in determining the severity of HDN.
supplementary_material.docx
Download MS Word (49.2 KB)Disclosure statement
No potential conflict of interest was reported by the author(s).
Additional information
Funding
References
- Myle AK, Al-Khattabi GH. Hemolytic disease of the newborn: a review of current trends and prospects. Pediatric Health Med Ther. 2021;12:491–498. doi:10.2147/phmt.S327032
- Jackson ME, Baker JM. Hemolytic disease of the fetus and newborn: historical and current state. Clin Lab Med. 2021;41:133–151. doi:10.1016/j.cll.2020.10.009
- Dziegiel MH, Krog GR, Hansen AT, et al. Laboratory monitoring of mother, fetus, and newborn in hemolytic disease of fetus and newborn. Transfus Med Hemother. 2021;48:306–315. doi:10.1159/000518782
- Firan M, Bawdon R, Radu C, et al. The MHC class I-related receptor, FcRn, plays an essential role in the maternofetal transfer of gamma-globulin in humans. Int Immunol. 2001;13:993–1002. doi:10.1093/intimm/13.8.993
- Borghi S, Bournazos S, Thulin NK, et al. FcRn, but not FcγRs, drives maternal-fetal transplacental transport of human IgG antibodies. Proc Natl Acad Sci USA. 2020;117:12943–12951. doi:10.1073/pnas.2004325117
- de Winter DP, Kaminski A, Tjoa ML, et al. Hemolytic disease of the fetus and newborn: systematic literature review of the antenatal landscape. BMC Pregnancy Childbirth. 2023;23:12, doi:10.1186/s12884-022-05329-z
- Metcalf RA, Khan J, Andrews J, et al. Severe ABO hemolytic disease of the newborn requiring exchange transfusion. J Pediatr Hematol Oncol. 2019;41:632–634. doi:10.1097/mph.0000000000001248
- Karanam A, Bandiya P. Hemolytic disease of newborn: beyond Rh-D and ABO incompatibility. Indian Pediatr. 2021;58:794–795.
- Vardar G, Okan MA, Karadag N, et al. Intravenous immunoglobulin in hemolytic disease of the newborn: a moving target in time. Niger J Clin Pract. 2022;25:1262–1268. doi:10.4103/njcp.njcp_1_22
- Sun Y, Ma T, Wang WH, et al. Transfusion rates and disease spectrum in neonates treated with blood transfusion in China. Medicine (Baltimore). 2020;99:e19961, doi:10.1097/md.0000000000019961
- Delaney M, Matthews DC. Hemolytic disease of the fetus and newborn: managing the mother, fetus, and newborn. Hematology Am Soc Hematol Educ Program. 2015;2015:146–151. doi:10.1182/asheducation-2015.1.146
- Sainio S, Nupponen I, Kuosmanen M, et al. Diagnosis and treatment of severe hemolytic disease of the fetus and newborn: a 10-year nationwide retrospective study. Acta Obstet Gynecol Scand. 2015;94:383–390. doi:10.1111/aogs.12590
- Johnson CH, Ivanisevic J, Siuzdak G. Metabolomics: beyond biomarkers and towards mechanisms. Nat Rev Mol Cell Biol. 2016;17:451–459. doi:10.1038/nrm.2016.25
- Schrimpe-Rutledge AC, Codreanu SG, Sherrod SD, et al. Untargeted metabolomics strategies-challenges and emerging directions. J Am Soc Mass Spectrom. 2016;27:1897–1905. doi:10.1007/s13361-016-1469-y
- Guijas C, Montenegro-Burke JR, Warth B, et al. Metabolomics activity screening for identifying metabolites that modulate phenotype. Nat Biotechnol. 2018;36:316–320. doi:10.1038/nbt.4101
- Filla LA, Edwards JL. Metabolomics in diabetic complications. Mol Biosyst. 2016;12:1090–1105. doi:10.1039/c6mb00014b
- Fiehn O. Metabolomics by gas chromatography-mass spectrometry: combined targeted and untargeted profiling. Curr Protoc Mol Biol. 2016;114:30.34.31–30.34.32. doi:10.1002/0471142727.mb3004s114
- Sarwar A, Citla Sridhar D. Rh hemolytic disease. In StatPearls. StatPearls Publishing Copyright © 2024, StatPearls Publishing LLC., Treasure Island (FL).2024.
- Gulli F, Basile U, Gragnani L, et al. IgG cryoglobulinemia. Eur Rev Med Pharmacol Sci. 2018;22:6057–6062. doi:10.26355/eurrev_201809_15943
- Zhang X, Jin X, Guan L, et al. IgG4-related disease with gastrointestinal involvement: case reports and literature review. Front Immunol. 2022;13:816830, doi:10.3389/fimmu.2022.816830
- Tsuda M, Okada H, Kojima N, et al. Cecal patches generate abundant IgG2b-bearing B cells that are reactive to commensal microbiota. J Immunol Res. 2022;2022:3974141, doi:10.1155/2022/3974141
- Wang F, Tsai JC, Davis JH, et al. Design and characterization of mouse IgG1 and IgG2a bispecific antibodies for use in syngeneic models. MAbs. 2020;12:1685350, doi:10.1080/19420862.2019.1685350
- Dahan R, Sega E, Engelhardt J, et al. FcγRs modulate the anti-tumor activity of antibodies targeting the PD-1/PD-L1 axis. Cancer Cell. 2015;28:285–295. doi:10.1016/j.ccell.2015.08.004
- Yu J, Song Y, Tian W. How to select IgG subclasses in developing anti-tumor therapeutic antibodies. J Hematol Oncol. 2020;13:45, doi:10.1186/s13045-020-00876-4
- Páez M, Jiménez M, Corredor A. Hemolytic disease in fetuses and newborns due to antibodies against the M-antigen. Biomedica. 2021;41:643–650. doi:10.7705/biomedica.5930
- Yasuda H, Ohto H, Nollet KE, et al. Hemolytic disease of the fetus and newborn with late-onset anemia due to anti-M: a case report and review of the Japanese literature. Transfus Med Rev. 2014;28:1–6. doi:10.1016/j.tmrv.2013.10.002
- Ishida A, Ohto H, Yasuda H, et al. Anti-M antibody induced prolonged anemia following hemolytic disease of the newborn due to erythropoietic suppression in 2 siblings. J Pediatr Hematol Oncol. 2015;37:e375–e377. doi:10.1097/mph.0000000000000341
- Rowlands MG, Barrie SE, Chan F, et al. Esters of 3-pyridylacetic acid that combine potent inhibition of 17 alpha-hydroxylase/C17,20-lyase (cytochrome P45017 alpha) with resistance to esterase hydrolysis. J Med Chem. 1995;38:4191–4197. doi:10.1021/jm00021a008
- Hamzawy MA, Abo-Youssef AM, Malak MN, et al. Multiple targets of Nrf 2 inhibitor; TRIGONELLINE in combating urethane-induced lung cancer by caspase-executioner apoptosis, cGMP and limitation of cyclin D1 and Bcl2. Eur Rev Med Pharmacol Sci. 2022;26:9393–9408. doi:10.26355/eurrev_202212_30690
- Otsuki H, Kimura T, Yamaga T, et al. Prostate cancer cells in different androgen receptor status employ different leucine transporters. Prostate. 2017;77:222–233. doi:10.1002/pros.23263