
ABSTRACT
Background:
Acute myeloid leukemia (AML) with t(8;21) manifests as a diverse hematological malignancy. Although it was categorized into a favorable subtype, 30–40% of patients experience relapse. The objective of this research was to devise a nomogram for the accurate anticipation of both overall survival (OS) and cancer-specific survival (CSS) in t(8;21) AML.
Methods:
From the Surveillance, Epidemiology, and End Results (SEER) database, individuals diagnosed with t(8;21) AML from 2000 to 2018 were selected. Prognostic factors for t(8;21) AML were identified using Cox regression analysis and Akaike Information Criterion (AIC), forming the basis for constructing prognostic nomograms.
Results:
Key variables, including first primary tumor, age group, race, and chemotherapy, were identified and integrated into the nomogram. The C-index values for the nomograms predicting OS and CSS were 0.753 (validation: 0.765) and 0.764 (validation: 0.757), respectively. Ultimately, based on nomogram scores, patients were stratified into high-risk and low-risk groups, revealing significant disparities in both OS and CSS between these groups (P < 0.001).
Conclusion:
This study innovatively crafted nomograms, incorporating clinical and therapeutic variables, to forecast the 1-, 3-, and 5-year survival rates for individuals with t(8;21) AML.
Introduction
t(8;21) AML is a heterogeneous blood cancer, constituting 20% [Citation1] of pediatric and 4-15% [Citation2–5] of adult AML cases. Primarily, the majority of t(8;21) AML instances fall under the AML-m2b subtype in the FAB nomenclature [Citation6]. The translocation t(8;21)(q22;q22) leads to a RUNX1::RUNX1T1 fusion gene (also known as AML1::ETO). Although it was categorized into a favorable subtype, 30–40% of patients experience relapse and carry an inferior outcome, suggesting other factors influence the prognosis [Citation7–9].
Diverse clinical characteristics and prognostic factors, like sex, age, race, marital status, and chemotherapy usage, have been identified in prior studies as influencing the prognosis of t(8;21) AML patients [Citation10,Citation11]. Recognizing the constraints associated with relying on a single prognostic factor, the development of a novel nomogram prognostic model becomes essential. Nomograms serve as a graphical representation of mathematical relationships, offering an intuitive visualization of Cox models to address the limitations of single-factor prognostication [Citation12]. They are widely utilized as diagnostic and prognostic tools in the domain of oncology and medical science [Citation13].
The SEER database, constituting approximately 30% of the United States population, offers an extensive population-based cohort of t(8;21) AML patients [Citation14]. In our research, individuals diagnosed disease with t(8;21) AML between 2000 and 2018 were included from the SEER database. The aim was to investigate the clinical and prognostic characteristics of t(8;21) AML, delineate distinctions between pediatric and adult patients, and subsequently formulate prognostic nomograms for t(8;21) AML.
Materials and methods
Patient selection and data collection
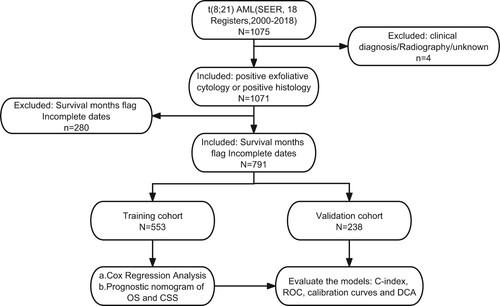
Our research utilized data extracted from the SEER database software (SEER*Stat v8.4.0.1). The process of t(8;21) AML patient selection and collection of clinical data occurred within the case listing session of the SEER research dataset spanning 18 registries from 2000 to 2018. Illustrated in , the inclusion criteria for t(8;21) AML patients included those with: (1) histology code 9896/3, in accordance with the International Classification of Disease for Oncology, 3rd Edition (ICD-O-3); (2) a favorable exfoliative cytology or confirmation through a favorable histology diagnosis. Exclusion standards comprised: (1) image, clinical, or unknown diagnosis; (2) unknown survival time. To outline the clinical features of t(8;21) AML patients, the following data points were extracted: marital status at diagnosis, age, race, gender, first malignant primary indicator, year of diagnosis, treatment, survival status, survival time, and reason for death.
Figure 1. Flowchart for screening eligible patients and subsequent analysis process.
As the SEER database is openly accessible, with patient identifiers anonymized, ethical concerns were considered unnecessary, and the requirement for approval from the ethics committee was deemed unnecessary.
Development, validation, and assessment of nomograms
In the training cohort, both univariate and multivariate Cox regression analyses were applied to pinpoint the elements that independently contribute to risk linked to the OS and CSS of t(8;21) AML patients. Additionally, AIC and Harrell's C-index were computed to discern the ultimate prognostic elements for incorporation into the prognostic nomograms [Citation15]. The nomogram's execution was further evaluated in the validation cohort, gauging its discriminatory capability through the AUC of the ROC. Predictive accuracy was evaluated through calibration curve plotting. DCA was utilized to assess the clinical applicability. Assigning each patient an aggregate point for predicting survival rates using the nomograms, higher scores correlated with lower survival rates. Using optimal cut-off values, X-tile software for the aggregate points were determined to effectively stratify risks into low – and high-risk categories. Statistical assessment of the disparities in OS and CSS between these categories was conducted using log-rank tests and Kaplan-Meier survival analysis.
Statistical examination
The Mann–Whitney U-test was utilized to compare continuous variables among various groups, whereas categorical variables were appraised by means of either the chi-squared test or Fisher's exact test. OS and CSS were computed using the Kaplan-Meier method and subjected to comparison through the log-rank test. In this research, each statistical assessment was conducted using R software (version 4.1.0) and involved the application of packages like ‘survminer,’ ‘survival,’ ‘ggDCA,’ and ‘rms.’ A two-tailed P-value below 0.05 was regarded as the criterion for statistical importance.
Results
Clinical features of patients
In total, 791 individuals diagnosed with t(8;21) AML between 2000 and 2018 were identified from the SEER database, and their demographic and clinical features are succinctly presented in . Median age for these t(8;21) AML patients was 53 years, with an age range spanning from 0 to 94 years. The majority were male (54.4%), of white ethnicity (73.2%), and diagnosed between 2010 and 2018 (57.9%). Additionally, a significant proportion (80.8%) had t(8;21) AML as their initial primary tumor. Regarding treatment, the majority (84.8%) underwent chemotherapy, with solely a tiny fraction opting for radiotherapy (5.3%).
Table 1. Baseline characteristics of patients diagnosed with t(8;21) AML from the SEER database
Considering the exclusion of pediatric patients with t(8;21) AML from the prior study based on SEER, [Citation16–18] in Table S1, we furnish a comparative analysis of demographic and clinical characteristics for both groups, with a particular focus on scrutinizing the clinical features of pediatric patients aged 19 years or younger.
Amidst total 791 patients with t(8;21) AML, only 109 belonged to the pediatric group. As delineated in Table S1, the mean age of pediatric patients was 12 years. Furthermore, an overwhelming 97.2% of children developed t(8;21) AML as their initial primary tumor, a prevalence significantly higher than observed in adults. Almost all pediatric patients underwent chemotherapy, surpassing the 82.6% rate observed in adults. In the broader context, pediatric patients exhibited a favorable prognosis, boasting a 3-year overall survival rate of 80.8%.
Survival analysis
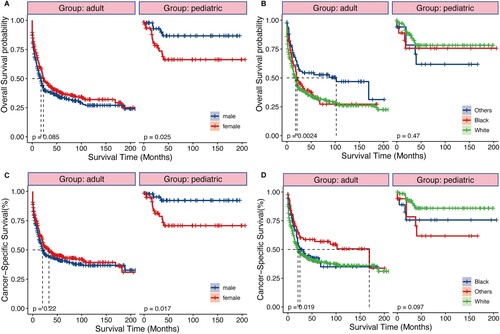
Among the 791 patients with t(8;21) AML in the research, 448 experienced mortality (56.64%), with 377 succumbing specifically to AML (47.66%). Employing the log-rank test and Kaplan-Meier survival analysis, we quantified and depicted OS and CSS, stratifying individuals according to the year of diagnosis. As illustrated in , t(8;21) AML patients exhibited a median OS time of 24 months, along with a 3-year OS rate of 45.9%. Simultaneously, the median CSS time was 24 months, accompanied by a 45.9% 3-year CSS rate. Despite a rise in the patient population, patients diagnosed with the disease from 2010 to 2018 had significantly higher OS and CSS rates than those diagnosed from 2000 to 2009, with a median OS of 52 and 14 months and median CSS of ‘Not reached’ and 18 months, respectively (all P < 0.0001). This suggests a significant improvement in survival outcomes over the past two decades. In addition, we conducted a subgroup survival analysis between pediatric and adult patients. As shown in , sex and race exhibited distinct effects on pediatric and adult prognosis. The prognosis of male pediatric patients was significantly better than that of female (all P < 0.05), while there was no difference in prognosis between males and females among adult patients. Concerning race, black adult patients exhibited better OS (P = 0.0024), but there was no statistically significant difference in outcomes among pediatric patients of different races.
Figure 2. Kaplan – Meier analysis of overall survival (OS) and cancer-specific survival (CSS) in t(8;21) AML. Kaplan – Meier survival curves of OS for all patients (A), patients stratified by year of diagnosis (B). Kaplan – Meier survival curves of CSS for all patients (C), patients stratified by year of diagnosis (D).
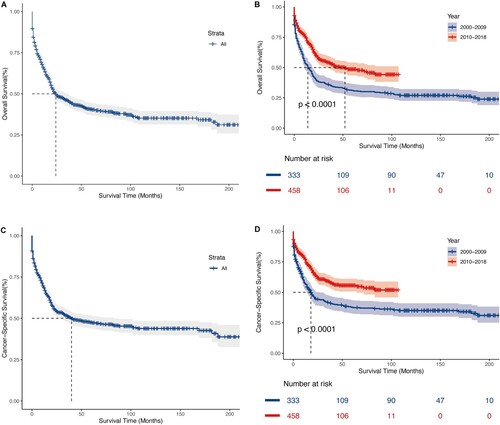
Figure 3. Kaplan – Meier analysis of OS and CSS in pediatric and adult patients, respectively. Kaplan – Meier survival curves of OS and CSS for patients stratified by sex (A and C), race (B and D).
The selection of prognostic factors and the development of nomograms
t(8;21) AML patients underwent random allocation into the training (n = 553) and validation cohorts (n = 238). The training and validation cohorts displayed no statistically significant differences across any of the nine variables examined in the univariate Cox analysis, as indicated in . Within the training group, independent prognostic markers were identified through univariate Cox analysis, revealing no significant correlation between the year of diagnosis and OS or CSS in t(8;21) AML patients (). Moving forward, multivariate Cox analysis, considering six remaining variables, indicated that factors such as age group (≥60 years), non-primary tumor status, and lack of chemotherapy were associated with poorer survival outcomes (HR > 1, P < 0.05), whereas sex, radiation, and marital status exhibited no significant risk (P > 0.05) (). The combination of Cox regression results and AIC outcomes from stepwise regression led to the identification of age group (≤19, 20–39, 40–59, ≥ 60), first primary tumor (yes, no), race (others, black, white), and chemotherapy (no/unknown, yes) as vital prognostic elements for constructing OS and CSS nomograms (as presented in ). In the training group, the C-index values for the OS and CSS nomograms were 0.753 (95% confidence interval [CI]: 0.726–0.780) and 0.764 (95% CI: 0.725–0.803), respectively. In the validation cohort, these C-index values were 0.765 (95% CI: 0.736–0.794) for the OS nomogram and 0.757 (95% CI: 0.724–0.806) for the CSS nomogram.
Figure 4. Nomograms for predicting the 1-, 3 - and 5-year OS rates (A) and CSS rates (B) for t(8;21) AML patients.
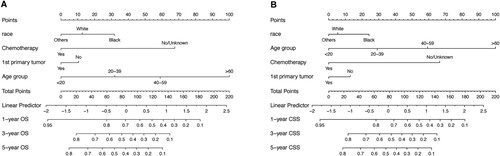
Table 2. Univariate analyses of OS and CSS in the training cohort.
Table 3. Multivariate analyses of OS and CSS in the training cohort.
Nomogram validation and evaluation
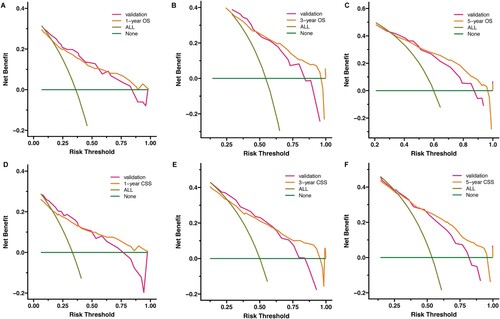
To evaluate the capabilities of discrimination and calibration for the OS and CSS nomograms, we generated calibration curves and ROC curves ( and Figure S1). Analyzing the ROC curves showed AUC values of 0.814, 0.778, 0.788 for the training group's 1-, 3-, and 5-year survival rates, and 0.823, 0.788, 0.798 for the validation group's 1-, 3-, and 5-year survival rates. Similarly, for the validation cohort, the AUC values were 0.835, 0.777, 0.773 and 0.836, 0.773, 0.760 for the 1-, 3-, and 5-year survival rates, respectively. Furthermore, the calibration curves illustrated excellent concordance between actual and nomogram-predicted survival rates at 1, 3, and 5 years in both the validation and training groups. To assess the clinical applicability of the nomograms, DCA was utilized, revealing a substantial positive net benefit for both the OS and CSS nomograms. This result emphasizes the robust clinical utility and positive effectiveness in estimating 1-, 3-, and 5-year survival rates, as illustrated in .
Figure 5. Receiver operating characteristic (ROC) and calibration curves of the nomogram for OS. The AUC of using the nomogram for predicting 1-, 3-, and 5-year OS were 0.814, 0.778, and 0.788 in the training cohort (A) and 0.835, 0.777, and 0.773 in the validation cohort (C). Calibration curves of the nomogram for predicting 1-, 3-, and 5-year OS in the training cohort (B) and in the validation cohort (D). The horizontal axis indicates the survival rate predicted by the model, and the vertical axis indicates the actual survival rate. The 45-degree line indicates the ideal reference where the predicted and actual survival rates consist, and the pink, dark green, and orange lines indicate the model's predicted and actual survival rates for 1-year, 3-year, and 5-year OS, respectively.
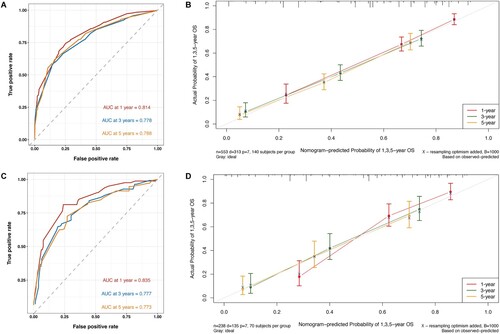
Figure 6. Decision curve analysis (DCA) of the nomogram for predicting 1-, 3 and 5 - year OS rates (A-C) and CSS rates (D-F) in t(8;21) AML patients in the training cohort and the validation cohort, respectively. The x-axis represents threshold probabilities, and the y-axis measures the net benefit. The horizontal line along the x-axis represents no deaths occurring, and the dark green line represents all patients died. All = assume all patients survive. None = assume none survives.
Risk stratification based on the nomogram points
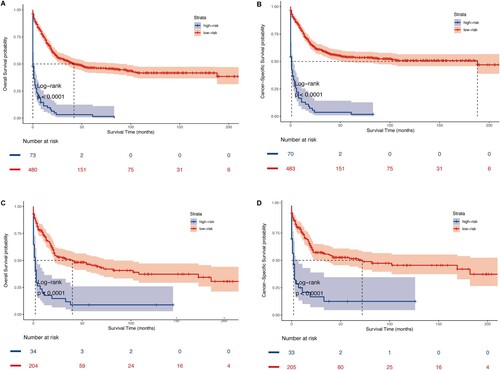
To facilitate prognostic stratification, patients were categorized into 2 risk groups according to nomogram points: low-risk with lower points and high-risk with higher points. The optimal cut-off values for overall survival and cancer-specific survival nomogram points were determined as 142.4 and 162.9, respectively, through X-tile analysis in the training group (Figure S2). Kaplan-Meier survival analysis demonstrated a clear stratification of patients with t(8;21) AML into low-risk individuals with a more favorable prognosis and high-risk individuals with a less favorable prognosis. The stratification unveiled notable variations, with statistically prominent disparities observed in OS (P < 0.001) and CSS (P < 0.001) as depicted in (A–C and B–D). In summary, the Kaplan-Meier survival analysis highlighted the capacity to classify t(8;21) AML patients into two groups: low-risk, characterized by a more favorable prognosis, and high-risk, marked by a less favorable prognosis. This categorization demonstrated statistically prominent disparities in OS (P < 0.001) and CSS (P < 0.001) as well.
Figure 7. Kaplan – Meier analysis of OS and CSS in t(8;21) AML patients for risk stratifification. Kaplan – Meier survival curves of OS and CSS in t(8;21) AML patients stratified by the total points in the training cohort (A, C) and validation cohort (B, D).
Discussion
Nomograms are widely recognized as reliable and convenient tools for prognostic estimation across various tumor types [Citation13,Citation19]. In this study, a comprehensive analysis was conducted on totally 791 t(8;21) AML patients, leveraging the SEER database. Through multivariate analysis, age group, race, first primary tumor, and the utilization of chemotherapy emerged as independent prognostic elements for OS and CSS in individuals with t(8;21) AML as well. This research marks the inaugural efforts to create and authenticate a nomogram for estimating OS and CSS in t(8;21) AML patients using data from the SEER database.
Indeed, age has consistently emerged as a significant predictor for tumor prognosis in various studies [Citation18–20]. Previous publications reported that adult AML patients aged ≤45 years had significantly better OS than the other two older groups (45–60 and >60) [Citation21]. In a French study, the reported 5-year overall survival rate for 60 elderly patients with t(8;21) AML was notably low at 31% [Citation22]. In our study, age group remained the most powerful predictor for t(8;21) AML. In contrast to individuals aged 19 years or younger, patients within the age groups of 20–39 years, 40–59 years, or over 60 years exhibited inferior OS and CSS outcomes. Notably, those aged over 60 years displayed the most unfavorable survival outcomes. This finding suggested that survival outcomes significantly decline with an increase in age at diagnosis, aligning with the aforementioned studies.
For the past 30 years, the conventional treatment of AML has been to induce chemotherapy based on cytarabine, and then give consolidation and intensive treatment after remission, or choose hematopoietic stem cell transplantation (HSCT) at an appropriate time [Citation23]. During this investigation, the application of chemotherapy was recognized as an unassociated risk element for survival, whereas the utilization of radiotherapy did not emerge as an independent prognostic element. It is noteworthy that the specific details of the chemotherapy regimen were not available for further analysis. The inherent limitations within the SEER database may introduce bias to our findings, and, as such, these results should be approached with caution. Our findings may be subject to inherent biases within the SEER database. Therefore, caution should be exercised in interpreting these results.
Consistent with prior studies, our observations align with the indication that sex, region, and marital status serve as predictors of outcomes in AML patients [Citation10,Citation11]. Marcucci et al. further highlighted that race played a significant role as a predictor for t(8;21) AML, with nonwhites experiencing induction failure more frequently and demonstrating shorter OS compared to whites [Citation24]. However, compared to age group and chemotherapy, the weightage assigned to sex, race, and marital status in the nomogram was lower, indicating a relatively weaker predictive ability for these factors.
Secondary AML (sAML), originating from antecedent hematologic disorders or prior cancer treatments, frequently presents a less favorable result in comparison to de novo AML [Citation25]. In accordnace with the Czech study, complete remission (CR) was attained in merely 48.9% of patients undergoing curative therapy, a notable contrast to the 74.6% observed in de novo AML cases (P < 0.001). Disparities in overall survival were also evident among the groups achieving CR, with the sAML group exhibiting a median OS of 14.1 months, in stark contrast to the 37.4 months observed in de novo AML [Citation26]. sAML with inv(16)/t(16;16) or t(8;21) appears to have diminished OS compared with de novo AML, consistent with our study [Citation27].
The assessment of model fitting employed the Akaike Information Criterion (AIC), with model selection hinging on achieving the minimal AIC value. Through the integration of these prognostic factors, our study crafted prognostic nomograms for estimating 1-, 3-, and 5-year OS and CSS in patients diagnosed with t(8;21) AML. As far as we are aware, no dedicated risk assessment model currently exists for t(8;21) AML patients. Our nomograms exhibited superior discrimination and calibration capabilities, along with possible clinical applicability, validated across both validation and training groups. Furthermore, the stratification of patients into two distinct risk groups utilizing the nomogram points enabled accurate identification of individuals with different survival outcomes. Our nomograms have the potential to provide clinicians with a simple and accurate tool for prognostic prediction in t(8;21) AML.
This study is not without limitations. Firstly, being retrospective in nature, it is inherently susceptible to unavoidable biases. Secondly, we conducted internal verification of the data and aim to obtain external validation in real-world settings in the future. Like other SEER-based studies, a multitude of clinicopathological and biological features were not available, potentially confounding our results and hindering the inclusion of novel prognostic indicators in our nomograms. Information on whether patients underwent chemotherapy was only provided, but detailed chemotherapy regimens, such as chemotherapy agents used and number of cycles were unknown. Another important limitation is the absence of follow-up data on relapse or disease progression in the SEER database, rendering information on these critical factors unavailable.
In conclusion, we have taken the lead in creating and validating innovative nomograms designed for t(8;21) AML patients, marking the first utilization of the SEER database for this purpose. The nomograms hold promise in delivering clinicians a reliable and precise prognostic prediction for survival in t(8;21) AML. Further prospective studies are warranted to explore new prognostic models incorporating novel markers.
Supplementary Material.docx
Download MS Word (1.9 MB)Acknowledgements
This work was supported by the Medical Science Data Center in Shanghai Medical College of Fudan University.
Disclosure statement
No potential conflict of interest was reported by the author(s).
Additional information
Funding
References
- Pui CH, Carroll WL, Meshinchi S, et al. Biology, risk stratification, and therapy of pediatric acute leukemias: an update. J Clin Oncol. 2011;29(5):551–565. doi: 10.1200/JCO.2010.30.7405
- Döhner H, Estey E, Grimwade D, et al. Diagnosis and management of AML in adults: 2017 ELN recommendations from an international expert panel. Blood. 2017;129(4):424–447. doi: 10.1182/blood-2016-08-733196
- Papaemmanuil E, Gerstung M, Bullinger L, et al. Genomic classification and prognosis in acute myeloid leukemia. N Engl J Med. 2016;374(23):2209–2221. doi: 10.1056/NEJMoa1516192
- Faber ZJ, Chen X, Gedman AL, et al. The genomic landscape of core-binding factor acute myeloid leukemias. Nat Genet. 2016;48(12):1551–1556. doi: 10.1038/ng.3709
- Grimwade D, Hills RK, Moorman AV, et al. Refinement of cytogenetic classification in acute myeloid leukemia: determination of prognostic significance of rare recurring chromosomal abnormalities among 5876 younger adult patients treated in the United Kingdom Medical Research Council trials. Blood. 2010;116(3):354–365. doi: 10.1182/blood-2009-11-254441
- Yushu H, Shougeng B, Zhijian X, et al. Acute myeloid leukemia M2b. Haematologica. 1999;84(3):193–194.
- Solh M, Yohe S, Weisdorf D, et al. Core-binding factor acute myeloid leukemia: Heterogeneity, monitoring, and therapy. Am J Hematol. 2014;89(12):1121–1131. doi: 10.1002/ajh.23821
- Byrd JC, Mrózek K, Dodge RK, et al. Pretreatment cytogenetic abnormalities are predictive of induction success, cumulative incidence of relapse, and overall survival in adult patients with de novo acute myeloid leukemia: results from Cancer and Leukemia Group B (CALGB 8461). Blood. 2002;100(13):4325–4336. doi: 10.1182/blood-2002-03-0772
- Schlenk RF, Benner A, Krauter J, et al. Individual patient data-based meta-analysis of patients aged 16 to 60 years with core binding factor acute myeloid leukemia: a survey of the German Acute Myeloid Leukemia Intergroup. J Clin Oncol. 2004;22(18):3741–3750. doi: 10.1200/JCO.2004.03.012
- Acharya UH, Halpern AB, Wu QV, et al. Impact of region of diagnosis, ethnicity, age, and gender on survival in acute myeloid leukemia (AML). J Drug Assess. 2018;7(1):51–53. doi: 10.1080/21556660.2018.1492925
- Borate UM, Mineishi S, Costa LJ. Nonbiological factors affecting survival in younger patients with acute myeloid leukemia. Cancer. 2015;121(21):3877–3884. doi: 10.1002/cncr.29436
- Balachandran VP, Gonen M, Smith JJ, et al. Nomograms in oncology: more than meets the eye. Lancet Oncol. 2015;16(4):e173–e180. doi: 10.1016/S1470-2045(14)71116-7
- Bianco FJ Jr. Nomograms and medicine. Eur Urol. 2006;50(5):884–886. doi: 10.1016/j.eururo.2006.07.043
- Clegg LX, Reichman ME, Miller BA, et al. Impact of socioeconomic status on cancer incidence and stage at diagnosis: selected findings from the surveillance, epidemiology, and end results: National Longitudinal Mortality Study. Cancer Causes Control. 2009;20(4):417–435. doi: 10.1007/s10552-008-9256-0
- Harrell FE Jr, Lee KL, Mark DB. Multivariable prognostic models: issues in developing models, evaluating assumptions and adequacy, and measuring and reducing errors. Stat Med. 1996;15(4):361–387. doi: 10.1002/(SICI)1097-0258(19960229)15:4<361::AID-SIM168>3.0.CO;2-4
- Chen C, Wang P, Wang C. Prognostic nomogram for adult patients with acute myeloid leukemia: a SEER database analysis. Medicine (Baltimore). 2019;98(21):e15804. doi: 10.1097/MD.0000000000015804
- Sasaki K, Ravandi F, Kadia TM, et al. De novo acute myeloid leukemia: a population-based study of outcome in the United States based on the Surveillance, Epidemiology, and End Results (SEER) database, 1980 to 2017. Cancer. 2021;127(12):2049–2061.
- Zuo Z, Zhang G, Song P, et al. Survival nomogram for stage IB non-small-cell lung cancer patients, based on the SEER database and an external validation cohort. Ann Surg Oncol. 2021;28(7):3941–3950. doi: 10.1245/s10434-020-09362-0
- Zhang SL, Chen C, Rao QW, et al. Incidence, prognostic factors and survival outcome in patients with primary hepatic lymphoma. Front Oncol. 2020;10:750. doi: 10.3389/fonc.2020.00750
- Xing Z, Zhu X, Li Z, et al. Incidence, clinical characteristics, and prognostic nomograms for patients with myeloid sarcoma: a SEER-based study. Front Oncol. 2022;12:989366. doi: 10.3389/fonc.2022.989366
- Lin D, Zhou C, Wei H, et al. Characteristics and treatment outcomes in 822 adult patients with acute myeloid leukemia: a single center experience. Zhonghua Xue Ye Xue Za Zhi. 2014;35(12):1058–1064.
- Prébet T, Boissel N, Reutenauer S, et al. Acute myeloid leukemia with translocation (8;21) or inversion (16) in elderly patients treated with conventional chemotherapy: a collaborative study of the French CBF-AML intergroup. J Clin Oncol. 2009;27(28):4747–4753. doi: 10.1200/JCO.2008.21.0674
- Pollyea DA, Bixby D, Perl A, et al. NCCN guidelines insights: acute myeloid leukemia, version 2.2021. J Natl Compr Canc Netw. 2021;19(1):16–27. doi: 10.6004/jnccn.2021.0002
- Marcucci G, Mrózek K, Ruppert AS, et al. Prognostic factors and outcome of core binding factor acute myeloid leukemia patients with t(8;21) differ from those of patients with inv(16): a Cancer and Leukemia Group B study. J Clin Oncol. 2005;23(24):5705–5717. doi: 10.1200/JCO.2005.15.610
- Winer ES. Secondary acute myeloid leukemia: a primary challenge of diagnosis and treatment. Hematol Oncol Clin North Am. 2020;34(2):449–463. doi: 10.1016/j.hoc.2019.11.003
- Szotkowski T, Muzik J, Voglova J, et al. Prognostic factors and treatment outcome in 1,516 adult patients with de novo and secondary acute myeloid leukemia in 1999-2009 in 5 hematology intensive care centers in the Czech Republic. Neoplasma. 2010;57(6):578–589. doi: 10.4149/neo_2010_06_578
- Matthews A, Pratz KW. Optimizing outcomes in secondary AML. Hematology Am Soc Hematol Educ Program. 2022;2022(1):23–29. doi: 10.1182/hematology.2022000324