
 ?Mathematical formulae have been encoded as MathML and are displayed in this HTML version using MathJax in order to improve their display. Uncheck the box to turn MathJax off. This feature requires Javascript. Click on a formula to zoom.
Abstract
Background: A patient-centred approach with self-monitoring of blood glucose (SMBG) has emerged as the preferred approach in monitoring and managing blood glucose. The success of SMBG in diabetes treatment and management relies heavily on the accurate and reproducible measurement of blood glucose values.
Aim: To evaluate whether patients and healthcare professionals can accurately estimate blood glucose using photometric strips, by visually matching them to colorimetric charts.
Methods: A cross-sectional study design was used with participants enrolled from patients and healthcare providers attending and working at the Diabetes Clinic of Kalafong Provincial Tertiary Hospital (KPTH). A convenience sample of 144 patients and 10 healthcare professionals was enrolled.
Results: Limits of agreement of patient and healthcare professional visual estimates were 11.1 to 10.4 mmol/l and 6.7 to 5.7 mmol/l, respectively. The mean difference for estimates by healthcare professionals was 0.8 mmol/l (95% CI 1.30–0.31 mmol/l) while patient estimates had a mean difference of 0.4 mmol/l (95% CI 1.2−0.5 mmol/l).
Conclusions: The study noted that visual colour matching was inexact and generally would overestimate blood glucose. Healthcare professionals gave visual estimates that were more accurate in comparison with patients.
Introduction
The prevalence and incidence of diabetes has been on the rise globally, including in South Africa, and this trend is projected to continue.Citation1,Citation2 In 2010, the global prevalence of diabetes among adults in the age group 20–79 years was estimated to be 6.4%, and by the year 2030 diabetes in the same age group is projected to be 7.7%.Citation3 In 2010, diabetes prevalence in South Africa, despite the paucity of diabetes prevalence data, was estimated to be 4.5% for adults aged between 20 and 79 years and is projected to affect 4.9% of this age group by 2030.Citation3 This increasing trend of diabetes, previously viewed as a Western ailment or a disease of the affluent, is becoming an epidemic in Africa.Citation4
The shift of diabetes to epidemic levels has been driven by several factors, among them rapid urbanisation, obesity and an increasing life expectancy. These factors are, among others, leading to the phenomenon of epidemiologic transition as described by Habib.Citation5 Epidemiologic transition is characterised by a shift in cause of morbidity and mortality from predominantly communicable diseases to non-communicable diseases.Citation6 Communicable diseases in 1990 were responsible for 42% of global mortality and in 2020 are projected to be responsible for 17% of global mortality.Citation5 Conversely, NCDs, which in 1990 were responsible for 47% of global mortality, are expected in the year 2020 to be responsible for about 69% of global mortality.Citation5 South Africa is not exempt from this transition. Bradshaw (2003) estimated that 51% of the deaths in South Africa in the year 2000 were due to communicable diseases, HIV/AIDS inclusive, with NCDs contributing 37% of total mortality.Citation6 Statistics South Africa (StatsSA) in its 2013 report on causes of mortality, identified NCDs as the leading cause of mortality at 51.3% and communicable diseases at 38.4% of total mortality.Citation7 Evidently, NCDs have become a leading cause of mortality globally and in South Africa specifically, with diabetes, an NCD itself, contributing to the high mortality figures.Citation5,Citation8
Diabetes is characterised by a hyperglycaemic state; hence, the treatment and management of the disease focuses on controlling the blood glucose level of patients to near normal. The target blood glucose interval for diabetic patients is between 4.0 and 10.0 mmol. Consequently, when blood glucose exceeds 11 mmol, it is considered hyperglycaemic and, similarly, when blood glucose falls below 4 mmol it presents hypoglycaemia. Both hyperglycaemia and hypoglycaemia present symptoms that are problematic and may lead to complications.
Chronic hyperglycaemia can contribute to organ damage and failure.Citation9 The organs mostly affected are eyes, kidneys, peripheral nerves, heart and blood vessels.Citation10 In the year 2000, diabetes was responsible for about 4.3% of deaths recorded in South Africa.Citation10 In the same year, diabetes also contributed to 14% of ischaemic heart disease (IHD), 10% of stroke, 12% of hypertensive disease and 12% of renal disease mortalities, which mostly affected people aged 30 years and above.Citation11–13 These numbers are evidence of how much diabetes and its complications have contributed to the disease burden in South Africa, making treatment and management a necessity.
The treatment and management of diabetes requires close monitoring to prevent hyper- and hypoglycaemia. A patient-centred approach, self-monitoring of blood glucose (SMBG), has emerged as the preferred approach in the management and care of diabetic patients on insulin therapy.Citation1,Citation14 Self-monitoring of blood glucose (SMBG) empowers patients in the management of diabetes. The patients thereby become actively involved in setting their own glycaemic control targets and achieving them.Citation15 The success of SMBG in diabetes treatment and management relies heavily on the accurate and reproducible measurement of blood glucose values.
Glucometers used in SMBG use one of two technologies to measure blood glucose: reflectance photometry or electrochemical reactions.Citation10,Citation16 Reflectance photometry glucometers make use of photometry strips that contain a chemically impregnated test strip that reacts with blood glucose, resulting in a colour change on the test strip.Citation10,Citation17 The resulting colour change on the reflectance photometric strips may be interpreted using a digital glucometer to determine the blood glucose level. Alternatively, the colour change can be visually matched against a blood glucose concentration colorimetric chart (on the glucometer strip container), to obtain a visual estimate of blood glucose. Electrochemical glucometers make use of electrochemical strips that contain ions which change conductance as they react with blood glucose.Citation17 The change in the conductance of the ions is interpreted to give a blood glucose reading by a glucometer.Citation18 In South Africa, both technologies discussed above are in use to measure and monitor blood glucose. However, there are a variety of other glucometers in use, and the preference for device depends on technical performance, affordability and availability of the devices among other factors.Citation19
Visually estimating blood glucose by colour matching photometric strips to colorimetric charts remains convenient and easy to use, in the absence of a photometric glucometer. However, a major shortcoming of visually estimating blood glucose using reflectance photometry strips is the ability to accurately match the colour change with that on the colorimetric charts.
Reflectance photometry strips make use of a colour change, and visual matching interpretation requires good colour vision and perception. Diabetic patients are susceptible to vision impairments and this may compromise their ability to perform visual matching accurately when using the visual estimation for SMBG approach. The acceptable errors for glucometer readings set by the International Organisation for Standardization (ISO) are less than approximately 20% for measures greater than 4.2 mmol/l and less than approximately 0.83 mmol/l for measures less than 4.2 mmol/l.Citation1 The accurate visually estimated measurements should preferably also be in compliance with the ISO standard.Citation1 In a 1981 study by Clements et al., visual estimates of blood glucose using Chemstrips showed strong correlation between visually estimated blood glucose and the true glucose readings (r = 0.966); however, it did not assess clinical relevance of the blood glucose measures.Citation20 Clinical relevance of blood glucose measures obtained from different methods was assessed by Clarke et al. in 1987, in a study that affirmed the usefulness of an error grid.Citation21 In the Clarke et al. study, visual blood glucose estimates had 96.1% of the total readings in zones A and B of the error grid, suggesting the technique is a highly accurate one, largely giving clinically relevant measures.Citation21 That study, however, did not specify the number of participants who gave the visual estimates but described them as laboratory personnel and patients. Given the impact of diabetes on eyesight it is important to establish how well patients estimate blood glucose visually. Earlier studies that have attempted to evaluate the visual ability of patients to estimate blood glucose relied on linear correlation. This study combined Bland–Altman plots and Error Grid Analysis to assess visual ability applied to different groups (healthcare providers and patients) for comparison.
This study examined the ability of diabetic patients and healthcare professionals to accurately interpret the colour change on a reflectance photometric strip using colorimetric charts (printed on the glucometer strip container) to estimate blood glucose. The cost of glucometers is high and the availability of blood glucose monitoring is significantly limited in lower income populations. Currently no home glucose monitoring is available for type 2 diabetic patients accessing primary health care in the Tshwane district. This study attempted to evaluate the accuracy of an alternative cheaper option of blood glucose monitoring without using a glucometer.
Materials and methods
Study population and patient selection
The study was a cross-sectional study conducted at the Diabetes Clinic of Kalafong Provincial Tertiary Hospital (KPTH), in Atteridgeville, Pretoria. The study population was selected from patients and healthcare providers attending and working in the Kalafong Hospital Diabetes Clinic. The patients seen at the clinic are adult outpatients, with type 1 or type 2 diabetes. In terms of blood glucose control, the clinic has patients across the spectrum from poorly controlled to well-controlled diabetic patients. Convenience sampling was used to select study participants.
Data collection
Patients on the clinic's records attend scheduled appointments at the clinic throughout the year. During these visits blood glucose and the general well-being of the patient are noted. The appointment list of the clinic allowed the investigator to identify patients who met the inclusion criteria and, based on that information, approach them to ask for their participation in the study. Informed consent was obtained from all participants.
Participating patients were asked to estimate their blood glucose concentration by matching colour changes that occurred on photometric strips, Accu-Chek® Active strips (Roche Diabetes Care, Burgess Hill, UK), to a colorimetric chart. The healthcare professional attending to them would also visually estimate the patient's blood glucose. The procedure for the collection of visual estimates was as follows: first, the healthcare professional placed a sample of blood from a patient's pricked finger onto the photometric strip. Second, the strip was inserted into a reflective photometric glucometer, Accu-Chek®, by the investigator who recorded the blood glucose reading on the glucometer. The patient and the healthcare professional were blinded from the actual blood glucose measured by the glucometer. Third, for visual estimates, the photometric strip was then handed to the patient and healthcare professional to observe and note their visual estimates individually on a collection form to avoid bias.
Statistical methods
Stata® 12.0 software package (StataCorp, College Station, TX, USA) and R (R Centre for Statistical Computing, Vienna, Austria) were used for statistical analysis. For categorical variables; frequency and percentages were used to describe the data (). For continuous variables, the Shapiro–Wilk test was run with a p-value (p < 0.05) to test normality (). Normally distributed continuous data had means reported, and non-normally distributed data had the median and IQR reported.
Bland–Altman plots were used to compare glucometer concentration values obtained by a glucometer (true values) with values obtained by visual matching of reflectance photometric strips to colorimetric charts. Agreement of values was tested by plotting the difference between visual estimates and true values against the mean of true values and visual estimates or the reference values.
Clarke's error grid analysis was used to assess the impact on clinical decisions, if any, of using visual colour matching to estimate blood glucose. Clarke's error grid is used to classify glucose measures taken by an alternative method according to their accuracy with regard to a reference method. In the study the reference method was the glucometer reading.
Results
Of the 144 patients, 47 (32.6%) were male and 97 (67%) were female (). A total of 25 patients were reported to have complications related to diabetes, 15 of whom had visual complications. In terms of HbA1c, 16 (14.2%) of the patients were well controlled (HbA1c < 7%), 37 (32.7%) of patients enrolled had moderately controlled glucose and 60 (53.1%) had poorly controlled glucose (HbA1c > 10%). A total of 80 (55.6%) of the patients had type 2 diabetes and 59 (41.0%) had type 1 diabetes. The Ishihara test identified only one colour-blind patient.
Table 1: Descriptive demographics (categorical data)
Table 2: Summary table of continuous variables
Bland–Altman plots
Bland–Altman plots were used to assess differences between true blood glucose measures, i.e. measures obtained by a glucometer, and visual estimates given by patients and healthcare professionals.
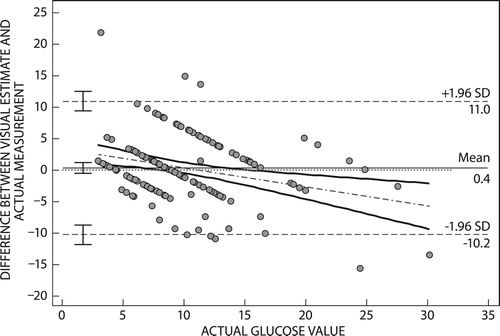
The Bland–Altman plot for patient estimates () had a mean difference of 0.4 mmol/l (95% CI 1.2−0.5 mmol/l). The plot had limits of agreement (11.0−10.2 mmol/l), with a bias of +0.4 mmol/l.
Figure 1: Bland–Altman plot for blood glucose estimates by patients and glucometer readings.
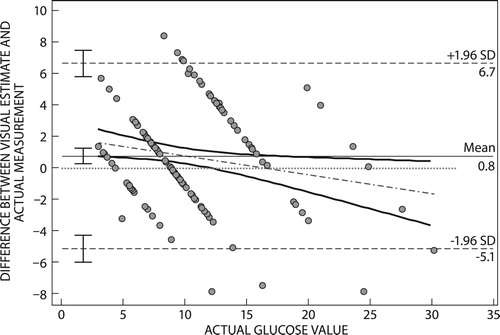
Bland–Altman plots for estimates by healthcare professionals () had a mean difference of 0.80 mmol/l (95% CI 1.30–0.31 mmol/l). The estimates of healthcare professionals had limits of agreement (6.7−5.7 mmol/l), with a bias of +0.8 mmol/l.
Figure 2: Bland–Altman plot for blood glucose estimates by healthcare professionals and glucometer readings.
Clarke's error grid analysis
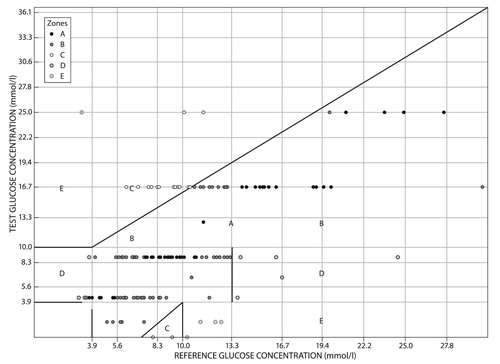
Zone A had 48 (33.3%) of the total blood glucose estimates by patients, which meant 33.3% of the total blood glucose estimates were within approximately 20% of the actual blood glucose. Zone B was the modal zone and had 62 (43.1%) of the total estimates that were in excess of 20% from the actual blood glucose but would not result in inappropriate treatment. Zone C had 20 (13.9%) of the total blood glucose estimates, which in terms of treatment meant 13.9% of the total estimations would have resulted in an unnecessary treatment response. Zone D made up nine (6.3%) of the total blood glucose estimates. Zone E had five (3.5%) of the total blood estimates, which in terms of treatment would have resulted in confusion by the patient on how to respond ().
Figure 3: Clarke's error grid of blood glucose estimates by patients with glucometer readings as reference values. On the right the number of estimates and percentages in each zone.
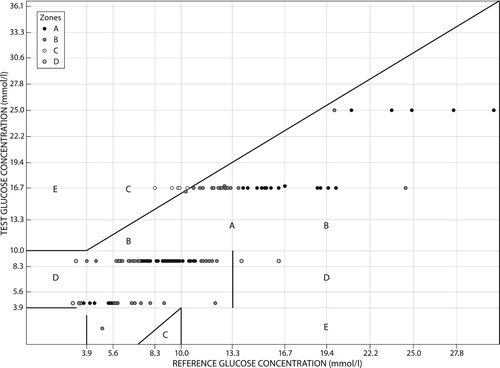
indicates estimates of blood glucose given by healthcare professionals, which had 68 (47.2%) estimates in zone A, 65 (45.1%) in zone B, 5 (3.5%) in zone C and 6 (4.2%) in zone D. Zone A was the modal zone with 47% of the estimates being approximately 20% from the actual blood glucose measure. Zone B had 45.1% of the total estimates, which were more than approximately 20% from the actual glucose and would not result in inappropriate treatment. Zone C had 5 (3.5%) of the total estimates; in treatment terms, 3.5% of the estimates would result in inappropriate treatment. Zone D had 6 (4.2%) of the estimates, which would result in potential confusion between hypoglycaemic and hyperglycaemic states.
Figure 4: Clarke's error grid of blood glucose estimates by healthcare professionals with glucometer readings as reference. On the right the number of estimates and percentages in each zone.
Discussion
Bland–Altman plots of the difference between patient visual glucose estimates and true values had limits of agreement of 11.1 to 10.4 mmol/l, while estimates of healthcare professionals and true values had a limit of agreement of 6.7 to 5.7 mmol/l. This meant that healthcare professionals gave estimates that were closer to the true blood glucose measure in comparison with patient estimates. The mean difference for estimates by healthcare professionals was 0.8 mmol/l (95% CI 1.30–0.31 mmol/l), while patient estimates had a mean difference of 0.4 mmol/l (95% CI 1.28−0.5 mmol/l). In this study, despite the narrower limits of agreement by healthcare professionals, the 95% CI of their mean estimates did not include a mean difference of zero. This means the visual estimations given by healthcare professionals are not as accurate as glucometer readings. The positive mean difference in estimates given by both patients and healthcare professionals indicates a positive bias for visually estimated glucose. A positive bias on the Bland–Altman plot arises when the reference method (glucometer reading) is less than the method under assessment (visual estimation), an indication of an overestimation by the method under assessment. For patients the mean difference for estimates had a 95% CI that included a mean difference of zero. This means visual estimation of glucose by patients may result in glucose readings closer to that of a glucometer, despite the positive bias.
The Clarke's error grid analysis ( and ) classified the estimates into five clinical categories, zones A–E. The estimates in zone A indicated estimates within 20% of the actual glucose value. Zone A formed the modal zone for estimates given by healthcare professionals, with the modal zone for patient estimates being zone B. This meant estimates given by healthcare professionals were more likely to result in estimates that were more clinically relevant when compared with patient estimates.
Zone C, which identifies results that would lead to an unnecessary treatment response, had 13.9% and 3.5% of estimates of patients and healthcare professionals respectively. This meant for this study, in a clinical setting, patient participants were more likely to erroneously respond to measurements when not required in comparison with estimates by healthcare professionals. The potential for adverse incidents arising from the use of visual estimates would have been higher in the patient estimate group compared with estimates by healthcare professionals. This is suggested by the higher ratio of estimates in zones E and D of patient estimates as compared with zone D for healthcare professionals.
A similar study by Essack in 2009,1 in which five glucometers were compared, was performed in South Africa. In their study, across glucometers proportional bias was observed as the blood glucose increased, a trend this study observed. Essack's study showed differences in blood glucose measures across devices, differences this study also noted between estimates by patients and healthcare professionals. The accuracy of the measures was judged on the ISO guidelines, which stipulate that, at most, the blood glucose measures should be within approximately 20% of the true value. For this study, 33.3% of patient estimates, and 47.2% of estimates by healthcare professionals, complied with these guidelines. This meant visual estimates were consistently higher than the true value, a finding consistent with a positive bias for all visual estimates.
Limitations
The study sampled a limited number of healthcare professionals when compared with patients. This meant that, over the course of the study, healthcare professionals would have gone through a learning curve as they gave multiple visual estimates an opportunity that was not afforded to patients participating in the study.
The colorimetric chart used for estimating blood glucose in the study made use of six colour shades with corresponding glucose values on a continuous scale that ranges from 0 mmol/l to > 25 mmol/l. Despite asking patients to estimate values in between colour shade scale values on the glucose strip container, both patients and healthcare providers most commonly selected a value in agreement with the printed shades. This led to estimated values in discrete bands. The use of a colorimetric chart with more blood glucose colour code estimates might have improved the results.
Conclusion
Patients are unable to estimate blood glucose by visual estimation when it matters. They will be at risk of overtreating hypoglycaemia or inappropriately changing treatment if they use the visual method of blood glucose monitoring. Healthcare professionals are better at visual estimation of blood glucose; however, they should preferably use a glucose measuring device in order to properly assess the blood glucose of patients.
The cost of an incorrect blood glucose test may result in inappropriate treatment implemented for hypoglycaemia with resultant risk of hospital admission or even hypoglycaemic brain injury. Inaccurate identification or underestimation of high blood glucose may result in result in inappropriate adjustment of treatment with delays in glucose control. The risk of long-term diabetes complications, and acute hyperglycaemic complications, which significantly escalate the costs of diabetes management, may result.
Colorimetric matching in the estimation of blood glucose is inexact, and its use by patients or healthcare providers should not be encouraged. Despite visual colour matching being inexact, healthcare professionals gave visual estimates that were more accurate in comparison with those of patients.
Ethical approval
Ethical approval to perform the study was obtained.
Disclosure statement
No potential conflict of interest was reported by the authors.
ORCID
Danie G van Zyl http://orcid.org/0000-0002-1507-9984
References
- Essack Y, Hoffman M, Rensburg M, et al. A comparison of five glucometers in South Africa. J Endocrinol Metab Diab S Af. 2009;14(2):102–5.
- Rheeder P. Type 2 diabetes: the emerging epidemic. S Af Fam Pract. 2006;48(10):20. doi: 10.1080/20786204.2006.10873480
- Shaw JE, Sicree RA, Zimmet PZ. Global estimates of the prevalence of diabetes for 2010 and 2030. Diabetes Res Clin Pract. 2010;87(1):4–14. doi: 10.1016/j.diabres.2009.10.007
- Lam DW, LeRoith D. The worldwide diabetes epidemic. Curr Opin Endocrinol Diabetes Obes. 2012;19(2):93–6. doi: 10.1097/MED.0b013e328350583a
- Habib SH, Saha S. Burden of non-communicable disease: global overview. Diabetes Metab Syndr Clin Res Rev. 2010;4(1):41–7. doi: 10.1016/j.dsx.2008.04.005
- Bradshaw D, Groenewald P, Laubscher R, et al. Initial burden of disease estimates for South Africa, 2000. S Afr Med J. 2003;93(9):682–7.
- Statistics South Africa. Mortality and causes of death in South Africa, 2013: Findings from death notification. 2014.
- Whiting DR, Guariguata L, Weil C, et al. IDF diabetes Atlas: global estimates of the prevalence of diabetes for 2011 and 2030. Diabetes Res Clin Pract. 2011;94:311–21. doi: 10.1016/j.diabres.2011.10.029
- American Diabetes Associations. Diagnosis and classification of diabetes mellitus. Diabetes Care. 2013;36(SUPPL.1):67–74.
- Bode BW. The accuracy and interferences in self-monitoring of blood glucose. US Endocr Dis. 2007;2007:46–8. doi: 10.17925/USE.2007.00.2.46
- Peer N, Steyn K, Lombard C, et al. Rising diabetes prevalence among urban-dwelling black South Africans. PLoS One. 2012;7(9):e43336. doi: 10.1371/journal.pone.0043336
- Bradshaw D, Norman R, Pieterse D, et al. Estimating the burden of disease attributable to diabetes in South Africa in 2000. SAMJ. 2007;97(8):700–6.
- Mayosi B, Flisher A, Lalloo U, et al. The burden of non-communicable diseases in South Africa. Lancet. 2009;374(9693):934–47. doi: 10.1016/S0140-6736(09)61087-4
- Kenya S, Lebron C, Reyes Arrechea E, et al. Glucometer use and glycemic control among Hispanic patients with diabetes in southern Florida. Clin Ther. 2014;36(4):485–93. doi: 10.1016/j.clinthera.2013.12.009
- Freckmann G, Baumstark A, Schmid C, et al. Evaluation of 12 blood glucose monitoring systems for self-testing: system accuracy and measurement reproducibility. Diabetes Technol Ther. 2014;16(2):113–22. doi: 10.1089/dia.2013.0208
- Rheney CC, Kirk JK. Performance of three blood glucose meters. Ann Pharmacother. 2000;34(3):317–21. doi: 10.1345/aph.19187
- Rebel A, Rice MA, Fahy BG. The accuracy of point-of-care glucose measurements. J Diabetes Sci Technol. 2012;6(2):396–411. doi: 10.1177/193229681200600228
- Wang J. Glucose biosensors: 40 years of advances and challenges. Electroanal. 2001;13(12):983–8. doi: 10.1002/1521-4109(200108)13:12<983::AID-ELAN983>3.0.CO;2-#
- Kay DASC. Diabetes self-management education enhanced by the low vision professional. Review. 2007 Jan 1;38(4):170.
- Clements RS, Keane NA, Kirk KA, et al. Comparison of various methods for rapid glucose estimation. Diabetes Care. 1981;4(3):392–5. doi: 10.2337/diacare.4.3.392
- Clarke WL, Cox D, Gonder-Frederick LA, et al. Evaluating clinical accuracy of systems for self-monitoring of blood glucose. Diabetes Care. 1987;10(5):622–8. doi: 10.2337/diacare.10.5.622