
Abstract
Aim: To assess control and morbidity in patients with type 1 diabetes mellitus (T1 attending a tertiary adult diabetes clinic in Durban, South Africa.
Methods: A retrospective chart review of all patients with T1D who attended clinic in the years 2006, 2012 and 2015. Clinical and laboratory changes were assessed at an individual patient-level follow-up (IPLF) and whole clinic level (n = 231).
Results: In the IPLF study arm (n = 58; 45% Black patients; 62% female; median age 18 years), mean HbA1c [% (mmol/mol)] decreased from 9.9 ± 2.6% (85 ± 28) in 2006 to 8.7 ± 1.5% (72 ± 16) in 2012 (p < 0.001) and to 9.1 ± 1.7% (76 ± 19) in 2015 (p = 0.03); target HbA1c < 7.0% (< 53 mmol/mol) was achieved in 7.1%, 5.3% and 8.3%, respectively. Compared with 2006, in 2015 there was a higher prevalence of retinopathy (10.3% vs. 29.3%, p = 0.004), abnormal glomerular filtration rate (0% vs. 6.9%, p = 0.04) and abnormal serum creatinine (0% vs. 8.6%, p = 0.02). Predictive risk factors for new retinopathy included diabetes duration (OR 1.4; 95% CI 1.0–1.3; p = 0.03) and diastolic blood pressure (OR 1.15; 95% CI 1.0–1.3; p = 0.04).
Conclusion: Glycaemic control improved over 10 years, but fell short of recommended targets. Intensive efforts are required to achieve current targets for glycaemic and non-glycaemic control.
Introduction
The Diabetes Control and Complications Trial (DCCT) established that the risk of microvascular complications (new retinopathy, albuminuria and neuropathy) in subjects with type 1 diabetes (T1D) was significantly reduced with intensive therapy (IT) (median HbA1c 7.2%; 55 mmol/mol), compared with conventional treatment (CT), (median HbA1c 9.1%; 76 mmol/mol).Citation1 The DCCT findings supported the improved outcome with better glycaemic control in T1D shown in earlier studies.Citation2–4 In the follow-up study to the DCCT, the Epidemiology of Diabetes Interventions and Complications (EDIC) trial, despite the difference in HbA1c being negligible between the two groups by year five, the original IT group had a lower risk of micro- and macro-vascular complications as long as 18 years after the commencement of EDIC (and 28 years after starting the DCCT).Citation5,Citation6 This supported the concept of metabolic memory/legacy effect and the long-term benefit of stringent glycaemic control. This was confirmed in a recent systematic review and meta-analysis of 12 studies, which showed that when compared with CT, IT had a significantly lower risk of developing retinopathy (6.2 vs. 23.2%), nephropathy (16.3 vs. 28.4%) and neuropathy (4.9 vs. 13.9%).Citation7
Glycaemic targets vary according to age and clinical circumstances. The International Society of Paediatric and Adolescent Diabetes (ISPAD) guidelines recommend a target HbA1c of less than 7.5% (58 mmol/mol) for children and adolescents.Citation8 In adults with T2D, the Society of Endocrinology, Metabolism and Diabetes of South Africa (SEMDSA) and the American Diabetes Association (ADA) recommend a target HbA1c of < 7.0% (< 53 mmol/mol) for most patients; a more stringent target of < 6.5% (< 48 mmol/mol) can be considered in young patients with no co-morbidities, while a range of 7.1–8.5% (54–69 mmol/mol) is advised for older patients with multiple co-morbidities.Citation9,Citation10 Despite these published guidelines, the glycaemic goals are seldom achieved. In the United States only 21% of patients between the ages of 13 and 20 years with T1D attained an HbA1c below 7.5% (58 mmol/mol).Citation11 A meta-analysis of eight studies showed that only 27.2% of patients with T1D achieved an HbA1c of less than 7% (53 mmol/mol).Citation12 In South Africa, a study of 198 patients with T1D managed in private healthcare reported a mean HbA1c of 8.8% (73 mmol/mol).Citation13 Implementation of an education and monitoring programme for patients with T1D in Rwanda between 2009 and 2012 achieved a reduction in HbA1c from 11.2% (99 mmol/mol) to 9.8% (84 mmol/mol) over a two-year period, but this still failed to meet international HbA1c recommendations.Citation14
Available reports on trends in glycaemic control and diabetes complications in patients with T1D are variable. A Japanese study showed a moderate decrease in HbA1c from 7.91% (63 mmol/mol) to 7.68% (61 mmol/mol), and a lower prevalence of nephropathy and retinopathy in two cohorts recruited 10 years apart. A Swedish study found that the 25-year incidence of nephropathy and retinopathy was lower in patients who were diagnosed with T1D 10 years later.Citation15,Citation16 By contrast, a similar study in the USA failed to show this trend.Citation17
There are no studies showing trends in glycaemic control and patterns of diabetes complications in patients with T1D treated in public health facilities in South Africa. The current study was undertaken to re-evaluate the management of T1D; specifically, to assess trends in the control of glycaemic and non-glycaemic parameters over time, and to determine rates of vascular complications.
Subjects, materials and methods
Variables
This study was a retrospective chart review of all patients with T1D who attended the adult diabetes clinic at Inkosi Albert Luthuli Central Hospital (IALCH) in Durban, KwaZulu-Natal, at three time-points over a 10-year period (January 2006 to December 2015). IALCH is a tertiary referral hospital for the province of KwaZulu-Natal in South Africa and offers a diabetes management service at specialist and sub-specialist levels. The study was approved by the University of KwaZulu-Natal Biomedical Research Ethics Committee (reference number BE 417/17).
The study comprised two arms: the first arm included patients with T1D who had attended the clinic in all 3 years of review (2006, 2012 and 2015) to assess trends at an individual patient level—the individual patient-level follow-up study (IPLF). The second arm included all patients with T1D who attended the clinic in the years 2006 and 2015—clinic-level (CL) arm. Since some patients had left the clinic, while new patients had joined during this period, the determination of trends in this study was at the clinic level. The electronic health record (EHR) system at IALCH was used to identify patients and data were also extracted from individual computer files for the first visit in each study year.
Demographic data collected included age, duration of diabetes, ethnic group and gender; anthropometric measures included weight, height and body mass index. The mode of presentation of diabetes was recorded as asymptomatic detection, symptomatic hyperglycaemia or diabetic ketoacidosis (DKA). Presence or absence of anti-glutamic acid decarboxylase (GAD) and anti-islet antigen 2 (IA2) antibodies, as well as fasting and post-glucagon stimulation c-peptide values, were recorded. Parameters of glycaemic control included random plasma glucose, HbA1c and serum fructosamine; non-glycaemic parameters included blood pressure, serum creatinine, serum lipids, urine dipstick, spot random urine albumin creatinine ratio (ACR) for microalbuminuria, estimated glomerular filtration rate (eGFR) and isotope glomerular filtration rate (iGFR). Complications of diabetes were recorded, including nephropathy, retinopathy, and major adverse cardiovascular events (MACE).
Laboratory methods
Laboratory tests were undertaken by the National Health Laboratory Services (NHLS) at IALCH. HbA1c was measured by high performance liquid chromatography (HPLC) (Tosoh®) and fructosamine by calorimetric assay (Roche Modular). Anti-GAD and anti-IA2 were analysed by ELISA (Euroimmune) and c-peptide by chemiluminescent assay (Roche Elecsys). Serum lipids were measured by enzymatic reaction (Siemens Advia). Isotope glomerular filtration rate (iGFR) was measured with a multi-channel well counter and blood analysis at 2 and 3 hours post-injection of 500 μCi 99mTc-DTPA (diethylenetriamine pentaacetate).Citation18 Estimated glomerular filtration rate (eGFR) was calculated using the Chronic Kidney Disease Epidemiology Collaboration Equation.Citation19
Definitions
T1D was diagnosed if, at the time of diagnosis, patients had two or more of the following: presentation with diabetic ketoacidosis (DKA), positive anti-GAD or anti-IA2 antibodies, fasting c-peptide < 0.75 ng/ml, glucagon-stimulated c-peptide < 1.8 ng/ml, or absolute insulin dependence.Citation20,Citation21 Anti-GAD and anti-IA2 antibodies were deemed positive if the titre was ≥ 10 IU/ml. Nephropathy was diagnosed if the spot urine ACR ≥ 3.0 mg/mmol: microalbuminuria if ACR was 3–30 mg/mmol and proteinuria if ACR ≥ 30 mg/mmol or a urine dipstick was positive for protein. Abnormal GFR was defined if < 60 ml/min/m2 (normal reference range 95–123 ml/min/m2 for females and 98–150 ml/min/m2 for males). Abnormal serum creatinine was defined if > 104 µmol/l for males and > 84 µmol/l for females.Citation22 Hypertension was diagnosed if systolic blood pressure was ≥ 140mmHg or diastolic blood pressure was ≥ 90 mmHg.Citation23 Retinopathy was assessed by fundal photography and defined by the presence of microaneurysms, exudates, bleeds, retinal ischemia or macular oedema (non-proliferative); or retinal neovascularisation (proliferative).Citation24 A major adverse cardiovascular event (MACE) included a fatal or nonfatal myocardial infarction, coronary re-vascularisation or cerebrovascular accident.Citation25
Data analysis
Data were analysed using Stata (version 13; StataCorp, College Station, TX, USA). Descriptive statistics were used to summarise the data. Frequencies and percentages were used for categorical data. Numeric data were checked for normality and parametric (means [SD]) or non-parametric (medians [IQR]) method used. Comparisons between the three years in the IPLF study were undertaken using ANOVA, paired t-test or Wilcoxon signed-rank test for continuous variables and McNemar’s chi-square test for categorical variables. To assess risk factors for development of retinopathy, in bivariate analysis, the baseline characteristics (2006) of the group that developed retinopathy by 2015 were compared with the group that did not. Logistic regression analysis was undertaken to determine the significant risk factors (predictors) for future retinopathy. The magnitude of risk ratio is presented as the odds ratio (OR) with 95% confidence interval (CI) and p-value.
Comparison between the two years in the clinic-level (CL) study was done using Dunn’s pairwise comparison with Sidak adjustment for continuous variables, and Pearson’s chi-square test or Fisher’s exact test for categorical variables. A p-value of < 0.05 was considered statistically significant.
Results
The IPLF arm followed the same 58 patients in 2006, 2012 and 2015, while the CL arm included 132 patients in 2006 and 231 patients in 2015.
Individual patient level follow-up (IPLF) study
This arm included 58 patients (60.1% female) who attended the clinic in all three years of analysis (2006, 2012 and 2015).
Baseline demographic characteristics are given in . The majority (93%) of patients were Asian Indian (n = 28, 48.3%) and African (Black) (n = 26;44.8%); the remainder included 3 (5.2%) White and 1 (1.7%) mixed-race (Coloured) patients. In 2006 the median age was 30 (21–36) years, age at diagnosis was 18 (13–22) years and the duration of diabetes was 12 (6–19) years. Most patients (44.8%) presented with symptomatic hyperglycaemia, and 17 (29.3%) presented with DKA. Median BMI (kg/m2) increased significantly from 24.6 (22–28) in 2006 to 27.5 (24–31) in 2012 (p = 0.001). Anti-GAD was positive in 64.9% (n = 37). In 26 patients with available c-peptide results, cut-off points for T1D definition were met in 88.5% for fasting value, and 92.3% for glucagon-stimulated level.
Table 1: Clinical and laboratory characteristics of the individual-patient-level follow-up (IPLF) study group (n = 58) evaluated at three time points (2006, 2012, 2015)
Glycaemic and non-glycaemic parameters
, and and show clinical and laboratory variables for the IPLF group. Mean HbA1c (SD) decreased significantly from 9.9 (2.6)% (85 (28) mmol/mol) in 2006 to 8.7 (1.5)% (72 (16) mmol/mol) in 2012 (p < 0.001); by 2015, HbA1c had increased to 9.1 (1.7)% (76 (19) mmol/mol) but remained significantly lower than at baseline (2006) (p = 0.03). The proportion of patients who achieved a target HbA1c < 7.0% (< 53 mmol/mol) was low and showed no significant difference at the three time points (7.1% vs. 5.3% vs. 8.8%, p = 0.36). Median serum fructosamine was not measured in 2006 and showed no significant change from 2012 to 2015 (356 [IQR 315–389] vs. 361 [322–414] µmol/l).
Figure 1: Glycaemic and non-glycaemic parameters in the individual-patient-level follow-up (IPLF) study group (n = 58) according to study year. P-values are for comparisons between the three groups by McNemar’s chi-square test for pairs of categorical variables. ap < 0.01, bp < 0.001 vs. 2006.
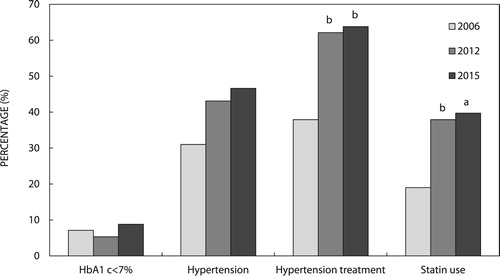
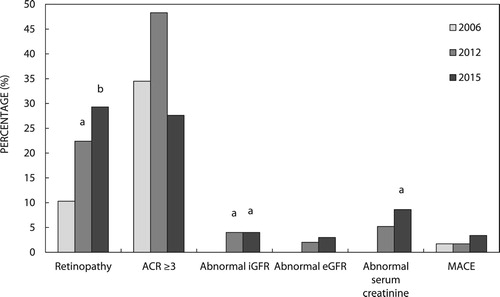
Figure 2: Chronic complications in the individual-patient-level follow-up (IPLF) study (n = 58) according to study year. ACR: albumin creatinine ratio; iGFR: isotope glomerular filtration rate; eGFR: estimated glomerular filtration rate; MACE: major adverse cardiovascular event; p-values are for comparisons between the three groups by McNemar’s chi-square test for pairs of categorical variables. ap < 0.05, bp < 0.01 vs. 2006.
Median total cholesterol (TC) and LDL cholesterol (LDL-C) followed a similar pattern to HbA1c, with a significant decrease from 2006 to 2012, and a non-significant increase from 2012 to 2015. When compared with 2006, median HDL was significantly lower in 2012 and 2015 (p = <0.01 for both). The proportion of patients on statin therapy increased from 19% in 2006 to 39.7% in 2015 (p = 0.001).
Median systolic blood pressure increased from 2006 to 2015 (p = 0.002) and median diastolic blood pressure decreased from 2006 to 2012 (p = 0.004), then increased in 2015 (p = 0.002 vs. 2012). Although the prevalence of diagnosed hypertension increased from 2006 to 2015 (31% vs. 46.6%), there was no significant difference. Both median iGFR (113 [98–128] vs. 97 [82–124] ml/min/m2, p = 0.009) and median eGFR (124 [105–136] vs. 117 [93–131] ml/min/m2, p = 0.009) decreased from 2006 to 2015.
Microvascular and macrovascular complications
and show the prevalence of chronic complications for the study years. In 2006 the prevalence of retinopathy was 10.3% and by 2015 this had increased to 29.3%. The proportion of patients with microalbuminuria or proteinuria did not change significantly. While the prevalence of abnormal iGFR increased from no patients in 2006 to four patients (6.9%) in 2015 (p = 0.04), abnormal eGFR did not increase significantly (0% vs 5.2%). Abnormal serum creatinine which was not observed in any patient in 2006 was found in five patients (8.6%) by 2015 (p = 0.02). MACE was infrequent and documented in only one patient in 2006 and one additional patient in 2015.
Risk factors for retinopathy
Of 52 patients who did not have retinopathy in 2006, 11 patients (21.2%) developed new retinopathy by 2015. indicates the baseline (2006) characteristics and analysis of risk factors for new retinopathy development by 2015, in the 52 patients who were retinopathy free in 2006. In bivariate analysis, when compared with patients who did not develop retinopathy (n = 41), patients who developed retinopathy had significantly longer duration of diabetes, higher diastolic blood pressure and lower prevalence of positive anti-GAD. In regression analysis, significant predictive risk factors included diabetes duration (OR 1.4; 95% CI 1.0–1.3; p = 0.03) and diastolic blood pressure (OR 1.15; 95% CI 1.0–1.3; p = 0.04), while a positive anti-GAD was protective (OR 0.05; 95% CI 0.01–0.4; p = 0.01). An increase of 10 years in duration of T1D increased the risk of retinopathy by 3.8, and a rise of 10 mmHg in diastolic blood pressure increased the risk by 4.1.
Table 2: Baseline (2006) characteristics and analysis of risk factors for retinopathy development in the individual-patient-level follow-up (IPLF) study group (n = 52)
Clinic Level (CL) Study
The CL study arm included 132 patients who attended the clinic in 2006 and 231 patients who attended in 2015.
shows the clinical characteristics at 2006 and 2015. At both time points, African (Black) subjects predominated (50% in 2006 and 57.6% in 2015), followed by Asian Indians (43.2% in 2006 and 29.9% in 2015) and small numbers of White and mixed-race (Coloured) patients. Although the median age at diabetes diagnosis was significantly lower in 2015 (16 [12–22] years) than in 2006 (13 [10–20] years) (p = 0.001), the duration of diabetes was equal (9 [5–15] vs. 9 [4–16] years, p = 0.79). In 2006, the presentation was predominantly with symptomatic hyperglycaemia (50%), whereas in 2015, the most common presentation was DKA (43.3%).
Table 3: Clinical and laboratory characteristics in the clinic-level (CL) study in 2006 (n = 131) and 2015 (n = 231)
Glycaemic and non-glycaemic parameters
displays the clinical and laboratory variables for the CL group. There was no significant change in mean HbA1c (SD) from 2006 to 2015 (10.8 [2.9] vs. 10.2 [2.5]%; 95 [32] vs. 88 [28] mmol/mol; p = 0.22). The proportion who achieved an HbA1c of < 7.0% (< 53 mmol/mol) was low and did not change significantly from 2006 (5.4%) to 2015 (5.2%). Median systolic blood pressure was higher in 2015 compared with 2006 (126 [117–137] vs. 120 [107–131] mmHg, p < 0.001). Serum total cholesterol and HDL cholesterol were significantly lower in 2015 than in 2006 (p = 0.001). The proportion of patients treated with statins and anti-hypertensive agents was similar in both years.
Microvascular and macrovascular complications
The prevalence of retinopathy did not change from 2006 (15.2%) to 2015 (15.6%). When compared with 2006, the proportion of patients with microalbuminuria was significantly higher in 2015 (18.9% vs. 22.5%, p < 0.001), while that of proteinuria was lower (20.5% vs 8.2%, p = 0.001). The median iGFR, prevalence of abnormal iGFR and creatinine was similar in 2006 and 2015, as was the prevalence of MACE ().
Discussion
This retrospective study on diabetes control and complications over a 10-year period has shown that at the individual patient level glycaemic control improved, but at an overall clinic level there was no significant change. In both arms of the study, the proportion of patients achieving a target HbA1c < 7.0% (< 53 mmol/mol) did not improve significantly. Significant risk factors for development of new retinopathy included diabetes duration and diastolic blood pressure.
The improvement in glycaemic control shown in the IPLF study arm is probably accounted for by a number of interventions that were introduced to the clinic after 2006. These included the services of a diabetes nurse educator, development and dissemination of a written manual on self-management, and improvement in assessment of home glucose monitoring profiles, with the use of computer downloads of patient meters. The lack of a significant change in HbA1c in the clinic-level study between 2006 and 2015 is probably explained by the mixed group, with overall improvements being diluted by new patients (with poorer glycaemic control) entering the clinic. This suggests that a number of years of attendance at a specialist clinic is required to improve glycaemic control in this environment.
Despite the improvement in glycaemic control in the IPLF group, the mean values still exceeded the ISPAD and ADA recommendations of 7.5% (58 mmol/mol) and 7.0% (53 mmol/mol), respectively,Citation8,Citation10 with only 8.8% achieving an HbA1c < 7.0% (< 53 mmol/mol) by 2015. This finding is not unique to the present study. A study on a real-world experience of glycaemic control in T1D showed that attainment of optimal HbA1c occurred in less than a third of patients.Citation12 Using data from national or regional registries on 324,501 patients with T1D from 19 countries in Europe and Oceania, McKnight et al. reported wide variation in glycaemic control between centres, with median HbA1c in the group aged > 25 years ranging from 7.4 (6.7–8.3)% (57 [50–67] mmol/mol) to 8.5 (7.7–9.5)% (69 [61–80] mmol/mol). The proportions with HbA1c < 7.5% (58 mmol/mol) varied from 15.7% to 46.4% in patients aged < 15 years, from 8.9% to 49.5% in patients aged 15–24 years, and from 20.5% to 53.6% in people aged ≥ 25 years.Citation26 A more recent report, using general-practice-level data from the United Kingdom National Diabetes Audit for the years 2013–2016, found that 54.9% of subjects with T1D had an HbA1c between 7.5 and 10% (58–86 mmol/mol) and 15.9% had an HbA1c > 10% (86 mmol/mol); there was also a wide variation in patients achieving target glycaemic control (HbA1c < 7.5%; <58 mmol/mol), ranging from 15.6% to 44.8%.Citation27
There are limited data on glycaemic control in diabetes in developing countries in Africa. A study on 198 patients with T1D conducted in the private healthcare system in South Africa reported a median HbA1c of 8.8% (73 mmol/mol)Citation13 and a study in Rwanda showed a reduction in HbA1c from 11.2% (99 mmol/mol) to 9.8% (84 mmol/mol) between 2009 and 2012.Citation14 However, neither of these studies documented the proportion of patients who achieved a target HbA1c for good glycaemic control. These limited data reflect overall poor glycaemic control in patients with T1D in developing countries and indicate the need for substantial investment in strategies to improve the situation.
The IPLF arm showed that the trends in medium serum TC and LDL-C mirrored that for HbA1c, falling from 2006 to 2012, followed by an increase in 2015. In addition, the proportion of patients on statin therapy more than doubled from 2006 (19%) to 2015 (39.7%). This underscores the relationship between glycaemic control and serum lipids.Citation28 Such findings may indicate that the duration of diabetes and age are risk factors for dyslipidaemia or may reflect better implementation of international guidelines for lipid management in diabetes. The proportion on statin therapy in the CL arm in 2015 (15.6%) was higher than patients with T1D in the Swedish national registry (10.7%),Citation29 but much lower than that reported in a Danish study (43.5%);Citation30 in the latter study, statin users were older, with longer diabetes duration and more severe kidney disease.
Systolic and diastolic blood pressure, and the proportion of patients on antihypertensive medication increased significantly from 2006 to 2015 in the IPLF study; by 2015, the prevalence of hypertension (46.6%) was higher (46.6% vs. 31%) but had not increased significantly. The higher prevalence may be due to increased age. The prevalence in 2015 is higher than that reported in other larger studies on adults with T1D (19.2–43%).Citation31–33 This may be due to the high proportion of African patients, who have an increased risk of hypertension compared with Caucasians and Asians.Citation34 The increase in antihypertensive medication use (37.9% to 63.8%) from 2006 to 2015 included 27% of the cohort who received ACE inhibitors to lower urine protein excretion.
The 10-year incidence of retinopathy in the IPLF group was 21.2%. This was lower than the nine-year incidence in a Spanish study (47.3%),Citation35 but similar to a large study in the USA with a median follow-up period of 3.2 years, which showed an incidence of 20.1% amongst patients diagnosed with diabetes aged under 21 years.Citation36 Significant risk factors identified for the development of new diabetic retinopathy in the current study included duration of T1D and diastolic blood pressure, while a positive anti-GAD was protective. This confirms reports from other studies, which also found that increased diastolic blood pressure and diabetes duration were predictors of diabetic retinopathy.Citation35–38 In the DCCT/EDIC trial, which identified diastolic BP as a risk factor, only 3% had hypertension at baseline.Citation37 The other studies do not mention the baseline blood pressure, or the proportion diagnosed with hypertension. To our knowledge there are no studies that reported anti-GAD positivity being protective and the relevance of this finding is unclear and requires further investigation.
The higher iGFR seen in 2006 in the IPLF arm may be explained by hyperfiltration seen in stage 1 diabetic nephropathy. The 10-year incidence of abnormal iGFR (6.9%) is comparable to an Italian study,Citation39 but was significantly higher than both the intensive and conventional therapy arms of the DCCT/EDIC trial (20-year incidence of 2% and 5.5%, respectively).Citation40 By 2015 there was a wide discrepancy between median iGFR and eGFR (97 [82–124] vs. 117 [93–131]). This may indicate that the eGFR is an overestimate.
The prevalence of macrovascular disease was lower than studies conducted in Japan (5.7%) and the United Kingdom (6%).Citation16,Citation41 This may be explained by the higher median age in these studies and the lower risk of macrovascular disease in the Black African population in South Africa.Citation42
Strengths of the study include access to complete clinical and laboratory data on all patients due to the electronic health record system as well the fact that all patients had laboratory investigations at each clinic visit using a set clinic protocol. In addition, the clinic population is broadly representative of the population from the entire province of KwaZulu-Natal.
The study had several limitations, including the relatively small number of patients in the individual follow-up group as well as the fact that mortality was not evaluated, and patients who died during the study period were not included in the patient-based analysis; this may have impacted on the findings on glycaemic parameters and complication rates.
Conclusion
Patients with T1D attending a tertiary diabetes clinic in South Africa showed a significant improvement in glycaemic control over a 10-year period on an individual basis, but not on a whole-clinic basis. Overall glycaemic control fell short of recommended targets. Significant predictive risk factors for new retinopathy development included diabetes duration and diastolic blood pressure, while a positive anti-GAD was protective. Our results indicate a need for intensified efforts to achieve and maintain targets for both glycaemic and non-glycaemic parameters in patients with T1D.
Disclosure statement
No potential conflict of interest was reported by the author(s).
References
- The Diabetes Control and Complications Trial Research Group. The effect of intensive treatment of diabetes on the development and progression of long-term complications in insulin-dependent diabetes mellitus. N Engl J Med. 1993;329(14):977–986.
- Brinchmann-Hansen O, Dahl-Jorgensen K, Sandvik L, et al. Blood glucose concentrations and progression of diabetic retinopathy: the seven year results of the Oslo study. BMJ (Clin Res Ed). 1992;304(6818):19–22.
- Feldt-Rasmussen B, Mathiesen ER, Deckert T. Effect of two years of strict metabolic control on progression of incipient nephropathy in insulin-dependent diabetes. Lancet. 1986;328(8519):1300–1304.
- Holman RR, Dornan TL, Mayon-White V, et al. Prevention of deterioration of renal and sensory-nerve function by more intensive management of insulin-dependent diabetic patients. A two-year randomised prospective study. Lancet. 1983;321(8318):204–208.
- Nathan DM, Bayless M, Cleary P, et al. Diabetes control and complications trial/epidemiology of diabetes interventions and complications study at 30 years: advances and contributions. Diabetes. 2013;62(12):3976–3986.
- The Diabetes Control and Complications Trial/Epidemiology of Diabetes Interventions and Complications (DCCT/EDIC) Study Research Group. Intensive diabetes treatment and cardiovascular disease in patients with type 1 diabetes. N Engl J Med. 2005;353(25):2643–2653.
- Fullerton B, Jeitler K, Seitz M, et al. Intensive glucose control versus conventional glucose control for type 1 diabetes mellitus. Cochrane Database Syst Rev. 2014;2014(2):Cd009122.
- Sperling M. ISPAD clinical practice Consensus guidelines 2014. Pediatr Diabetes. 2014;15(Suppl 20):1–290.
- Amod A, Dave J, Mohammed N, et al. Guidelines for the management of type 2 diabetes mellitus SEMDSA type 2 diabetes guidelines expert committee. JEMDSA. 2017;22(Supplement 1):S1–S1962019.
- Chamberlain JJ, Rhinehart AS, Shaefer CF Jr, et al. Diagnosis and management of diabetes: synopsis of the 2016 American diabetes association standards of medical care in diabetes. Ann Intern Med. 2016;164(8):542–552.
- Wood JR, Miller KM, Maahs DM, et al. Most youth with type 1 diabetes in the T1D exchange clinic registry do not meet American diabetes Association or international society for Pediatric and Adolescent diabetes clinical guidelines. Diabetes Care. 2013;36(7):2035–2037.
- Mannucci E, Monami M, Dicembrini I, et al. Achieving HbA1c targets in clinical trials and in the real world: a systematic review and meta-analysis. J Endocrinol Invest. 2014;37(5):477–495.
- Amod A, Riback W, Schoeman H. Diabetes guidelines and clinical practice: is there a gap? The South African cohort of the international diabetes management practices study: original research. J Endocrinol, Metab Diabetes S Afr. 2012;17(2):85–90.
- Marshall SL, Edidin DV, Arena VC, et al. Glucose control in Rwandan youth with type 1 diabetes following establishment of systematic, HbA1c based, care and education. Diabetes Res Clin Pract. 2015;107(1):113–122.
- Nordwall M, Bojestig M, Arnqvist HJ, et al. Declining incidence of severe retinopathy and persisting decrease of nephropathy in an unselected population of type 1 diabetes-the linkoping diabetes complications study. Diabetologia. 2004;47(7):1266–1272.
- Yokoyama H, Araki S-i, Kawai K, et al. Declining trends of diabetic nephropathy, retinopathy and neuropathy with improving diabetes care indicators in Japanese patients with type 2 and type 1 diabetes (JDDM 46). BMJ Open Diabetes Research and Care. 2018;6(1):e000521.
- Pambianco G, Costacou T, Ellis D, et al. The 30-year natural history of type 1 diabetes complications. Diabetes. 2006;55(5):1463–1469.
- Fleming JS, Zivanovic MA, Blake GM, et al. Guidelines for the measurement of glomerular filtration rate using plasma sampling. Nucl Med Commun. 2004;25(8):759–769.
- Levey AS, Stevens LA, Schmid CH, et al. A new equation to estimate glomerular filtration rate. Ann Intern Med. 2009;150(9):604–612.
- Jones AG, Hattersley AT. The clinical utility of C-peptide measurement in the care of patients with diabetes. Diabetic Med. 2013;30(7):803–817.
- American Diabetes Association. Diagnosis and classification of diabetes mellitus. Diabetes Care. 2014;37(Supplement 1):S81–S90.
- Kidney Disease: Improving Global Outcomes (KDIGO). KDIGO 2012 clinical practice guideline for the evaluation and management of chronic kidney disease. Kidney Int Suppl;2013;3(1):1–150.
- James PA, Oparil S, Carter BL, et al. Evidence-based guideline for the management of high blood pressure in adults: report from the panel members appointed to the eighth joint national committee (JNC 8)2014 guideline for management of high blood pressure2014 guideline for management of high blood pressure. JAMA. 2014;311(5):507–520.
- Solomon SD, Chew E, Duh EJ, et al. Diabetic retinopathy: a position statement by the American diabetes Association. Diabetes Care. 2017;40(3):412–418.
- Hirshberg B, Katz A. Cardiovascular outcome studies with novel Antidiabetes agents: scientific and operational considerations. Diabetes Care. 2013;36(Supplement 2):S253–S258.
- McKnight JA, Wild SH, Lamb MJE, et al. Glycaemic control of type 1 diabetes in clinical practice early in the 21st century: an international comparison. Diabetic Med. 2015;32(8):1036–1050.
- Heald AH, Livingston M, Fryer A, et al. Route to improving type 1 diabetes mellitus glycaemic outcomes: real-world evidence taken from the National Diabetes Audit. Diabetic Med. 2018;35(1):63–71.
- Maahs DM, Dabelea D, D’Agostino RB Jr, et al. Glucose control Predicts 2-year change in lipid Profile in youth with type 1 diabetes. J Pediatr. 2013;162(1):101–107. e101.
- Rawshani A, Rawshani A, Franzén S, et al. Mortality and cardiovascular disease in type 1 and type 2 diabetes. N Engl J Med. 2017;376(15):1407–1418.
- Jensen MT, Andersen HU, Rossing P, et al. Statins are independently associated with increased HbA1c in type 1 diabetes–the thousand & 1 study. Diabetes Res Clin Pract. 2016;111:51–57.
- Collado-Mesa F, Colhoun HM, Stevens LK, et al. Prevalence and management of hypertension in type 1 diabetes mellitus in Europe: the EURODIAB IDDM complications study. Diabetic Med. 1999;16(1):41–48.
- Maahs DM, Kinney GL, Wadwa P, et al. Hypertension prevalence, Awareness, treatment, and control in an adult type 1 diabetes population and a comparable general population. Diabetes Care. 2005;28(2):301.
- Gomes MB, Tannus LRM, Matheus A, et al. Prevalence, awareness, and treatment of hypertension in patients with type 1 diabetes: a nationwide multicenter study in Brazil. Int J Hypertens. 2013;2013:1–8.
- Wandai ME, Norris SA, Aagaard-Hansen J, et al. Geographical influence on the distribution of the prevalence of hypertension in South Africa: a multilevel analysis. Cardiovasc J Afr. 2019;30:1–8.
- Romero-Aroca P, Navarro-Gil R, Valls-Mateu A, et al. Differences in incidence of diabetic retinopathy between type 1 and 2 diabetes mellitus: a nine-year follow-up study. Br J Ophthalmol. 2017;101(10):1346–1351.
- Wang SY, Andrews CA, Herman WH, et al. Incidence and risk factors for developing diabetic retinopathy among youths with type 1 or type 2 diabetes throughout the United States. Ophthalmology. 2017;124(4):424–430.
- Hainsworth DP, Bebu I, Aiello LP, et al. Risk factors for retinopathy in type 1 diabetes: The DCCT/EDIC study. Diabetes Care. 2019;42:dc182308.
- Lloyd CE, Klein R, Maser RE, et al. The progression of retinopathy over 2 years: the Pittsburgh epidemiology of diabetes complications (EDC) study. J Diabetes Complicat. 1995;9(3):140–148.
- Piscitelli P, Viazzi F, Fioretto P, et al. Predictors of chronic kidney disease in type 1 diabetes: a longitudinal study from the AMD Annals initiative. Sci Rep. 2017;7(1):3313–3313.
- Group DER, de Boer IH, Sun W, et al. Intensive diabetes therapy and glomerular filtration rate in type 1 diabetes. N Engl J Med. 2011;365(25):2366–2376.
- Soedamah-Muthu SS, Fuller JH, Mulnier HE, et al. High risk of cardiovascular disease in patients with type 1 diabetes in the U.K. Diabetes Care. 2006;29(4):798–804.
- Akinboboye O, Idris O, Akinboboye O, et al. Trends in coronary artery disease and associated risk factors in sub-Saharan Africans. J Hum Hypertens. 2003;17(6):381–387.