
 ?Mathematical formulae have been encoded as MathML and are displayed in this HTML version using MathJax in order to improve their display. Uncheck the box to turn MathJax off. This feature requires Javascript. Click on a formula to zoom.
Abstract
A successful bridge management system needs to utilise an efficient decision-making model for prioritising the bridges for repair and maintenance operations to deal with the limited allocated funds. Models based on certain mathematics and divalent logic that need accurate data are not flexible with the uncertainty space of project management procedure and lead to imprecise outputs. Unlike classical logic, fuzzy logic represents the propositions with degrees of truthfulness and falsehood. In this paper, a fuzzy decision-making model was developed to prioritise a large number of urban roadway bridges and put them on the agenda for repair and maintenance operations. The proposed model considers experts' feelings, knowledge, and judgment expressed by linguistic variables, vague data or uncertain values in the modelling. The introduced model uses a fuzzy multi-attribute decision-making matrix to evaluate a large number of bridges to a large number of effective factors in the bridge maintenance area and determines the fuzzy desirability priority of each bridge as well as the preference value of every bridge to another one. This capability makes the model adaptable for a particular region or condition and helps managers make quick and more accurate strategic decisions.
1. Introduction
The urban structures maintenance in a way which keeps them in a high level of safety and functionality is a big issue for managers at high levels of urban management. On the other hand, in urban management systems, allocating appropriate budget in an appropriate time is very important as it solves urban problems in a timely and reasonable manner.
Today, the fuzzy management knowledge by using fuzzy systems theory can be a new approach to solve the problem and an answer to questions posed in management systems. Fuzzy systems by using fuzzy logic theory and fuzzy measures can model parameters such as human knowledge, experience, and judgments. In this way, classic management techniques expand to the fuzzy environment and regards to its flexibility, it can be used for multiple management systems, including decision-making, policymaking and planning.
The ultimate aim of this study is putting bridges on the agenda to repair, maintenance or reconstruction using an efficient and effective system to prioritise them. Since the bridge prioritisation is a multiple-criteria decision-making problem, experts involved the repair and maintenance of bridges encounter with various parameters and factors for prioritising them. They can solve this problem by using an appropriate model which number and importance rate of these parameters have been set in the best way.
In coming parts of this paper after identifying the factors which can affect the bridge prioritisation for maintenance operations, through a qualitative assessment the fuzzy numbers, which indicate the importance degree of these factors, are constructed. Then, by applying a minimum fuzzy desirability limit, the most effective parameters are selected for forming the fuzzy multi-attribute decision-making matrix. Finally, by assessing the bridge conditions, according to these parameters, the fuzzy desirability of each bridge is determined in the form of triangular fuzzy numbers and by using an appropriate fuzzy ranking algorithm the bridges are prioritised for maintenance.
2. Fuzzy Logic and Bridge Management
2.1. Fuzzy Logic vs Classic Logic
In classic logic a simple proposition ‘P’ is a linguistic or declarative statement that is strictly true or strictly false [Citation1]. A binary truth value is assigned to the veracity of an element in the proposition ‘P’, which is a value of 1 (true) or 0 (false). In other words, classical set theory represents a special case of the more general fuzzy set theory. In crisp set, membership of element X, µA (X) of a set A is defined as:
(1)
(1)
Treating truth as a linguistic variable leads to fuzzy linguistic logic, or simply fuzzy logic [Citation2]. With fuzzy logic, propositions can be represented with degrees of truthfulness and falsehood. For example, the statement ‘today is sunny’ might be 100% true if there are no clouds, 80% true if there are a few clouds, 50% true if it's hazy and 0% true if it rains all day. A fuzzy set expresses the degree to which an element belongs to a set. A fuzzy set has no sharp boundary between one element belonging or not belonging. The fuzziness in a statement or estimate lies in an interval of confidence (fuzzy range) that there is not any possible estimate outside this range. If X is a collection of objects denoted generically by x, then a fuzzy set A in X is defined as a set of ordered pairs:
(2)
(2)
Fuzzy sets are often incorrectly assumed to indicate some form of probability. Even though they can take on similar values, it is important to realise that membership grades are not probabilities. The probabilities of a finite universal set must add to 1 while there is no such requirement for membership grades.
2.2. Bridge Management
Errors and mistakes during the design and construction stages of a bridge and many environmental and traffic factors during the operation stage like heavy traffic loads, accidents, soil erosion, earthquake, chemical damages, etc. cause several damages in different shapes and sizes to bridge components which can cause serious functional difficulties, life, time and cost losses.
Bridge management can help to optimise the use of resources, facilities, and funds for inspection, maintenance, repair and replacing the bridges. In other words, bridge management is a tool that takes care of the bridge since the construction planning stage to the end of its useful life through the following tasks [Citation3]:
Collecting data and certificate information of bridges (year of construction, dimensions, etc.)
Regular inspection of bridges to reflect the existing conditions and make a clear image of them.
Assessing the conditions and resistance of bridge elements with local inspections and based on the defined indexes
Providing a proposal for the maintenance, repair, strengthening or replacing the bridges
Prioritising the bridge for budget assignment
Providing safety and maintaining bridge load bearing capacity through performing and controlling the proposed maintenance methods
A system which makes the bridge management, operational is called bridge management system or BMS. Figure shows a BMS outline. The most important part of a BMS is its database. A bridge database includes information about bridge location, bridge age, bridge designer, bridge contractors, bridge dimensions, bridge structure type, bridge functionality, bridge importance degree in the transportation network, bridge condition based on performed inspections, information related to the repairs and maintenance and bridge history [Citation3]. The volume of input data is directly related to the system degree of complexity and the expected analysis results. In the data analysis section of a BMS, all the input data are analysed qualitatively and quantitatively to provide a clear image of current bridge status and helps managers in decision-making. Judgment and decision-making of management leads to the output of a bridge management system as follows [Citation3]:
Defining, planning, management and controlling the inspections and maintenance process
Allocation of appropriate budget and prioritising bridges to repair and maintenance operations
Presenting an appropriate method for repairing the destruction observed on a bridge
Saving the bridge data at all levels and related fields
Figure 1. Bridge management system outline.

2.3. Fuzzy Logic in Bridge Management
Fuzzy management science is able to create models which can process qualitative information intelligently almost like a human. General characteristics of fuzzy management can be stated as follows:
Real coefficients and conditions of shortages which are set by the planners intuitively can be easily and flexibly illustrated by membership functions and find answers to these problems in a mathematical way.
Obtaining knowledge and skills needed for management systems from experts in natural language and create models and computer programs easily by using fuzzy inference. Natural language often uses the attributes and constraints such as ‘very’, ‘little’, ‘some’ and ‘approximately’ that can be shown by membership functions and given as input to computer programs.
Providing several possible answers by obtaining the upper and lower limits of responses considering experts, managers and specialists’ opinions that lead to more practical solutions than classic management techniques that offer a limited number of answers.
Despite attempts to simulating the exterior realities with the existing bridge management systems, some elements of uncertainty and unreliability in estimation affect the prediction ability of a bridge management system. For example, bridge inspectors try to represent the true field conditions of bridge elements based on visual inspections. The visual inspections data enter into a bridge management system and analysis of input data to this system can lead to different results in bridge condition grading due to the professional judgments of several inspectors.
To reflect the uncertainties of inspectors’ assessment, fuzzy set theory gives a tool for bridge components grading modelling due to the data intellectual estimating by using a wide range of values. Fuzzy bridge management can model uncertainties of input data and parameters such as visual inspection data, cost data, destruction rate and inequality of inspectors due to human factors. It can provide a better understanding of quantifying the uncertainties for all subjective aspects of bridge management by normalising the inspectors’ data. This will help departments of transport in predicting the future conditions of bridge elements and minimising the risk of wrong decision-making in bridge maintenance strategies.
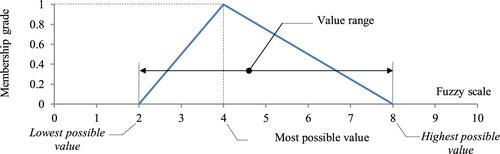
A range of values can be assigned to the uncertain quantity between the lowest possible value and the highest possible value. Beyond these limits, no values exist and a grade of membership is assigned to each value in this range. From combining the different membership grades of a condition or situation assessment, a graphical shape is formed which represents the membership function of values in the range of a fuzzy number or fuzzy scale. A set of mathematical relationships that maps the membership grades of the values define the membership function curve which might look like a triangle, trapezoid, bell shape, or any other general shape.
In [Citation4] Al. Wazeer et al. explained how fuzzy concepts can be applied to bridge inspection and management. They compared the visual inspection of bridge components with a dart board, where score 100 (centre of the dartboard) can be assigned to assessments that represent the true field conditions, score 0 to the assessments that do not represent the true field conditions (outside the area of the dartboard), and assessments that partially represent the true field conditions can be represented by a fuzzy number with a score between 0 and 100% (called a membership grade). In the United States, there are two ways for inspection of bridges resulting in different types of rating [Citation4]. The first way is NBI (National Bridge Inventory) condition rating based on the score (0) for the worst condition to (9) for the good condition of the bridge deck, superstructure, and substructures. The second method uses an element level condition assessment on a scale of 1–3, 4 or 5 regarding the type of element. Where the condition state 1 refers to the best condition and the higher number corresponds to the worst condition. Wazeer et al. showed how triangular fuzzy numbers can be used for representing the NBI condition ratings of a bridge component field condition or illustrating the quantity of a bridge element in a specific condition state. They extended the application of fuzzy concepts in field inspections by calculating the Bridge Health Index (BHI). BHI compares the current economic value of the bridge elements to the total value of elements when they are as good as new. Through dividing the bridge to different elements and introducing the weighting factors for possible conditions states of each element and multiplying it in the most possible, the least and the highest failure unit cost of elements, the triangular fuzzy number of BHI is modelled.
The bridge inspector’s training manual in the United States determines guidelines for bridge inspection by dividing the bridge into three main components: superstructure, substructure, and deck that each of them is divided into several elements. Bridge inspectors are required to evaluate each sub-component condition to reach an overall rating value for each component. Whereas different ratings of different bridge inspectors may have significant differences. Tee et al. [Citation5] used this manual to describe a fuzzy mathematical approach for enhancing bridge condition rating by finding the overall rating of a particular component through combining the rating of various subcomponents according to their importance under various conditions in the United States.
In a similar way Pushpakar [Citation6] developed a graphic user interface and integrated system for assessing the degree of global damage in bridge structures. After identifying the bridge structure’ components and sub-components, setting the membership functions of linguistic terms for bridge conditions evaluation and components importance, he used the fuzzy weighted average technique to determine the total bridge condition.
Tarighat and Miyamoto [Citation7] applied a method using the Mamdani fuzzy inference system for bridge deck condition rating based on subjective and objective inspection results. In their method the variables fuzzification is done according to five defined antecedent functions of spalling, crack width, delamination, hammer tapping, and corrosion. Then, a bridge deck fuzzy rating system, including 162 rules converts the implicated antecedent membership functions to consequent membership functions and after aggregation the output results a crisp number is obtained through defuzzification of final output fuzzy set.
Agardy [Citation8] applied a fuzzy reasoning approach for rating the bridges for service based on Mamdani method by considering three factors of load-bearing capacity, clear width and clear height. He defined three membership function describing bad, medium and good conditions for load-bearing fuzzy sets. For pavement width, three states of not enough, tolerable and enough, were defined while for the clear height, two states of short and tall were set in the form of fuzzy membership functions. Via using a set of 18 fuzzy rules the input elements were connected to output fuzzy sets of bridge sufficiency indexes described on a 100-grade scale with 10 categories.
Samsal and Ramanjaneyulu [Citation9] conducted a research using fuzzy-based Analytic Hierarchy Process (Fuzzy AHP) for evaluating and condition rating of reinforced concrete bridges. In the first step, they constructed the Analytic Hierarchy Model (AHM) in three layers of objective layer, criteria layer and the index layer from top to bottom. Condition assessment of existing bridges was defined as the uppermost level, the middle layer or criteria layer was divided into three sections: visual assessment, general assessment, and detailed assessment. Each of these sections includes items that can be evaluated by visual inspection, general inspection or detailed inspections and were grouped at the lowest level. By forming the pairwise comparison matrix for the index layer and then the criteria layer, the weight of each item in each layer is calculated. They developed an evaluation method for determining the deterioration rate of bridge elements based on four factors of degree, extent, relevance, and urgency for assessment. The condition assessment of bridge elements was carried out using provided guidelines by bridge inspector’s training manual 90 (FHWA-1991) published by the US department of transportation for bridge inspection. They fuzzified the condition ratings using the fuzzified rating value membership functions introduced by Kaufmann and Gupta [Citation10] and justified the obtained fuzzy sets to convex fuzzy numbers to form a multi-attribute decision-making matrix for final rating of the bridges. In the next step, through processing the fuzzy weights and fuzzy numbers of bridge components’ assessments using Fuzzy Weighted Average (FWA) technique, the final fuzzy number of each bridge was obtained. Finally, each fuzzy number was defuzzified to a crisp rating value and the most deserved bridge for maintenance was determined.
Some of the most important fields of using fuzzy logic theory in bridge management can be summarised as follows:
Determining the most effective parameters of bridge prioritisation for maintenance
Determining the bridge input data (field condition rating, visual inspection reports, cost data …)
Determining the bridge destruction rate and bridge health index
Evaluating the inspectors’ judgment discrepancy due to human factors
Bridge fuzzy ranking for setting fund allocation priority of maintenance operations
In this study, triangular fuzzy numbers were used to model the bridge fuzzy numbers. The triangular membership function connects the lowest possible value with a membership grade of 0 to the most possible value with membership grade of 1 and then to the membership grade of 0 for the highest possible value by straight and continues lines. Linear interpolation is used to evaluate the membership grade of a given value in this range. For example, the triangular fuzzy number R (2, 4, 8) that can be the assessment of a bridge to a specific parameter like the estimation of ‘bridge repair cost’ has been illustrated in Figure on a 10 interval fuzzy scale. This scale can be 10 fuzzy linguistic values, 10 pre-defined conditions or scaled certain information.
Figure 2. A bridge fuzzy number.
3. The Effective Factors for Bridges Prioritisation
As previously mentioned, one of the bridge management system outcomes is prioritising bridges for maintenance operations. Deciding about allocating maintenance funds to bridge needs prioritisation of existing bridges in a BMS database. In accordance with the limitation of resources and decision-making complexity in the emergencies, this issue needs an accurate and efficient prioritising system.
For bridges prioritising, optimal and proper models rate the status of each bridge according to some effective parameters and then, according to several ratings, bridges are compared to each other and prioritised for maintenance operations [Citation3].
In most countries, the bridge prioritising for maintenance operation is based on the highest simple additive weighting method of some specific parameters. In Australia, Rashidi et al. [Citation11] proposed a model which calculates an integrated Priority Index (PI) using a simple additive weighting for three main factors of structural sufficiency, functional efficiency, and client impact factor. In Chile Valenzuela et al. [Citation12] proposed an index called the Integrated Bridge Index (IBI). This index consists of the main variables of strategic importance, hydraulic vulnerability, seismic risk and bridge condition index. In the UK [Citation3], another index called Maintenance Priority Number (MPN) is proposed. The index is used to determine the maintenance priority number of each bridge in which the structure is divided into its constituent members and by using three main indexes of condition factor, location factor and route factor, maintenance priority number of each bridge, is calculated. Each of these main factors addresses a variety of sub factors. Through using different numeral, statistical, probabilistic and comparative methods the weights of these parameters are determined. The highest value of these indexes determines the first priority of bridges for maintenance.
In different countries depends on the specific weather and environmental conditions, geographical situation, the design codes and other factors, experts and specialists considered some parameters as the most effective parameters in prioritising the bridges. To choose a bridge among several bridges for executing the maintenance procedure, we need to assess and prioritise bridges in a (BMS) database according to the identified effective factors. Table shows 45 identified factors which were used in this study for prioritising forty (40) bridges of Tehran city [Citation13]. These factors are not limited to the destruction rate of the bridge, but by considering the bridge as a part of the highway network, a variety of factors, including environmental factors, loss factors due to bridge destruction, logistic and strategic factors are incorporated.
Table 1. The effective factors of bridge maintenance prioritisation.
4. Research Methodology
The fuzzy approach of this research simply can be shown in three phases in Figure .
Figure 3. Research methodology framework.
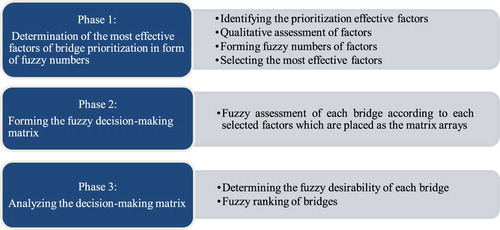
4.1. Determination of the Most Effective Factors of Bridge Prioritisation in the Form of Fuzzy Numbers
An appropriate model for bridge prioritising for maintenance uses a database and a supportive decision-making system to process the data. This database contains bridge general information and inspection data that is based on several factors and parameters. As we are using a fuzzy approach for solving the bridge prioritisation problem, we need to determine the fuzzy form of the most effective factors. We achieved this through the following steps.
4.1.1. Step 1: Identifying the Prioritisation Effective Factor
Table shows 45 identified parameters. These factors obtained through the study of bridge management standards, codes, regulations, and research studies carried out in several countries and then removing duplicates and merging the same parameters.
4.1.2. Step 2: Qualitative Assessment of Effective Factor
The qualitative assessment of this study was conducted in a way that provides the maximum simplicity and also makes further validation of results with the classic statistical method possible. This assessment was carried out using a questionnaire to determine the importance degree of each factor. Because of the verity of factors, the respondent experts were selected among four different groups in bridge engineering, construction, and management field (contractor, consultant, client and researcher), who were involved in urban roadway bridges maintenance of Tehran, the capital city of Iran.
Upon the last statistics of the year 2008, there are 275 bridges in this metropolis that most of them are roadway bridges with almost 4 million users a day [Citation13]. About 22 companies and organisations which had experience in urban roadway bridge maintenance were identified and finally, 100 experts in this area were identified as the statistical population.
For setting the sample size that indicates the number of required sample people or collected inquiries to generalise the results Cochrane sampling equation presented by equation (3) is used in this study [Citation14].
(3)
(3)
where n: sample size, N: statistical population, t2: the normal distribution, q: the absence of attribute in the population, p: the existence of attribute in the population, and d2: the error level.
To generalise the result of this research in a statistical population, we use probabilistic sampling, where the statistical population is 100 and an error level is equal to 5% (95% confidence level). The normal distribution value with 95% confidence level upon the table of the area under the normal curve is (96.1). Values of (p) and (q) are replaced with 0.5 from previous data and statistic and the sample size is calculated: n∼80 (Equation 4).
(4)
(4)
So eighty (80) questionnaires distributed among the experts and then collected. They scored each factor a number from 0 to 10 where the score (0) to a parameter indicates the unimportance of being, (1) too little importance, (2) the relatively low importance, (3) low importance, (4) the low average, (5) the average, (6) the upper average, (7) the relatively high, (8) high importance, (9) very high importance and (10) is special importance. In the conversion of statistical data into fuzzy numbers, Continuous fuzzy numbers are used. Thus, the distances between these 10 points become meaningful.
4.1.3. Step 3: Forming Fuzzy Numbers of Factors
A fuzzy number is a fuzzy set on the real numbers. It represents information such as ‘about m’. A fuzzy number must have a unique modal value ‘m’, be convex, normal and piecewise continuous [Citation15]. The Continuous fuzzy numbers used in this study are triangular fuzzy numbers (TFN). Through a numerical example, we show how the importance degree of each effective factor for prioritisation in the form of a TFN was constructed. Table shows the frequency chart of a rated parameter evaluated by 80 experts in a 10 grade scale that are the importance degree or weight of a parameter so the question is: ‘How important is parameter i (Pi)?’ Values from 0 to 10 can define 10 different fuzzy states or linguistic expressions.
Table 2. Frequency chart for the importance degree of a surveyed parameter.
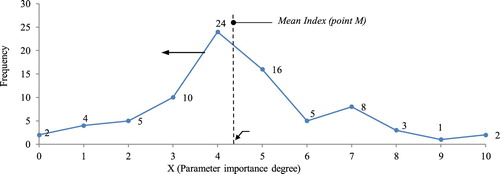
If the rating scale represents the importance degree of the parameter, data of Table shows that 5 experts realised that this parameter has the importance degree 2 (the relatively low importance) whereas 2 out of 80 inquired experts considered a 10 importance degree (special importance) for this parameter. The corresponding diagram for the parameter is obtained from the frequency chart. The graph represents the frequency of values for the sample parameter has been illustrated in Figure . The sum of total frequencies is equal to the number of inquired experts, which are 80 people.
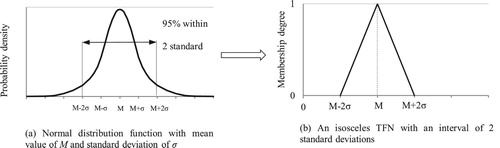
Ordinary methods which use statistical data to generate triangular fuzzy numbers usually use the normal distribution of data for this purpose. The normal distribution is a continuous probability distribution that shows the probability that any real observation will fall between any two real limits or real numbers (Figure (a)). The ordinary method of converting a normal distribution function to a TFN, results in an isosceles triangular fuzzy number (Figure (b)).
Figure 4. Converting a normal distribution function to isosceles TFN.
In reality, when the statistical distribution of data around the mean point is not homogeneous, the triangular fuzzy number can’t be in the form of a simple isosceles triangle with two equal sides. This paper suggests a method for constructing a non-isosceles triangular fuzzy number (TFN) of a parameter or value, which is being surveyed statistically using a pre-defined scale. The origin or main idea for generating a fuzzy membership function by this method is the deviation of the responses from the average value when a fuzzy concept is judged or rated. Thus, for constructing the TFN that can represent the judgment deviations, we try to determine the left and right boundaries about the average value of data by proposing the following steps:
Step 1: Computing the average or mean value of frequency chart data using Equation (5) that is presented by point ‘M’ and the standard deviation of data ‘σ’ using Equation (6).
(5)
(5)
(6)
(6)
Step 2: Forming the histogram of the frequency chart in the form of a continuous graph which introduced by f(x), where the X-axis indicates the scale degrees and Y-axis indicates the frequency data (Figure ).
Figure 5. Continuous diagram of frequency for parameter importance degree based on a ten grade scale.
Step3: Introducing and computing the following parameters with regard to f(x) for a ‘0 to k’ graded X-axis:
(7)
(7)
(8)
(8)
(9)
(9)
(10)
(10)
(11)
(11)
Step 4: Finding the lower limit (LL) and the upper limit (UL): So that the lower limit is obtained by subtracting the σL(M) from the mean value and the upper limit is obtained by adding the σR(M) to the mean value.
(12)
(12)
(13)
(13)
(14)
(14)
Step 5: Scaling the data in the form of fuzzy number membership function with a membership degree of 1 for the mean point and the membership degree of zero for the lower limit (LL) and upper limit (UL).
Referred to the Equations (7) and (8), ‘LM’ is the area under the frequency graph for the left side of the mean point and ‘RM’ is the area under this diagram on the right side of the mean point. σL(M) and σR(M) are left and right boundaries of the fuzzy number. These values are obtained by distributing the standard deviation value (σ) of data regarding the ratio ‘S’ using the direct proportion. In this way, the side with the bigger area due to more scattered responses leads to a bigger boundary around the average value, which represents less certainty and more vagueness. The result of the proposed algorithm for obtaining the membership function for the sample parameter has been shown in Table . The related membership function has been illustrated in Figure .
Figure 6. Corresponding TFN of parameter importance grade based on a ten grade evaluating scale.
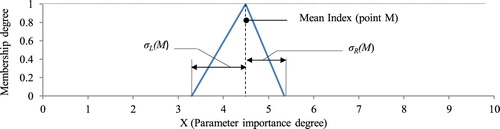
Table 3. The results of the proposed algorithm for calculating the lower and upper limits of the sample parameter.
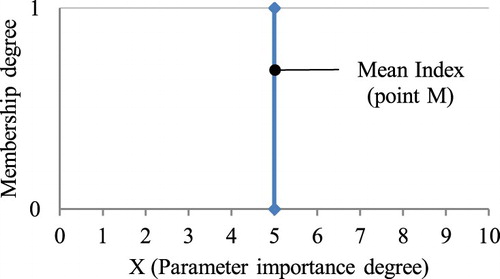
This method reflects the uncertainty of qualitative judgments because it is exclusive for each set of evaluation. For example, two sets of data with the same average value won’t have the same TFN because of different standard deviations as well as a different distribution of the frequency histograms around the mean point. In this method, a smaller standard deviation indicated a more certain set of assessment or judgment that results in narrower boundaries of the fuzzy number about the average point. For example, in a case that all the experts consider a parameter with an average degree of importance equals to (5), the standard deviation would be zero (0), so there isn’t any boundary around the single point core and the fuzzy triangle turn into a singleton fuzzy number. A singleton fuzzy number shows that there isn’t any doubt or uncertainty about the importance degree of the parameter (Figure ).
Figure 7. Fuzzy singleton in 100% certainty state.
4.1.4. Step 4: Selecting the Most Effective Factors
After generating all fuzzy numbers of identified factors, a fuzzy approach is taken for selecting the most effective factors and elimination of the dispensable ones for further process. This will lead to a more concise decision-making matrix. Each mapping of α on the triangular fuzzy numbers specifies two limits on the variable X-axis. The lower limit shows the minimum value for the fuzzy desirability of α and the upper value indicates the maximum value for specific desirability of α.
For selecting the most effective prioritisation factors those that their minimum value of fuzzy desirability of 50% (α = 0.5) or in other words, their minimum value of a membership degree of (0.5) is less than the average index of the importance degree are excluded [Citation16]. In this way, thirteen (13) factors out of initial forty five (45) identified factors are ruled out and 32 remain. In coming parts, we will see that these factors are those that take place at the lowest levels of the fuzzy ranking table.
To avoid the complexity of the drawing, a schematic diagram of determining the fuzzy desirability of 50% has been illustrating for 4 parameters in Figure . In this diagram, the value for fuzzy desirability of 50% for P2, P27, and P24 is less than the average importance degree which is (5) in a 10 distance scale so they would be excluded.
Figure 8. Selection the most effective parameters based on minimum fuzzy desirability of 50%.
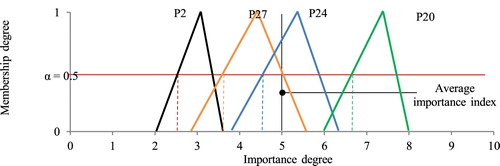
Some of the ineffective excluded factors like P24 in Figure are excluded, despite having a mean value higher than the average index because the wide shape of the triangular membership function puts the lower value of the fuzzy desirability of 50% less than (5). This shows how lack of consensus and uncertainty expressed by fuzzy logic can affect the final ranking of bridges that cannot be seen in classical statistical methods. As a case study for this research the decision-making matrix for forty (40) roadway bridges of Tehran city is formed and the bridge prioritisation order with a common multi-attribute decision-making model using Analytical Hierarchy Process (AHP) is compared [Citation17]. In the fuzzy data input stage of the case study, the data related to the 13 eliminated factors is not considered.
4.2. Forming the Fuzzy Decision-making Matrix
In a fuzzy decision-making system, first fuzzy desirability of each item must be calculated and then they should be ranked. Arrays (nij) and weight vector (Wj) in a fuzzy multi-criteria decision-making matrix, are fuzzy and linguistic rather crisp. We used this matrix to prioritise forty (40) bridges of Tehran metropolitan to put them in order for maintenance operations so the criteria are the effective factors that affect bridge prioritisation and the items are bridges. Weight of each parameter (Wj) is a triangular fuzzy number that has been calculated through the collecting of eighty (80) responses to the questionnaires and related mathematical analysis, explained earlier. The entries of this matrix are derived from bridges fuzzy information and inspection reports.
The fuzzy model matrix has been shown in . The array (nij) is ith Bridge assessment according to the jth Parameter. For example, the (n2 31) array is the assessment of bridge (2) to the effective sample parameter 31 (bridge repair cost) in the form of a fuzzy number with three values. These values are the lowest possible, the most possible and the highest possible value of repair cost estimated by the experts.
Table 4. Fuzzy desirability determination matrix [Citation18].
40 triangular fuzzy numbers are obtained from the assessment of each of these 40 bridges to all 32 parameters we recognised as the most effective parameters for urban roadway bridge maintenance.
4.3. Analysing the Decision-making Matrix
4.3.1. Step 1: Determining the Fuzzy Desirability of Each Bridge
Each item (Ai) in a crisp multi-attribute decision-making model is measured through an objective or virtual desirability and then is compared conclusively. In a decision-making case with fuzzy elements, first fuzzy numbers (Ui) for all the items are calculated and then are ranked. In this study, 40 triangular fuzzy numbers for 40 bridges through fuzzy assessment of each bridge, according to 32 factors or criteria is calculated. Calculating the fuzzy numbers (Ui) for each item Ai is done in two main methods:
Fuzzy method using additive weighting
Fuzzy AHP
This study uses a fuzzy additive weighting method for calculating the fuzzy numbers.
4.3.1.1. Fuzzy Additive Weighting Method
In simple additive weighting method (SAW), Ui for each (i) option is calculated as follows:
(15)
(15)
But if Wj and nij are fuzzy, so:
(16)
(16)
(17)
(17)
So that xij, yj consists of real numbers on the line R, so for Ui we have:
(18)
(18)
So that:
(19)
(19)
Membership functions μ(Ui) is calculated:
(20)
(20)
If μ(Xij) and μ(yj) are continuous, to compute μ(Ui) ‘section α’ method will be used. There are several fuzzy additive weighting methods, including [Citation16]:
Baas method
Kwakernaak method
Dubois and Prade method
Cheng method
Dubois and Prade method
In this study Dubois algorithm is used to compute fuzzy desirability of options which is described as below.
4.3.1.2. Dubois and Prade Method
Two researchers Dubois and Prade [Citation18] offered a new way of calculating fuzzy number Ui, as the following algorithm:
Step 1: assume one point α0, for Ui and obtain that Wj and nij sets as follows:
(21)
(21)
(22)
(22)
Step 2: convert weights Wj to the fuzzy normalised (Pj) as follows:
(23)
(23)
n set of α0 (Pj–, Pj+) can be calculated of the normalised fuzzy (Pj), as follows:
(24)
(24)
(25)
(25)
Also with assuming , is placed:
(26)
(26)
Step 3: for Ai option and fuzzy number nij there is
(27)
(27)
Values Xij– and Xij+ are ordered as follows:
(28)
(28)
(29)
(29)
Step 4: Ui (min) and Ui (max) are calculated as follows:
(30)
(30)
(31)
(31)
Parameters (l) and (h) are needed to be evaluated. (h) Can be calculated by considering the following conditions:
(32)
(32)
This is the process that starts with h=1and Z1 is calculated to see if Z1 ∈ [P1-, P1+] or not? The procedure continues by increasing h until the answer to the above question becomes positive, and the value of Zh will be determined. Zh is interpreted by Wh and also gets fit in the following equation:
(33)
(33)
This means it would be getting fit in . The researchers prove that there would be a unique value of h which makes the above equation true. Similarly, the value of l can be specified regarding the following condition:
(34)
(34)
And also for we should have:
(35)
(35)
Step 5: Through applying several cross-sections of α0 and repeat the above algorithm a fuzzy definition of Ui is determined.
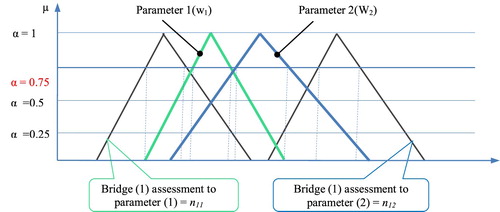
Figure illustrates a schematic diagram of the fuzzy desirability determination of one bridge, according to two (2) factors or parameters.
Figure 9. Schematic diagram of fuzzy desirability determination of an item using different cuts of α.
4.3.2. Step 2: Fuzzy Ranking of Bridges
In the previous section fuzzy data of each bridge, according to thirty-two (32) fuzzy parameters was converted to one fuzzy desirability or one fuzzy number (Ui) for each bridge. In this section, it turns to rank the 40 obtained fuzzy numbers. Various methods have been proposed for fuzzy ranking including:
Baas Method-Kwakernaak Method
Baldwin & Guild Method
Hamming distance
Ranking using the α section
Adamo Method
Mabuchi Method
In this study, the Mabuchi algorithm was used, which is more accurate compared to other methods and described as below:
4.3.2.1. Mabuchi Method
Mabuchi [Citation19] proposed a ranking method by using multiple levels of (α), so that these sections will have the role of the weights. The compared fuzzy sets are first transformed to an index Jij(α) which is a function and indicates the fuzzy dominance degree of Ui over Uj . Where Ui and Uj are fuzzy sets.
Secondly, a single-valued version of Jij0 is derived from Jij(α) by way of α-weighted averaging which reflects the weighted average dominance degree of Ui over Uj. The following algorithm makes this method steps clear.
Step1. The difference Ai – Aj is obtained:
(36)
(36)
(37)
(37)
The fuzzy set Dij will convert the comparison between Ui and Uj to a comparison with a crisp number ‘zero’.
Step2. α – cut of Dij is defined as follows:
(38)
(38)
Also, m+ and m–, respectively, are assumed equal to the length of the pros and cons of range [v–, v+].
Step 3: Set
(39)
(39)
If the existing interval is zero (v–, v+ are coincident), then (α) is defined as:
(40)
(40)
(α) represents the dominance degree of Ui over Uj at level of (α) and whatever the value of
(α) is higher, the certainty of Ui ≥ Uj will be more. Now if we put
then:
(41)
(41)
If (α) variations against the (In the coordinate system α O
) be located more in the positive side of (OJ) axis (especially for higher values of α) we can say that Ui is strongly dominant over Uj, but if the (α) variations be greatly expanded on positive and negative sides, then we can’t reach a definitive conclusion.
(α) Is considered a multi-value indicator because it is possible to be true for several values of α.
If a simple ranking of fuzzy comparison is required the fourth step would apply:
Step 4: the single-valued index of is defined as follows:
(42)
(42)
where h (Dij) represents the upper limit of
(v).
is considered an expected value of
(dominance Ui over Uj) weighted by (α) and (α) as a membership function which fits in α = µUi>Uj (Jij).
simply is determined according to the Figure graph, so that if S1 and S2 are located on both sides of α axis (such as Figure ) then their difference determines
and the sum of S1 and S2 for a situation in which they both are on the positive side of OJ represents
. Also, –(S1 + S2) for a condition in which both are located on the negative side of OJ specifies
. Consequently,
can be positive or negative.
Figure 10. (α) Variation.
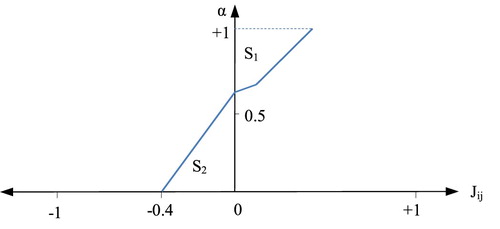
Figure 11. Schematic diagram of bridge fuzzy ranking.
Whereas the accurate calculation of that integral may be difficult, an approximation of the integral is defined by dividing the [0, h (Dij)] interval of (α) to K subintervals. The integral equation is written as follows:
(43)
(43)
where
(44)
(44)
And K selection is arbitrary.
In case of existing several fuzzy sets in one problem, (α) index can be calculated for each pair (i, j) and a preference matrix of all terms is being generated. Otherwise, we can form a minimum fuzzy among U1, … , Um as follows:
(45)
(45)
And then each fuzzy (xi) (for all i) is being compared by μmin(w), so that the index Jmin(α), will specify the ranking situation of each ith set among all sets.
The above algorithm for bridge fuzzy numbers which are in term of continuous and triangular can also be used. For an arbitrary section of α:
(46)
(46)
(47)
(47)
For the following condition for calculating (α):
Condition (a): bi ≠ aj
(48)
(48)
Condition (b): bi = aj (zero distance)
(49)
(49)
Condition (C): bj > ai and bi > aj
(50)
(50)
In the case of having a continuous membership function of Dij differences, (Dij = Ui–Uj), (α) is calculated as follows:
(51)
(51)
(52)
(52)
(53)
(53)
(54)
(54)
And for all above conditions:
(55)
(55)
where
and
.
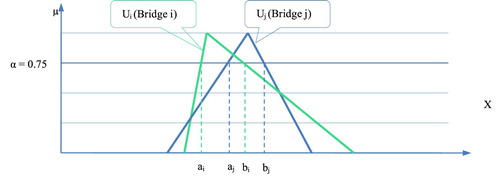
Figure shows a schematic diagram of fuzzy ranking for two bridges with final fuzzy numbers of Ui and Uj based on Mabuchi method by using several cuts of (α).
The multi-valued index of (α) represents the preferential relations between fuzzy sets Ui and Uj, these relations may be explained by distribution interpretation of α according to
literally. Interpretation may be based on curve distribution on
axis, intermediate positions along the axis
, and be based on the height of the curve. Distribution of (α) on one side of the α-axis results in a clear outcome, but its extension on both sides of the α-axis causes complexity in interpretation.
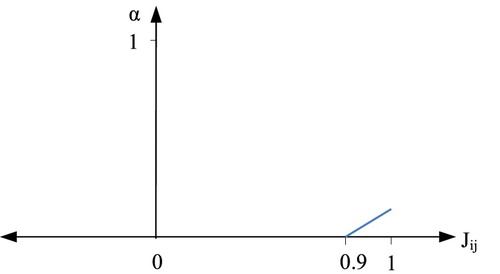
For example, in the following graph, the distribution of α is on one side of the α-axis with an average close to (1), but with low value of h (upper limit of membership function), thus Ui is dominant over Uj without complexity but with low credit due to the low h (Figure ).
Figure 12. Distribution of (α) on one side of the (α) axis.
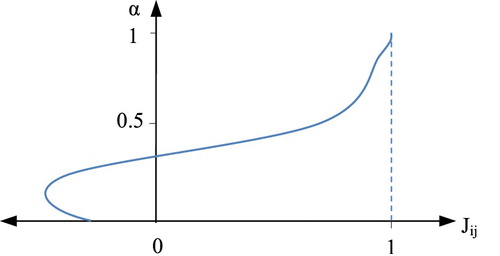
Unlike the Figure , the distribution of (α) in Figure is faced with complexity and Ui is dominant over Uj slightly.
Figure 13. Distribution of (α) on both sides of the (α) axis.
4.3.2.2. Developed Program for Fuzzy Multi-criteria Decision-making Models
In this study determining the fuzzy number of each bridge, according to 32 parameters with 32 different importance degrees and assessments for 4 α-level (from 0 to 1.0 in a step of 0.25) needs 4 × 264 calculations. This procedure should be repeated for 40 bridges and then these 40 final fuzzy numbers should be ranked. Due to the analysis computations complexity of the fuzzy multi-criteria decision-making models, a computer program using Visual Basic programming language was developed for performing the research methodology steps from the qualitative survey to the final bridge ranking. After inputting the initial required data, in analysis stage, Dubois algorithm and Mabuchi algorithms are applied for computing fuzzy desirability and fuzzy ranking respectively. Figure displays a part of one of this computer program feature, which is the preference comparison matrix of factors. Positive numbers with red colour indicate the degree of preference and negative numbers with green colour show a non-preference degree.
Figure 14. Part of parameters’ preference and non-preference matrix.
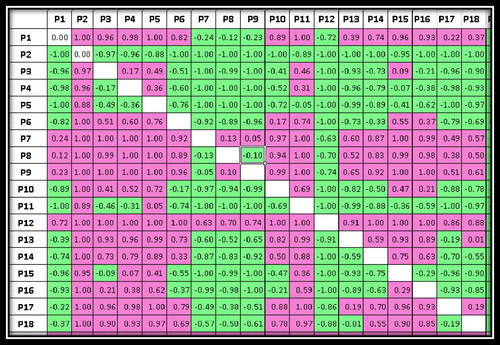
For example, the parameter No.12 (P12) with final ranking 4 has 63% preference to parameter No.7 (P7) with final ranking 7, when this parameter has a 70% preference to (P8) with ranking 11. This feature of the program which shows a vision from the dominance degree of parameters to each other in addition to their ranking is also noticeable.
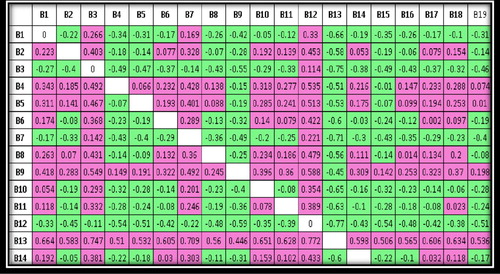
Figure shows a part of the fuzzy desirability comparison matrix of bridges which results in the final ranking of bridges for maintenance operation. For example, the bridge No. 13 (B13) has priority to all other bridges for maintenance operation because its fuzzy desirability number is positive to other bridges. This bridge has a 51% preference degree to bridge No 4. (B4). As shown in Figure the preference of bridge No. 4 (B4) to this bridge is the negative value of this number (−0.51), which represents the degree of non-preference of this bridge to the bridge No 4 (B4).
Figure 15. Part of preference or non-preference comparison matrix of bridges.
5. Comparison of Fuzzy Method with Non-fuzzy Common Methods
The described fuzzy approach was verified by non-fuzzy common methods from 2 points of view:
Effective factors ranking
Bridge prioritisation for maintenance
5.1. Effective Factors Ranking Comparison
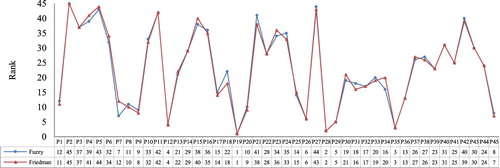
A classic ranking method based on the Friedman test was used to compare the results of factors ranking. In this test, which is a classic method for ranking the statistical data an average rank is calculated for each parameter based on the frequency of responses, standard deviation and normal average importance value, which is called ‘Friedman test’ average rank'. Due to the large volume of data, the SPSS (Statistical Package for the Social Sciences) software was applied for processing the questionnaires and parameters were ranked using this value [Citation20]. Figure shows two diagrams represent this comparison. The blue diagram illustrates the result of factors ranking based on Mabuchi method using the proposed method for generating the membership function of the factors importance degree and the red diagram indicates the ranking based on the Friedman test.
Figure 16. Factors ranking diagrams based on fuzzy approach and Friedman test method.
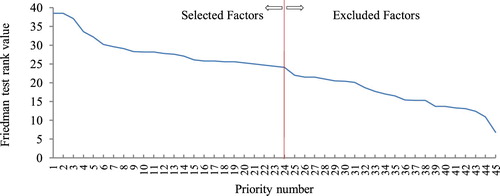
In a non-fuzzy study [Citation17], selecting the most important parameters for the further process was based on this fact that the number of parameters shouldn’t be limited as much as to raise the prioritising error. Also, they should not be such extended that encounter analysis process with complexity. So after performing the ranking using the Friedman test rank value, on the corresponding diagram that shows the rank value of priority numbers (Figure ), 24 parameters before the point that a significant fracture appears in the diagram, were selected as most important parameters.
Figure 17. Selection method of the most effective factors ranked by using Friedman test.
5.2. Bridge Prioritisation for Maintenance
The taken fuzzy approach was verified with a common multi-attribute decision-making strategy for prioritising using the analytic hierarchy process (AHP) [Citation17]. This method is based on pairwise comparisons of the elements using crisp values. Figure shows the comparison between bridges ranking using fuzzy approach and AHP method for 40 bridges.
Figure 18. Bridge ranking diagrams using fuzzy approach and AHP method.
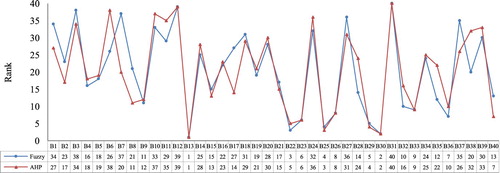
A significant part of input data to a bridge management system is qualitative assessments of effective factors and bridge conditions which depend on the experts’ experiences and inspectors’ judgments. Figure indicates how different strategies in this area result in different outcomes of bridges prioritisation order. Ranking the bridges using the AHP method was based on crisp pairwise comparison of the bridges according to 24 factors, while the fuzzy ranking approach used 32 factors, by covering a bigger range of uncertainty and ambiguity in determining the factors importance degree and also bridges inspection judgments. In the procedure of AHP pairwise comparisons, unconsidered uncertainties result in increasing the comparisons error rate, especially when the number of parameters is high. These structural differences will change the factors’ evaluation procedure and finally the bridges’ prioritisation order.
6. Conclusion
The common methods for maintenance management of urban roadway bridges derived from dual value logic and crisp judgments of experts are not compatible with the uncertain and vague atmosphere of this area. The unconsidered uncertainties affect the selection process of effective factors and also the procedure of assessment and comparison of the bridges. This eventually encounters the prioritisation process with significant errors and serious limitations. The proposed methodology in this paper using a fuzzy approach was the considered solution to overcome these limitations.
This methodology was carried in three main steps on a real bridge maintenance management case study. In the first step, the effective factors which can influence the bridge prioritisation for maintenance were identified and then the triangular fuzzy number of each factor importance degree was generated through a qualitative assessment accomplished by experts and professionals in the field of bridge maintenance. In the second step, the fuzzy number of each bridge assessment according to each effective factor was determined through investigating the bridge inspectors and the decision-making matrix was formed. Finally by developing a computer program which didn’t have any restriction about the number of input parameters or options, the most accurate algorithms in determining the fuzzy desirability and fuzzy ranking were applied to prioritise the 40 bridges of the case study. In the process of gathering the data required for this study, the involved uncertainties discussed with experts who were involved in the maintenance and inspection of bridges and using fuzzy logic provided this opportunity to cover a wider area of judgments includes the vagueness which eventually resulted in different results of parameters valuation and bridge ranking compared to previous attempts using non-fuzzy methods.
Acknowledgements
The authors are also grateful for Tehran municipal technical assistance and all experts and engineers contributed in this survey.
Disclosure statement
No potential conflict of interest was reported by the author(s).
Additional information
Notes on contributors
Amin Amini
Dr Amin Amini obtained his B.Sc. in civil/structural engineering in 2004 and his M.Sc. degree in construction management engineering in 2010 from Iran. He immigrated to Australia in 2011 and granted the Australian Postgraduate Award (APA) to do his PhD in civil engineering at Curtin University which was completed in 2019. As a chartered professional civil/structural engineer he commenced his consulting engineering firm in 2018. His research interests include risk management of infrastructure projects, decision making in engineering and management using multi-attribute decision-making models and fuzzy logic.
Navid Nikraz
Dr Navid Nikraz obtained his B. Eng (Electrical) B. Comm degrees from UWA in 2005 and went on to complete his PhD in Electrical Engineering at UWA in 2008. He commenced his role as a Senior Lecturer at Curtin University in 2010 and currently supervises 3 PhD and 3 M. Phil students. His current research interests include: Asset Management, Options Analysis, Project Feasibility, Linear/Non-linear state space observation and power system protection.
References
- Ross TJ, Booker JM, Parkinson WJ. Fuzzy logic and probability applications: bridging the gap. Alexandria, VA: Society for Industrial and Applied Mathematics; 2002.
- Zadeh LA. The concept of a linguistic variable and its application to approximate reasoning – II. Inf Sci. 1975;8(4):301–357.
- Ryall MJ, Ryall M. Bridge management. Oxford: Butterworth-Heinemann; 2001.
- Al-Wazeer A, Harris B, Dekelbab WJPR. Applying “fuzzy concept” to bridge management. Public Road Publications, FHWA-HRT-08-005; Jul/Aug 2008;72(1).
- Tee AB, Bowman MD, Sinha KC. A fuzzy mathematical approach for bridge condition evaluation. Civil Eng Syst. 1988;5(1):17–24.
- Pushpakar D, Barai S. Fuzzy logic based bridge management system for handheld devices. 2007 International Conference on Industrial and Information Systems, Peradeniya, Sri Lanka 9–11 August 2007. IEEE.
- Tarighat A, Miyamoto AJESWA. Fuzzy concrete bridge deck condition rating method for practical bridge management system. Expert Syst Appl. 2009;36(10):12077–12085.
- Agárdy GJATJ. Fuzzy logic techniques in bridge management systems. Acta Tech Jaurinensis. 2008;1(3):561–571.
- Sasmal S, Ramanjaneyulu KJESWA. Condition evaluation of existing reinforced concrete bridges using fuzzy based analytic hierarchy approach. Acta Tech Jaurinensis. 2008;35(3):1430–1443.
- Kaufmann A, Gupta MM. Introduction to fuzzy arithmetic: theory and applications. New York: Van Nostrand Reinhold Company; 1985.
- Rashidi M, Gibson P, Ho TK. A New Approach to Bridge Infrastructure Management. In: Campbell P, Perez P, editors. Proceedings of the International Symposium of Next Generation Infrastructure, 1–4 October 2013, SMART Infrastructure Facility, University of Wollongong, Australia.
- Valenzuela S, de Solminihac H, Echaveguren TJJOBE. Proposal of an integrated index for prioritization of bridge maintenance. J Bridge Eng. 2009;15(3):337–343.
- Alikhani A. Urban bridges maintenance prioritization. Tehran: Iran Science and Technology University; 2009.
- Cochran WG. Sampling techniques. 3rd ed. New York: Wiley India Pvt; 2007.
- Dubois D, Prade H. Possibility theory: an approach to computerized processing of uncertainty. New York: Plenum Press; 2012.
- Asgharpor MJ. Multi criteria decision makings. Tehran: Tehran University Publications; 2009.
- Fathizadeh A. Evaluating the effective parameters in urban roadway bridges prioritization. Engineering, Science and Research Branch of Tehran Azad University; 2010.
- Dubois D, Parade H. The use of fuzzy numbers in decision analysis. In: MM Gupta, E Sanchez, editors. Fuzzy information and decision processes. Amsterdam: North-Holland Publishing Company; 1982. p. 309–321.
- Mabuchi S. An approach to the comparison of fuzzy subsets with an alpha-cut dependent index. IEEE Trans Syst Man Cybern. 1988;18(2):264–272.
- Conover WJ, Conover WJ. Practical nonparametric statistics. 2nd ed. New York: John Wiley and Sons; 1980.