
 ?Mathematical formulae have been encoded as MathML and are displayed in this HTML version using MathJax in order to improve their display. Uncheck the box to turn MathJax off. This feature requires Javascript. Click on a formula to zoom.
Abstract
Summary: A new inspection technique for complex mechanical structures is proposed in this paper, where a fuzzy inference system carries out structural inspection. The inputs to the fuzzy inference system are the elements of a fault signature, an array of numbers prepared with use of below 5 kHz resonance frequencies of faultless and a number of faulty specimens.
Advantage: Below 5 kHz resonance frequencies are easier and less expensive to obtain compared to higher frequency ones.
Limit: Due to high expenses of experiments, reliable finite element models were alternatively used to obtain resonance frequencies of the faulty specimens.
Results: The developed fuzzy inference system in this research accurately located an under-surface fault in an engine cylinder block.
1. Introduction
Structural inspection [Citation1], structural damage detection [Citation2] or structural health monitoring [Citation3] are roughly equivalent terms used for fault diagnosis of mechanical structures. Structural inspection ideally answers the following three questions: (i) Is there any faults? i.e. fault detection, (ii) where is (are) the fault(s)? i.e. fault isolation or localisation, (iii) how is the fault? (e.g. in terms of size and shape) i.e. fault identification [Citation4–6]. Two approaches may be used in structural inspection or, in a wider view, fault diagnosis: (i) local or signal-based approach, and (ii) global or model-based approach.
In the first approach, the behaviour/information of the faultless system is obvious. For example, a metal part with no internal void space permits an ultrasonic wave to pass at a certain speed. Due to this evident response of the faultless system, only the response/information (in this example, the ultrasonic wave speed) of the faulty system is employed in fault diagnosis [Citation7]. Such methods are called ‘signal-based’ methods [Citation6, Citation8]. All signal-based techniques of structural inspection should be used in the locality of the fault [Citation9]; hence, in the literature of structural inspection, local and signal-based approaches are equivalent [Citation10]. Some other examples of local approach for structural inspection are radiography [Citation11], CT scanning [Citation12], magnetic field [Citation13] and eddy-current [Citation14] methods.
In global or model-based methods, a model or some behavioural information of the faultless system is needed for inspection. Vibration-based structural inspection methods belong to this approach [Citation5, Citation15]. Vibration-based inspection techniques use modal/dynamic properties of the ‘whole’ system. In other words, vibration-based methods do not depend on the data collected from the fault locality; therefore, vibration-based methods are global. In general, terms ‘global’ and ‘model-based’ are practically exchangeable in the literature of structural inspection [Citation5].
Vibration-based methods, as global methods for structural inspection, have the evident advantage of not being in need to access the locality of the fault. These methods can ideally provide information on damage existence (fault detection), location (fault isolation) and size (fault identification) for a mechanical structure [Citation16]. NASA, in the late 1980s, employed vibration-based methods to inspect its shuttle instead of established signal-based methods [Citation17]. However, some research disappointingly concluded that only higher frequency modes (e.g. with resonance frequencies over 30 kHz) are sensitive enough to local damages [Citation9]; while, the measurement frequency of common acceleration sensors is up to 10 kHz; that is, modes with a resonance frequency up to 5 kHz can be captured with these sensors [Citation18]. This conclusion would mean that only expensive vibration sensors with demanding operation could collect meaningful vibrational information for structural inspection. This disappointing conclusion faded the initial hopes to widespread use of vibration-based methods in quality control of manufactured metal parts [Citation9].
However, this paper shows that well-developed fuzzy inference systems can successfully extract vivid structural inspection results out of low frequency vibrational information of a complex mechanical part, an engine block cylinder. Vibration-based structural inspection generally uses dynamic/modal properties of mechanical structures such as resonance frequencies, mode shapes and damping ratios [Citation8, Citation16, Citation19–22]. This research employs the most easily obtainable dynamic properties, resonance frequencies at a fairly low frequency range (below 5 kHz) for structural inspection.
2. Problem Statement and Steps of Solution
This research aims to develop an algorithm including a fuzzy inference system (FIS). The inputs to the algorithm are below 5 kHz resonance frequencies of a faulty engine block cylinder (as a complex mechanical structure). The output of the algorithm is the fault location (extendible to other fault information in future research).
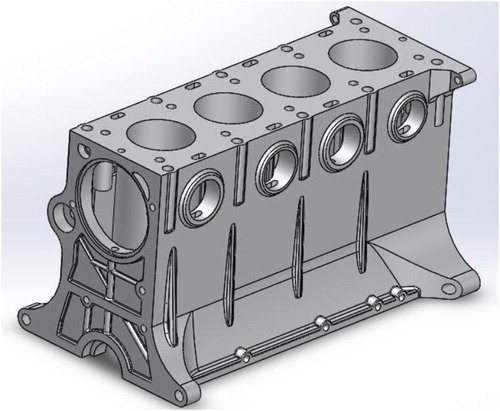
The investigated cylinder block, shown in Figure , belongs to a 1332 cm3 engine of Saba car made by Saipa company based in Iran. Some simplifications have been considered in this study: only a single fault of a particular type has been assumed to happen in the cylinder block, a spherical void with the diameter of 1 cm, located 2.5 cm above the bottom surface, a common size and depth for casting faults [Citation23]. This removes four potential outputs of the fault diagnosis algorithm: number, shape, size and depth of the fault(s), only two potential outputs, two dimensions of the fault location, remain to be estimated. It is also assumed that a fault may only happen on a line. Thus, only a single dimension of the fault location remains as the sole output of the algorithm. However, as detailed in section 6 of the paper, successful development of an algorithm to identify one property of a fault in a complex structure paves the way to develop full scale structural inspection algorithms e.g. with six outputs.
Figure 1. A computer model of the cylinder block.
3. Steps of Solution
Three following steps should be taken to develop the proposed fault isolation (or in general, structural inspection) algorithm:
Finding below 5 kHz resonance frequencies of the faultless specimen and a number of specimens with a fault, detailed in section 4.
Initial process of information collected at step 1 to produce a ‘fault signature' associated with each fault location (in general, a signature for any faulty specimen). Section 5 details this step.
Development of a fuzzy inference system (FIS) to map the fault signatures, prepared in step 2, to the fault locations (in general, all fault information will be the destination of mapping). This step is presented in section 6.
4. Step 1 – Finding Resonance Frequencies
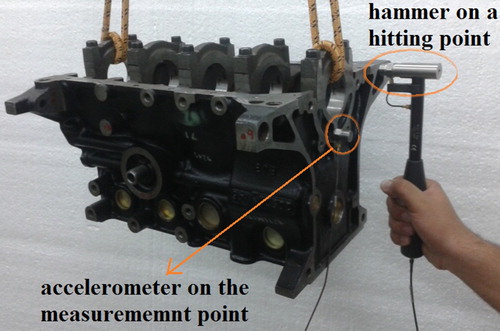
The resonance frequencies of the faultless specimen were found through experimental modal analysis, as shown in Figure . A DJB single-axis integrated-electronics piezoelectric accelerometer of A/120/V type and an 8202 B&K impact hammer were used in experimental modal analysis; the acceleration of a single measurement point on the cylinder block was recorded, once the specimen was hit with a hammer on one of 21 other points. A B&K 3560 analyser was utilised to extract modal properties of the faultless cylinder block, including its resonance frequencies. Experimental modal analysis shows that the first 24 resonance frequencies of the faultless specimen are below 5 kHz.
Figure 2. Upside down engine cylinder block during experimental modal analysis.
Due to experimentation limits, it was impossible to have many faulty specimens and perform experimental analysis on each of them. Alternatively, a finite element model (FEM) of the faultless cylinder block was developed and experimentally validated. Then, for each fault location, a fault was added to the validated FEM on the specified location, and a FEM was developed for each faulty specimen. Then, resonance frequencies of faulty specimens were calculated through numerical modal analysis using their FEMs.
The FEM of the cylinder-block has 2002793 nodes and 1179381 irregular tetrahedral elements, constructed in ANSYS software package. In order to validate this model, the resonance (or modal) frequencies calculated out of numerical modal analysis of the FEM was compared to the ones obtained through experimental modal analysis, as presented in Table , where
(1)
(1)
Table 1. Resonance frequencies resulting from experimental and FEM modal analysis.
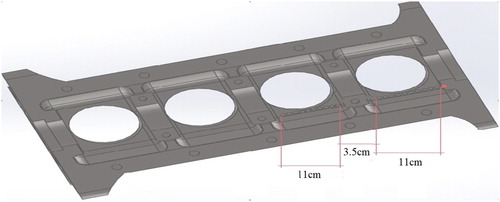
Twenty specimens (or FEMs) with a fault were used in this research. In Figure , circles roughly present fault locations. With considering the filled circle 2.5 cm far from the edge, as the origin, fault locations in cm can be listed as x = [1 2 3 4 5 6 7 8 9 10 13.5 14.5 15.5 16.5 17.5 18.5 19.5 20.5 21.5 22.5]. Numerical modal analysis of faulty specimens’ FEMs, for each of afore-listed fault locations, results in a list of 24 below 5 kHz resonance frequencies.
Figure 3. Fault locations on a section of the cylinder block. The filled circle, close to the edge is the origin.
5. Step 2 – Initial Process of Collected Resonance Frequencies
Experimental and numerical modal analysis, reported in section 4, result in 21 lists of 24 below 5 kHz resonance frequencies, one list for faultless part and 20 lists each associated with a fault location. The elements of the latter 20 lists are presented as k fi. i refers to the order of the vibrational mode associated with the resonance frequency, varying between 1 and 24; k refers to the fault location, varying between 1 and 20.
All k f i s were deducted from the resonance frequencies of the faultless specimen associated with their own mode order fi. The result is an array of 24 numbers for each fault location. This array is called the ‘signature of fault location’ or in short ‘fault signature’. kS i in (2) is the ith element of the signature of kth fault location:
(2)
(2)
S with (20 × 24=) 480 elements, an array including 20 fault signatures with 24 elements each, is the output of the initial process of resonance frequencies obtained in step 1.
6. Step 3 – Development of Fuzzy Inference System
At this step, a FIS was developed to map the signature of a fault location (as the input) to its corresponding location
(as the output).
and
may be kx, kth fault location in x (presented in section 4) and its corresponding fault signature kS, or they may be any another fault location (not listed in x, but within or near to the range of x) and its fault signature.
A linear Sugeno-type FIS was used in this research [Citation24]. These fuzzy systems have been successfully used to tackle engineering problems in the areas of data-driven modelling [Citation25], estimation [Citation26] and virtual sensing [Citation27] and can be converted into neuro-fuzzy networks [Citation28].
Let us assume that the FIS has n rules, where n is yet to be identified. Each rule receives all 24 elements of as inputs and has a membership function per input. The output of each membership function is a membership grade. In this research, a Gaussian membership function of (3) produces a membership grade,μij, for jth rule and ith input (
),
(3)
(3)
where Cij and Ωij are the centre and the width of the membership function, respectively. The product of membership grades of a rule was considered as the weight of the rule, a number between zero and one, appearing in the denominator of (4). In addition, in linear Sugeno fuzzy systems, the output of each rule is a linear combination of its inputs (
s, elements of the signature of a fault location), as shown in the numerator of (4). The output of the whole model (
, the fault location) is the weighted sum of rules outputs:
(4)
(4)
where
stands for estimated. Model (4), if fully developed and validated, can estimate the fault location (
) with use of fault signature (
). However, for this purpose, the values of n (number of rules) and the elements of A, B, C and Ω should be identified.
Development of the FIS requires two steps:
Model generation: finding the number of rules, n, and initial estimation of model parameters or the elements of A, B, C and Ω
Parameter identification: determining model parameters accurately. The developed FIS should be cross-validated afterwards.
In this research, the FIS was developed with use of a data-driven approach. Therefore, the data prepared in section 5 were utilised, composed of a list of 20 fault locations, x, and their associated fault signatures. Three sets of data were needed for this research, modelling data (to be used in both model generation and parameter identification), validation data (to prevent overfitting in parameter identification) and test data to cross-validate the developed FIS. The fault location of 18.5 cm and its fault signatures form the test data; while the validation data includes the fault locations of 7, 10 and 20.5 cm and their fault signatures. The rest of the prepared data are the modelling data.
Model generation was carried out with modelling data using subtractive clustering technique, as detailed in [Citation29], with the following coefficients: Range of Influence = 0.5, Squash Factor = 1.25, Accept Ratio = 0.1 and Reject Ratio = 0.15.
For parameter identification, first, the ‘modelling error’, Em, was defined to represent the discrepancy of real fault location and the one estimated by the FIS (with ) for the modelling data. (5) shows the general formula to find error for modelling (Em), validation (Ev) or tests data (Et).
(5)
(5)
The parameters of the model were adjusted using an iterative algorithm [Citation29] so as to minimise the modelling error. First, the least square of error technique [Citation30] adjusts the elements of A and B of the initial model (the output of subtractive clustering). Then, error backpropagation with gradient decent method with a variable step size [Citation31] adjusts C and Ω elements. Afterwards, Ev was calculated. These three steps were performed iteratively, till the validation error, Ev, at one iteration exceeds Ev of its previous iteration. This situation, Ev>previous Ev, is a sign of overfitting and signals to stop the iterative algorithm of parameter identification [Citation25]. If the algorithm did not stop in the case of overfitting, the modelling error would further decrease at the cost of loss in generality of the FIS [Citation32]. The resultant FIS still needs to be cross-validated. A widely accepted cross-validation criterion is that the estimation output by the model calculated with the test data (never used in parameter identification directly or indirectly) should be acceptable [Citation33, Citation34]; that is, Et should be small enough. Here is a pseudocode for the development of the FIS:
10 Initial modelling through subtractive clustering with use of modelling data (n is identified)
Calculate Em and Ev
While Ev is decreasing
o Adjust A and B elements so as to decrease Em through the method of least square of errors
o Adjust C and Ω elements so as to decrease Em through backpropagation gradient descent method with variable step size
o Determine Ev and Em
Calculate Et (test error)
If Et is unacceptable go to 10
7. Results and Discussion
In this research, subtractive clustering led to an FIS with 16 rules. The developed FIS estimates the location of 18.5 cm as 17.47 cm. It is an acceptable result considering that the data of this fault location have not been used in FIS development at all. That is, the FIS is cross-validated in the operating area in which its modelling, validation and test data have been collected.
The FIS has been developed using below 5 kHz resonance frequencies. That is, easy to collect vibrational data can be effectively used for fault isolation in complex engine parts.
Considering (3) and (4), and n = 16, A, C and Ω each has (24 × 16=)384 elements each, and B has 16 elements. Therefore, the FIS has 1168 parameters altogether, considerably more than the elements of all data arrays, which are 500, composed of 480 elements of S and 20 fault locations. This shows that the number of experiments or reliable numerical simulations are fairly small, and modal analysis of a larger number of faulty specimens could result in a much higher accuracy. In the case of availability of results from experimental or reliable numerical modal analyses, it is theoretically possible to update the aforementioned pseudocode/formulae to increase the number of FIS outputs or use parallel single output FISs to estimate two or three dimensions of the fault location or even size and shape factors of the fault(s). Six parallel FISs, similar to the one developed in this research, would roughly have 7008 parameters; one can expect that thousands of modal analyses with different fault locations/sizes/numbers/shapes would be needed to develop an FIS (or a combination of single output FISs) to carry out structural inspection in full. In total, the proposed method requires the results of several modal analyses prior to FIS development; this seems to be the major drawback of the method.
8. Conclusion
This paper presents a new method to structural inspection of complex mechanical parts, based on development of a fuzzy inference system. The proposed method uses resonance frequencies of below 5 kHz, which are much easier to obtain compared to the ones at higher frequency ranges or other modal properties. Development of the fuzzy inference system requires three steps, first, finding below 5 kHz resonance frequencies both for faultless specimen and for a number of faulty specimens. In this research, a fault was added to a validated FEM, on a different location per FEM, and then numerical modal analysis was carried out to find resonance frequencies. The second step is to process the obtained resonance frequencies to form a signature (an array of numbers) for each fault location. Afterwards, at the third and last step, a fuzzy inference was developed to map signatures to their associated fault locations. The developed fuzzy inference system in this research could locate an under-surface fault accurately in an engine cylinder block.
Disclosure statement
No potential conflict of interest was reported by the author(s).
Additional information
Notes on contributors
Morteza Mohammadzaheri
Morteza Mohammadzaheri received his PhD from the University of Adelaide in 2011, in the area of Intelligent Control System Design. He has published more than 120 peer reviewed journal and conference papers in mechatronics, control, vibrations, processes and the greater area of application of artificial intelligence in engineering. He is now an Assistant Professor of Dynamics and Control at the Department of Mechanical and Industrial Engineering, Sultan Qaboos University, Oman.
Amirhosein Amouzadeh
Amirhossein Amouzadeh received his Master of Mechanical Engineering - Applied Design from Azad University Semnan Branch in 2015. In addition to research/academic roles, he has served as a Senior Inspector in Firouzkuh Cement Company, Iran, and as a Site Manager at Embaba and Garma Gostar Kohin Companies, Iran.
Mojtaba Doustmohammadi
Mojtaba Doostmohammadi received his Master of Mechanical Engineering - Applied Design from Azad University Semnan Branch in 2015. In addition to research/academic roles, he has served as a Mechanical Engineer at Parizan Company (manufacturing hydraulic jacks and automobile parts) and as a Mechanical Supervisor at Iran Khodro and as a Quality Management Engineer at Nasaji Kavir Company.
Mohammadreza Emadi
Mohammadreza Emadi is a Ph.D. candidate of Mechanical Engineering in the area of System Dynamics, Vibrations and Control at Shahrood University of Technology, Iran.
Ehsan Jamshidi
Ehsan Jamshidi is an Assistant Professor at Energy and Sustainable Development Research Centre, Semnan Branch, Islamic Azad University, Semnan, Iran.
Mojtaba Ghodsi
Mojtaba Ghodsi is a Senior Lecturer of Instrumentation and Measurement Systems at the School of Energy and Electronic Engineering at the University of Portsmouth, UK. He received his Ph.D. in Precision Engineering from the University of Tokyo (2007), where he also served as a JSPS postdoctoral fellow. His main research interests include smart materials and structures, NDT and mechatronics systems.
Payam Soltani
Payam Soltani is a Senior Lecturer in Mechanical Engineering at the School of Engineering and Built Environment, Birmingham City University, UK. He received his PhD in the area of Nonlinear Modelling of Nanostructures from Ferdowsi University of Mashhad (FUM). During his career, Payam has collaborated/worked with Jaguar Land Rover Co. UK, Space Structure and Systems Lab at the University of Liege, Belgium, Dynamic Research Group at University of Sheffield, UK and BATir Department at the University of Brussels, Belgium. His Core research interests are simulation, computational mechanics, material modelling, smart materials and structures and structural and nonlinear dynamics.
References
- Marra M, Smyth JF. System and method for structural inspection and construction estimation using an unmanned aerial vehicle. Google Patents; 2019.
- Esfandiari A, Nabiyan MS, Rofooei FRJSC, et al. Structural damage detection using principal component analysis of frequency response function data. Struct Contr Health Monit. 2020;27(7):e2550. DOI:https://doi.org/10.1002/stc.2550.
- Sajedi SO, Liang X. Uncertainty-assisted deep vision structural health monitoring. Comput Aided Civ Infrastruct Eng. 2020. doi:https://doi.org/10.1111/mice.12580
- Khalil A, Aljanaideh KF, Rideout G. Fault detection in flexible beams based on output only measurements. American Control Conference (ACC); 2020 1–3 July; Virtual: IEEE.
- Taajobian M, Mohammadzaheri M, Doustmohammadi M, et al. Fault diagnosis of an automobile cylinder head using low frequency vibrational data. Mech Sci Technol. 2018;32(7):3037–3045.
- Gao Z, Cecati C, Ding SX. A survey of fault diagnosis and fault-tolerant techniques-part I: fault diagnosis with model-based and signal-based approaches. IEEE Trans Ind Electron. 2015;62(6):3757–3767.
- Abbas S, Li F, Qiu J, et al. Optimization of ultrasonic guided wave inspection in structural health monitoring based on thermal sensitivity evaluation. J Low Freq Noise Vibr Active Contr. 2015. DOI:https://doi.org/2020:1461348419886189
- Yan Y, Cheng L, Wu Z, et al. Development in vibration-based structural damage detection technique. Mech Syst Signal Process. 2007;21(5):2198–2211.
- Farrar CR, Doebling SW. An overview of modal-based damage identification methods. Proceedings of DAMAS Conference; 1997 30 June–2 July; Sheffiled, UK: Citeseer.
- Yoon M, Heider D, Gillespie J, et al. Local damage detection using the two-dimensional gapped smoothing method. J Sound Vib. 2005;279(1):119–139.
- Hou W, Zhang D, Wei Y, et al. Review on computer aided weld defect detection from radiography images. Appl Sci. 2020;10(5):1878. DOI:https://doi.org/10.3390/app10051878.
- Martin RW, Sabato A, Schoenberg A, et al. Comparison of nondestructive testing techniques for the inspection of wind turbine blades’ spar caps. Wind Energy. 2018;21(11):980–996. doi:https://doi.org/10.1002/we.2208.
- Papaelias M, Cheng L, Kogia M, et al. Inspection and structural health monitoring techniques for concentrated solar power plants. Renew Energy. 2016;85:1178–1191. DOI:https://doi.org/10.1016/j.renene.2015.07.090.
- Forsyth DS. Structural health monitoring and probability of detection estimation. 42nd Annual review of progress in qauntitative nondestructive evaluation; 2015 26–31 July; Minneapolis, USA: AIP Publishing LLC.
- Morteza Mohammadzaheri AA, Ghodsi M, Bahadur I, et al. Health monitoring of welded pipelines with mechanical waves and fuzzy inference systems. International gas union research conference; 24–26 February; Muscat, Oman2020.
- Hakim S, Razak HA, Ravanfar S. Fault diagnosis on beam-like structures from modal parameters using artificial neural networks. Measurement. 2015;76:45–61.
- Hunt D, Weiss S, West W. Development and implementation of a shuttle modal inspection system. 8th International modal analysis conference; 1990; Kissimmee, USA.
- Landau ID, Zito G. Digital control systems. London: Springer; 2006.
- Abdo M-B, Hori M. A numerical study of structural damage detection using changes in the rotation of mode shapes. J Sound Vib. 2002;251(2):227–239.
- Aydin K, Kisi O. Applicability of a fuzzy genetic system for crack diagnosis in Timoshenko beams. J Comput Civ Eng. 2014;29:5. DOI:https://doi.org/10.1061/(ASCE)CP.1943-5487.0000385
- Doebling SW, Farrar CR, Prime MB. A summary review of vibration-based damage identification methods. Shock Vibr Dig. 1998;30(2):91–105.
- Soltani P, Keikhosravy M, Oskouei R, et al. Studying the tensile behaviour of GLARE laminates: a finite element modelling approach. Appl Compos Mater. 2011;18(4):271–282. doi:https://doi.org/10.1007/s10443-010-9155-x.
- Shabestari S, Rahmani M, Saeedinia S. Influence of metallurgical processes on structure and mechanical characteristics of Paykan 1600 aluminum cylinder head. The First Iranian Symposium of Internal Combustion Enginers; Tehran, Iran; 1999.
- Jang JR, Sun C, Mizutani E. Neuro-fuzzy and soft computing. New Delhi: Prentice-Hall of India; 2006.
- Mohammadzaheri M, Mirsepahi A, Asef-Afshar O, et al. Neuro-fuzzy modeling of superheating system of a steam power plant. Appl Math Sci. 2007;1:2091–2099.
- Mohammadzaheri M, AlQallaf A, Ghodsi M, et al. Development of a fuzzy model to estimate the head of gaseous petroleum fluids driven by electrical submersible pumps. Fuzzy Inf Eng. 2018;10(1):99–106. DOI:https://doi.org/10.1080/16168658.2018.1509523.
- Mehrabi D, Mohammadzaheri M, Firoozfar A, et al. A fuzzy virtual temperature sensor for an irradiative enclosure. J Mech Sci Technol. 2017;31(10):4989–4994. doi:https://doi.org/10.1007/s12206-017-0947-x.
- Ghaffari A, Mehrabian AR, Mohammadzaheri M. Identification and control of power plant de-superheater using soft computing techniques. Eng Appl Artif Intell. 2007;20(2):273–287. doi:https://doi.org/10.1016/j.engappai.2006.06.006.
- Mohammadzaheri M, Grainger S, Bazghaleh M. Fuzzy modeling of a piezoelectric actuator. Int J Prec Eng Manuf. 2012;13(5):663–670.
- Mohammadzaheri M, Chen L, Ghaffari A, et al. A combination of linear and nonlinear activation functions in neural networks for modeling a de-superheater. Simul Model Pract Theory. 2009;17(2):398–407. DOI:https://doi.org/10.1016/j.simpat.2008.09.015.
- Mohammadzaheri M, Ghanbari M, Mirsepahi A. Efficient neuro-predictive control of a chemical plant. 5th Symposium on Advance in Science and Technology; 2011 12–17 May; Mashad, Iran.
- Bhattacharyay D, Kocaefe D, Kocaefe Y, et al. An artificial neural network model for predicting the CO2 reactivity of carbon anodes used in the primary aluminum production. Neural Comput Appl. 2017;28(3):553–563. DOI:https://doi.org/10.1007/s00521-015-2093-7.
- Mohammadzaheri M, Ziaeifar H, Bahadur I. Data-driven modelling of engineering systems with small data, a comparative study of artificial intelligence techniques. 5th Iranian Conference on Signal Processing and Intelligent Systems (ICSPIS); 2019 18–19 December; Shahrood, Iran: IEEE.
- Lendasse A, Wertz V, Verleysen M. Model selection with cross-validations and bootstraps – application to time series prediction with RBFN models. Artificial neural networks and neural information processing; 2003 26–29 June; Istanbul, Turkey.