
 ?Mathematical formulae have been encoded as MathML and are displayed in this HTML version using MathJax in order to improve their display. Uncheck the box to turn MathJax off. This feature requires Javascript. Click on a formula to zoom.
ABSTRACT
Research question
This paper is motivated by the relatively late kick-off time of Sunday games (18:00), which is the main day in the Norwegian Eliteserien men’s soccer league. The paper investigates whether Saturday games attract a larger audience.
Research methods
We used data from 11 seasons between 2009 and 2019. In our multivariate regression analyzes, we controlled for more than 30 confounding factors.
Results and findings
We find that Saturday games attract close to 5% larger stadium attendance than Sunday games.
Implications
Our results indicate that moving a large share of games from Sunday to Saturday would increase the gate revenues of teams that have had a negative trend for several years. These findings have implications for the stakeholders of the leagues, calendar committees, and local businesses.
Introduction
Despite many studies on attendance demand, a recent comprehensive review by Schreyer and Ansari (Citation2021) noted a notable absence of research on minor leagues, and that only a few studies have concentrated on the effect of schedule on attendance. Moreover, the results regarding the effect of schedule on attendance during weekend days are mixed. For example, while some papers find a significant difference between weekend days (Buraimo et al., Citation2021; Nielsen et al., Citation2019) and weekend hours (Schreyer, Citation2019) others find no such relationship (Bond & Addesa, Citation2020; Paul et al., Citation2021).
The present paper addresses these scheduling issues by focusing on the Norwegian Eliteserien, the top men’s soccer league in Norway, which experienced many changes over the years. In 2009, the Eliteserien has increased the number of teams from 14 to 16. Since then, the attendance has dropped by 35%. Even when adjusting the numbers to the size of the stadiums, which have also changed over the years, the attendance as a share of the stadium capacity has dropped by about 12 percentage points.
This paper is motivated by a relatively late kick-off time of Sunday games, which is the main soccer day in Eliteserien. More specifically, since 2014, the share of Sunday games has gradually increased from 52% to 66%, and the share of Saturday games decreased from 21% to 11% between the 2013 and 2019 seasons. More importantly, more than 90% of Sunday games in the Eliteserien had a kick-off time of 18:00 or later. Given such a late hour, this paper follows Krumer (Citation2020) and Schreyer (Citation2019), who showed that late kick-off time on Thursdays (UEFA Europa League) and Sundays (German soccer Bundesliga), respectively, attracts a lower attendance. One possible reason for that is that the following day (Friday/Monday) is a working day. Thus, this paper aims to investigate whether Saturday games attract a larger attendance than Sunday games since the late kick-off time on Sunday may not be convenient for many fans who start their workweeks on Monday morning or have young children.
We use data from 11 seasons between 2009 (the first season after the expansion from 14 to 16 teams) and 2019 (the last season before the COVID-19 restrictions) and control for more than 30 confounding factors, which can be roughly grouped into the following categories: economic/demographic, geographic, team-related, game-related, and TV broadcasts of various leagues. Our regression analyzes show that, on average, Saturday games attract 4.9% higher attendance than Sunday games.
This result is especially important given the sharp reduction in game-day revenue (gate receipts). More specifically, the share of game-day revenue in 2018 was 15%, reductions of roughly 16% and 29% compared to 2017 and 2015, respectively (UEFA, Citation2017; UEFA, Citation2019; UEFA, Citation2020).Footnote1 For comparison, in other countries with larger aggregate revenues, the gate receipts generate a much larger share. For example, according to UEFA (Citation2020), in the Netherlands the gate receipts generate 29% of the total revenue. The corresponding number in Scotland is 43% 31% in Switzerland, and 24% in Sweden.
Thus, it is worthwhile for Norwegian soccer authorities to consider scheduling a larger share of games on Saturdays once COVID-19 restrictions end. Another possibility would be to schedule Sunday games earlier; however, given that fewer than 10% of Sunday games kick off before 18:00, we could not make a credible estimation of the effect of the earlier Sunday’s kick-off times. Nevertheless, recently the Eliteserien changed the kick-off time of Sunday games from 18:00 to 17:00, for the first time since at least 2009 (the first season in our dataset). Its statement says that: ‘It is an attempt to adapt to the audience in a positive way. This means that the supporters have time to get home in the evening, especially the away supporters, but also home supporters who travel far by car’. (From: https://www.eliteserien.no/nyheter/bli-med-a-fylle-tribunene-til-helgen).
Literature review
In the last decade, the number of studies on attendance demand in professional sports has increased dramatically. Most of these studies have used dummy variables that represent weekend games in order to control for schedule-related effects. These studies have shown that midweek games attract lower crowds in England (Buraimo, Citation2008; Buraimo & Simmons, Citation2015; Forrest & Simmons, Citation2006), Spain (Buraimo & Simmons, Citation2009), Germany (Krumer & Lechner, Citation2018; Schreyer et al., Citation2019; Schreyer & Däuper, Citation2018), the Netherlands (Besters et al., Citation2019), and Peru (Buraimo et al., Citation2018). Also, games on non-usual days have a reduced stadium attendance in England, France, Spain, Germany (Goller & Krumer, Citation2020), and Belgium (Wang et al., Citation2018). Thus, it is important to consider fans’ preferences when planning the schedule. For example, according to Goller and Krumer (Citation2020), the decision to schedule Monday games in the German Bundesliga led to large protests, causing the German Football Federation to remove such games.
However, given that weekend days are the most common soccer days in Europe, it is surprising that the weekend schedule does not get enough attention in attendance demand literature. The common practice is to add weekend days or hours as control variables while concentrating on various other topics such as uncertainty of outcome, collision with other leagues, the importance of the game, etc. A notable exception is Schreyer (Citation2019) who devoted a separate analysis to different times of all the weekdays (including midweek). He showed a significantly larger no-show behavior in late Saturday (20:30) and Sunday (19:30) games in German Bundesliga compared to Saturday games that start at 15:30 that were used as a reference group. However, Saturday games that start at 18:30 had lower no-show behavior compared to the reference group. Given that the study did not explicitly concentrate on weekends, it did not report the statistical test on differences between the weekend days. However, it seems that no-show behavior on late Sunday games was significantly larger than in any time slot of Saturday games.
On the other hand, Bond and Addesa (Citation2020) found no significant difference in sold tickets between games on different weekend times in Italian Serie A. Similarly, Paul et al. (Citation2021) showed no difference in attendance between different weekend times in the NFL. In the same spirit, Cox (Citation2018) reported that only in two out of six specifications, Sunday games attracted lower attendance than Saturday games in the English Premier League. The other four specifications showed no difference between these days. Moreover, Nielsen et al. (Citation2019) found a significantly larger attendance on Sundays compared to Saturdays in the Danish soccer top division. However, Buraimo et al. (Citation2021) found a significantly larger attendance on Saturdays than on Sundays in British horseracing competitions. Finally, Storm et al. (Citation2018) found a significant decrease in demand for early weekend games that start before 17:00 compared to early midweek games that start before 19:00 in the Danish men’s handball league. Despite the paper not reporting the appropriate statistical test, it seems that attendance did not differ significantly between early and late weekend games. As we see, there is no consistent evidence of the optimal schedule during the weekend. The reason for this could be cultural differences, differences in the number of seasonal ticket holders between the countries, or even differences in sporting environments, all of which may affect attendance habits. Thus, we shed additional light on the effect of different weekend days by using data on Norwegian Eliteserien that suffered big losses in attendance over the last decade.
It is also important to mention two studies that have investigated attendance patterns in Norwegian soccer. In the first, Solberg and Mehus (Citation2014) used surveys and found that TV broadcast had a negative effect on the willingness to attend games. In the other, Kringstad et al. (Citation2018) used data from seven seasons (2005–2011) and found that live broadcast domestic games on ‘free TV’ are positively correlated with stadium attendance, but games from the top European leagues had a negative relationship with stadium attendance in Norway. That study also showed lower attendance at midweek games than at weekend games.
Beyond the fact that we distinguish Saturday games from Sunday games, our study differs from the two above-mentioned papers in several additional dimensions. First, Solberg and Mehus (Citation2014) used questionnaires in which they asked fans of 14 out of 16 participating clubs at the end of the 2010 season about their attendance habits. The average response rate was 22.4%, which may raise questions about the representativeness of the results (Kelley et al., Citation2003). In Kringstad et al. (Citation2018), the observed period included only three seasons after the expansion of the Norwegian league from 14 to 16 teams (2009, 2010 and 2011). However, we have used 11 years of data after the expansion, which allows us to see a broader and more recent picture.Footnote2 In addition, we use close to 30 variables controlling for a variety of match days indicators that could have affected fans’ preferences, most of which were not included in Kringstad et al. (Citation2018); these include tournament incentives (whether a team has already won the title or been relegated), whether a team was promoted to the Eliteserien in the current season, the schedule of the international tournaments, the stadiums’ exact age, historical performance as measured by the ELO ranking, the distance between the cities, etc.
Description of Norwegian soccer
Norwegian soccer market
The Eliteserien was founded in 1937. It subsequently underwent a few major structural changes until it finally became a professional soccer league in 1991 (Fossøy et al., Citation2017). According to the 2018 UEFA club licensing benchmarking report (UEFA, Citation2020), Norway was one of 17 countries (out of 55 members of the UEFA) that reduced its aggregate revenue by about 5%, dropping back to the level of 2016 (€146 m). Television broadcasts generated 17% of the total revenue, while gate receipts brought only 15%, equaling €21 m in 2018, reductions of roughly 16% and 29% in local currency compared to 2017 and 2015, respectively (UEFA, Citation2017; UEFA, Citation2019).Footnote3 In Sweden, which is the closest country in terms of aggregate revenues, gate receipts generated 23% of the total revenue of €154 m in 2018.
The recent decline in the gate receipts was compensated by the increased revenue of the TV broadcast after the Eliteserien signed a new deal with Discovery in 2017. However, Norway lags far behind countries that have a lower share of TV revenues, such as the Netherlands, Scotland, Switzerland, and Sweden, in terms of the share of gate receipts. There is a risk that, in the future, TV revenues might not increase quickly enough to compensate for the decline in the gate receipt revenues. Therefore, Norwegian teams still depend on game-day revenue, and if they continue to lose spectators, they might face grave financial challenges, which will lower their chances of performing well internationally and worsen their already weak financial situation.
Description of Eliteserien
Eliteserien has a round-robin structure in which each of the 16 teams plays twice against all the other 15 teams, once at home and once away, totaling 30 games per season. Thus, the tournament consists of 30 rounds of eight games, which are usually played during a single week, although there are cases when games of some rounds are played much later than the rest of the round.
The teams that finish 15th and 16th at the end of the season are relegated to the OBOS-Ligaen, which is the second-tier league in Norway. The 14th-ranked team enters the promotion/relegation play-off against a team from OBOS-Ligaen. The champion of the season enters the UEFA Champions League qualification for the next season. The teams ranked second and third, and the winner of the domestic cup, enter the UEFA Europa League qualification.
Unlike many other leagues that use the Autumn–Spring schedule, the Norwegian Eliteserien uses a Spring–Autumn schedule because of the country’s climatic conditions. A season usually starts between week 10 and week 15 (in the annual calendar) and ends between week 45 and week 48. Seven out of 11 Eliteserien seasons had at least a two-week summer break, usually in July (for more details, see Table A1 in online appendix).
presents the distribution of games by days of the week. Most of the games take place on weekends. A typical weekend in the Eliteserien consists of between four and six games on Sunday, usually with kick-off time at 18:00, one or two games on Saturday, and a game on Monday or (rarely) Friday. In the two last seasons of the observed period, Saturdays and Mondays have an equal number of games. Sometimes, games are played on other weekdays. The reason for these midweek games is that there are not enough weekends, since the schedule must consider international breaks for national teams’ games and weather conditions. In addition, all the games in each of the last two rounds are played at the same time. These games are scheduled on Sundays at 18:00, except for the 2018 season.
Table 1. Distribution of games by days of the week (number of games).
The distribution of games on weekdays and times during the day depends largely on a TV deal that the Eliteserien had signed. Over the 11 seasons, the Eliteserien had three different TV partnerships. The first lasted from 2009 to 2012, when Lyse Energi purchased rights for five Sunday games, NRK owned the rights for one Saturday game, while TV2 bought evening games on Sundays and Mondays. However, in the 2011–2012 seasons, NRK was replaced by MAX, which broadcasted games on Saturdays, Fridays, or Thursdays. Thus, during these seasons, usually three games per round – all on different days of the week – were televised on public TV. During this period, most games had a kick-off time of 18:00 or later, with only 5–10% starting earlier on any day of the week.
The next TV deal included four seasons from 2013 to 2016. About 20% of the games in this period had a kick-off time at 15:00, and only two games per round were broadcast on public TV. Since the 2017 season, the Eliteserien TV rights have been owned by Discovery and the number of games starting at 18:00 increased to 68–78%, with almost all of the games starting at 18:00 or later.
Data and descriptive results
Eliteserien’s attendance over the years
Data on all 2640 games in Eliteserien from 2009 to 2019 were collected from various sources. The reason for the selected period is because 2009 was the first season to have 16 teams in the league, and 2019 is the last season that was not affected by COVID-2019. The main sources for the data were Transfermarkt (https://www.transfermarkt.com/tippeligaen/startseite/wettbewerb/NO1) and the Norwegian Football Association (https://www.fotball.no/).
To estimate the possible relationship between Saturday games and attendance, we used two outcome variables on the level of a single game. Taking into account the possible non-linearity in the effects on the dependent variable, our first outcome variable is a natural logarithm of attendance (e.g. Buraimo et al., Citation2018; Buraimo & Simmons, Citation2015; Krumer, Citation2020; Schreyer & Ansari, Citation2021). Log transformations are often used in skewed datasets, such as GDP or other monetary measures. This is similar to our case where some teams, such as Rosenborg, have significantly more spectators per game, whereas others, such as Ranheim, have significantly fewer. Thus, log transforming the attendance allows for making the data more normal, and with lower variability. Another technical feature is that it shows the percentage change in attendance. For example, a change of 100 spectators can be relatively large for a team with an average attendance of 1950 (Ranheim), but relatively negligible for a team such as Rosenborg with an average attendance of 15,770. Thus, a percentage change provides a more useful information in this setting.
We then defined the share of capacity by dividing the total attendance of each game by the stadium capacity of the venue where the game took place. To collect the stadium capacity and the stadium age, we went through each stadium individually, tracking the historical data on how the stadium capacity changed over the relevant seasons. Most stadiums had a detailed description on their clubs’ websites, but in some cases, the information was collected from Wikipedia or the Nordic Stadiums website (https://www.nordicstadiums.com/).
shows the average attendance for the teams that participated in the Eliteserien. In the 11 seasons between 2009 and 2019, 25 teams participated, 13 of which had an average attendance of fewer than 5000 spectators per game. Only Kristiansund had an average attendance of greater than 80% of stadium capacity, and it also had the largest share of sold-out games (17.8%).Footnote4 The overall percentage of own sold-out games in 11 years was only 4.7% per team, whereas a median team had only 3% of its games sold out.
Table 2. Average attendance per club in Eliteserien.
The teams that participated in Eliteserien, both in the 2009 and 2019 seasons, saw a 10.2–61.5% drop in their season’s average attendance, except for Strømsgodset, which had a reduction of only 0.4%. In Tables A2 and A3, which appear in the online appendix, we present detailed information on average attendance and the share of the stadium capacity of each team over the seasons. presents the development of attendance-related variables over the seasons.
Figure 1. Eliteserien average attendance, stadium capacity, and share of stadium capacity.
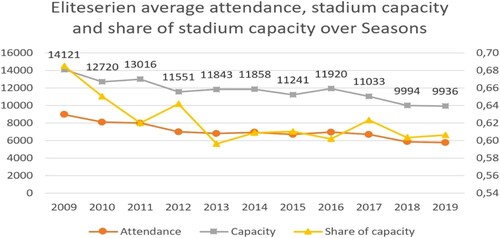
The decrease in average stadium capacity can perhaps be explained by the fact that new teams in the tournament had smaller stadiums than the teams they had replaced. For example, in 2012, Fredrikstad with a capacity of 12,169 seats, was relegated to the second-tier league. It was replaced by Sarpsborg 08, whose stadium capacity is 8022 seats. In 2017, Aalesund, with a capacity of 10,778 seats, was relegated and replaced by Ranheim, whose stadium capacity is only 3000 seats. Moreover, the average stadium capacity might have declined because some teams reduced their stadium capacities during the renovation to make the stadiums more comfortable for the audience or adapted them to the declining number of fans.Footnote5 Nevertheless, when looking at attendance as a share of a stadium’s capacity, we also see a negative trend.
Variables
One of the important procedures when measuring the effect of Saturday games on attendance is to separate the effects of other factors that are correlated both with the probability of allocating games on Saturdays and the stadium attendance. Thus, to select these factors and include them in our analysis, we followed the previous findings on the determinants of stadium attendance demand.
Over the last decade, the literature on attendance demand has grown substantially, covering such topics as broadcasting, market size, historical rivalries, etc. (Besters et al., Citation2019; Buraimo & Simmons, Citation2009; Buraimo et al., Citation2018; Kringstad et al., Citation2018; Schreyer et al., Citation2019; Solberg & Mehus, Citation2014, etc.). Based on this literature, we used approximately 30 different variables that relate to game quality measured among by others teams’ abilities, TV broadcast, scheduling, and geographical and demographic features. These variables are summarized in .
Table 3. Descriptive statistics.
The average stadium attendance of the games played on Saturday (7769) is higher than that of games played on Sunday (6754) or midweek days (7422). Similarly, the average capacity of stadiums that host Saturday games (12,210) is higher than that of Sunday games (11,329) but lower than that of midweek games (12,448). However, the average share of the capacity of Saturday games is the highest (66%), ahead of Sunday (61%) and midweek (62%). In 35 of the 2640 games in our dataset (1.3%), the share of capacity was above 1, suggesting that these games had larger crowds than the usual capacity of the stadium.
We used ELO ratings as a measure of teams’ abilities, which may play a role in attendance demand. These rankings give different weights to previous results of the teams as a function of the strength of opponents. The ELOfootball website (http://www.elofootball.com/) contains information on the ELO rating for all the Eliteserien teams in the 2009–2019 seasons. The higher the ELO rating, the higher the quality of the team.Footnote6 We also included the teams’ positions in the tournament table before the respective game – home position and away position. The first round of the season uses the final position of the previous season. The newly promoted teams have positions 14, 15, or 16 depending on their rankings in the previous season of OBOS-Ligaen. We see that teams with higher ELO home and away ratings meet each other more often on Saturdays than on other days. Similarly, teams’ table rankings are lowest on Saturdays, suggesting that Saturdays’ games are associated with teams of higher ability.
In order to consider weather conditions during the games, we included the air temperature and (air temperature – 14)2 variables.Footnote7 The latter variable tries to capture the non-linear effect of the air temperature different from 14 degrees Celsius, as suggested by Hoffmann et al. (Citation2002). We also used the distance between the home and away team’s stadiums, measured in kilometers, since the closer the teams are to each other, the easier it is for away fans to travel to the game venue. We took the distance of the shortest possible route between the stadiums, according to Google Maps. The descriptive statistics also show that the average distance between the stadiums is higher on Sundays (623 km) than on Saturdays (465 km) and midweek games (563 km). We also used stadium age and its squared term to account for the possible attractiveness of the stadium’s facilities.
Importantly, more than half of the 666 games played in midweek were televised on public TV (56%). This number is much lower for Saturdays (24%) and Sundays (17%). By contrast, almost 72% of the games played on Sundays and 64% of games played on Saturdays were played at the same time as games from the English Premier League (EPL), which were streamed live on Norwegian TV. Only 25% of games coincided with the EPL games during midweek days.
We also used the list of rivalry games from Wikipedia to define a derby in our dataset.Footnote8 In sum, 13 different derby types composed 176 games in 11 seasons (for the full list, see Table A4 in online appendix). The share of derby games is twice as large on Saturdays than on any other day of the week. In addition, following Kringstad et al. (Citation2018), we took into account the away games of Rosenborg, which may attract a larger crowd because that has been the most successful Norwegian team in recent decades, with 21 championship titles in the last 30 years.
Finally, it is important to note that every year games take place on May 16, one day before Constitution Day, which is a public holiday. These games traditionally attract large crowds; the average attendance of games on May 16 is 10,966, compared to an average of 6948 on other dates in our sample. Thus, following Kringstad et al. (Citation2018) we code a dummy variable for games that take place on this date.Footnote9
Empirical strategy
When estimating the relationship between Saturday games and stadium attendance, we need to acknowledge that the allocation of games on different days is not random. It depends on many factors, such as weather, the timetable of the European Cups, national team tournaments, etc. Moreover, the descriptive analysis illustrated that games played on different weekdays also varies in different characteristics such as the quality of the participating teams, kick-off times, and stadium capacity. These factors are likely to correlate with both game allocation and stadium attendance. This means that a simple comparison of average attendances on different weekdays could potentially lead to biased estimates. Thus, we needed to control for these deviations from random selection into treatment (that is, Saturday games).
The rich database presented in the previous section enabled us to opt for a selection-on-observables approach; that is, controlling for the reasons for the deviations from a random assignment into Saturday games. Thus, the most basic specifications take the following forms:
(1)
(1)
(2)
(2) Our main goal was to estimate
in both regressions while controlling for stadium capacity and other potential confounding factors X discussed in the description analysis. We also controlled for different time-specific effects that could have occurred in the observed period by including seasonal dummies as well as kick-off time (KOT) dummies. Furthermore, to account for possible seasonality within a season, such as school holidays, we included calendar week dummies.
We included the Ln of stadium capacity in equation (2) because it is positively and significantly correlated with the Saturday games (p = .053 in the univariate regression of Saturday on Ln of capacity). This means that if
is also correlated with the share of capacity, then we must include it into estimation; otherwise, we would end up with the omitted variable bias. In addition, the double-LASSO procedure presented in Krumer and Lechner (Citation2018) selected
as one of the variables for estimating the share of capacity in Bundesliga games.
It is also important to note that since the size of attendance is defined as the total number of one-game tickets sold plus all seasonal tickets, the attendance values are likely to be upward-biased and the real attendance is probably lower. As evidence, Solberg and Mehus (Citation2014) reported that season ticket holders in Norway seem to miss an average of three out of 15 home matches. However, this is not a problem as long as fans with tickets have a tendency to miss a game less frequently on Saturday than on other days. Schreyer and Däuper (Citation2018) found that no-show behavior increases on midweek games in Bundesliga. Assuming a similar behavior in Norway, our main assumption here is that the no-show behavior is not higher on Saturday than on Sunday games.
Finally, it is important to note the possibility of capacity constraints, which have methodological consequences. For example, the existence of capacity constraints in leagues that are always in high demand, such as the EPL, is an issue, which may require the use of the Tobit estimator (Forrest et al., Citation2005). For example, Jane (Citation2016) investigated NBA games where sellouts accounted for about 47% of the sample. However, this is less of a problem in the Norwegian league given the very limited number of sold-out games, as can be seen in (fewer than 5% of the games in our dataset).
Results
demonstrates the results of estimating model (1). We find a significantly larger attendance in games that take place on Saturdays compared to other days. After controlling for a variety of potential confounding variables, that include things like teams’ strengths, local derbies, TV broadcasts, and others, the results in Column 1 show that the Saturday games attract, on average, 4.4% larger attendance than other days. This result is statistically significant at the 1% level. Given that the average attendance in the sample is 7080 (see Table A2), our finding suggests that a Saturday game attracts an average of about 311 more fans. To put this result into perspective, assuming that the average yield per spectator in Norway is €20 per game, a team loses on average €75,000 per season for 12 games that do not take place on Saturday (assuming that three home games per season can be played on other days). This sum can be an excellent addition to youth academy, for example. Column 2 shows the results of the same analysis, but without midweek games. In other words, this analysis explicitly compares between Saturdays and Sundays. We find that Saturday games attract a 4.9% higher audience than Sunday games, on average.
Table 4. OLS estimates for Ln(Attendance) as an outcome variable.
It is also worth mentioning some other results from the analyzes presented in . For example, Rosenborg’s away games attract 14.5–16.5% larger attendance. Also, derby games and games that take place on May 16 attract about a 25% larger audience. Interestingly, games that are broadcast on public TV are associated with a larger audience. In addition, games that take place in parallel with games in the EPL that are broadcast on Norwegian TV are likely to attract lower stadium attendance. All of these results are in line with the previous findings of Kringstad et al. (Citation2018), who also showed that the total population of a city is positively and significantly associated with attendance. We found a similar result for the whole sample. However, it was not significant for the subsample without midweek days.
In addition, home teams attract a 9.3% larger attendance before the games in the European competitions. This may be related to the greater support the fans wish to give their teams before important games. However, we find no such relationship after the European games. Interestingly, newly promoted teams attract a higher audience in their home games, but not in the away games. The same pattern is observed among teams that have secured the title.
We see a similar picture in , where the outcome variable is attendance as the share of the stadium’s capacity. More specifically, we find that games that take place on Saturday have a 2.3 percentage points higher capacity than the other days (Column 1). When only comparing Saturdays and Sundays (Column 2), the former has, on average, a 2.6 percentage points larger share of capacity. Both results are statistically significant at the 1% level. As previously, games that take place in parallel with the English Premier League that are broadcast on Norwegian TV have an average of 1.8–3.6 percentage points lower share of capacity. It is also worth mentioning that games that took place during the FIFA World Cup or the UEFA European Championship had a 3.2 percentage points lower share of capacity.Footnote10
Table 5. OLS estimates for share of capacity as an outcome variable.
Overall, both approaches indicate that games on Saturdays attract larger attendance. One possible explanation is that more than 90% of Sunday games start after 18:00, which is relatively late because the following day (Monday) is a working day. This explanation is in line with Krumer (Citation2020) and Schreyer (Citation2019), who showed that late kick-off time on Thursdays and Sundays, respectively, attracts a lower attendance. As evidence, in October 2021, the Eliteserien changed the kick-off time of Sunday games from 18:00 to 17:00, implicitly admitting that 18:00 on Sunday is not a convenient time for the fans.
Conclusion
This paper was motivated by interaction between previous literature on the effect of schedule on attendance and the late kick-off time of Sunday games in the Eliteserien, the top male Norwegian soccer league. Using data from 11 seasons, and taking into account various confounding factors, we find that Saturday games attract a 4.9% larger audience and are associated with a 2.6 percentage points higher share of capacity compared to Sunday games.
This result is important for a small league like the Eliteserien because, despite some recent increases in TV broadcasting income, this source of revenue has a limit, which may not compensate for ongoing negative trend in Elitserien’s attendance. In addition, Norway is far behind other comparable countries in terms of gate receipt revenues. It is also possible that, along with the increased revenues, a larger stadium attendance may bring more sponsorships and lead to better TV broadcast contracts in the future.
Beyond the possible immediate financial benefit of the teams from the move to Saturdays, it is important to note that higher attendance of young fans is especially important, since these fans have a long-run perspective on teams’ support. Thus, the move to Saturday games avoids the obstacle that is driven by attending school early the next morning. In addition, such a move may benefit soccer players who can spend more time with their families on Sundays. The recent example of American gymnast Simone Biles during the Tokyo 2020 Olympic Games highlighted the importance of mental health in professional sports. Thus, spending more time with families may increase players’ welfare.
Finally, from a broader perspective, local businesses like restaurants may benefit from larger crowds after a game on Saturday compared to Sunday because the following day is not generally a working day. However, it is less likely that people spend an evening in a restaurant on a Sunday evening after 20:00 because Monday is a traditional working day. Therefore, we call on the relevant stakeholders such as the Eliteserien authorities and the broadcaster to consider increasing the number of Saturday games.
Supplemental Material
Download PDF (233.2 KB)Acknowledgment
We would like to thank Kjetil K. Haugen, Hallgeir Gammelsæter, Vetle Smith, Kjell M. Herskedal, and Erling Knudtzon for helpful comments. The usual disclaimer applies.
Disclosure statement
No potential conflict of interest was reported by the author(s).
Notes
1 According to UEFA (Citation2020), the breakdown of aggregate revenue is as follows: domestic TV, 17%; gate receipts, 15%; revenue from UEFA, 12%; sponsorship/commercial, 41%; and ‘other’, 15%.
2 Approximately 80% of the papers featured in the recent review by Schreyer and Ansari (Citation2021) on attendance demand explored data from a maximum of five years/seasons, with 43% of these papers only exploring data from one year/season.
3 The exchange rates applied are: 1 NOK = €0.104 (UEFA, Citation2020); 1 NOK = €0.107 (UEFA, Citation2019); 1 NOK = €0.112 (UEFA, Citation2017).
4 Games with share of capacity above 95%.
5 For example, two teams drastically decreased their stadium capacities by moving to another stadium. Stabæk moved from Telenor arena (15,000 capacity) to Nadderud arena (7000 capacity) at the beginning of 2012 season. Similarly, Vålerenga changed its stadium during the 2017 season and moved from Ullevaal stadium (27,200 capacity) to Inility arena (17,333 capacity).
6 See Hvattum and Arntzen (Citation2010) for additional details on ELO ratings in soccer.
7 The data were obtained from https://seklima.met.no/observations/. No air temperature data was available for seven games.
9 For additional details on data and descriptive results, see Ermakov (Citation2020).
10 Given that the share of capacity has an upper bound, we also estimate model (2) with a Tobit estimator. These regressions yield very similar coefficients. In addition, given that ELO ratings and league positions correlate between each other, we performed similar analyses excluding ELO ratings, and separately excluding league positions. Again, these regressions yield very similar coefficients, however all ELO and league standings became significant. The results of these regressions are available upon request.
References
- Besters, L. M., van Ours, J. C., & van Tuijl, M. A. (2019). How outcome uncertainty, loss aversion and team quality affect stadium attendance in Dutch professional football. Journal of Economic Psychology, 72, 117–127. https://doi.org/10.1016/j.joep.2019.03.002
- Bond, A. J., & Addesa, F. (2020). Competitive intensity, fans’ expectations, and match-day tickets sold in the Italian football Serie A, 2012-2015. Journal of Sports Economics, 21(1), 20–43. https://doi.org/10.1177/1527002519864617
- Buraimo, B. (2008). Stadium attendance and television audience demand in English league football. Managerial and Decision Economics, 29(6), 513–523. https://doi.org/10.1002/mde.1421
- Buraimo, B., Coster, N., & Forrest, D. (2021). Spectator demand for the sport of kings. Applied Economics, 53(51), 5883–5897. https://doi.org/10.1080/00036846.2021.1931010
- Buraimo, B., & Simmons, R. (2009). A tale of two audiences: Spectators, television viewers and outcome uncertainty in Spanish football. Journal of Economics and Business, 61(4), 326–338. https://doi.org/10.1016/j.jeconbus.2008.10.002
- Buraimo, B., & Simmons, R. (2015). Uncertainty of outcome or star quality? Television audience demand for English Premier League Football. International Journal of the Economics of Business, 22(3), 449–469.
- Buraimo, B., Tena, J. D., & de la Piedra, J. D. (2018). Attendance demand in a developing football market: The case of the Peruvian first division. European Sport Management Quarterly, 18(5), 671–686. https://doi.org/10.1080/16184742.2018.1481446
- Cox, A. (2018). Spectator demand, uncertainty of results, and public interest: Evidence from the English Premier league. Journal of Sports Economics, 19(1), 3–30. https://doi.org/10.1177/1527002515619655
- Ermakov, S. (2020). The effect of Saturday matches on stadium attendance in Norwegian Eliteserien [Master’s thesis]. Høgskolen i Molde-Vitenskapelig høgskole i logistikk.
- Forrest, D., & Simmons, R. (2006). New issues in attendance demand the case of the English Football League. Journal of Sports Economics, 7(3), 247–266. https://doi.org/10.1177/1527002504273392
- Forrest, D., Simmons, R., & Buraimo, B. (2005). Outcome uncertainty and the couch potato audience. Scottish Journal of Political Economy, 52(4), 641–661. https://doi.org/10.1111/j.1467-9485.2005.00360.x
- Fossøy, J., Moe, V. F., & Fretland, F. (2017). Fotball og media i Noreg i eit historisk perspektiv i perioden 1970–2005–spelet utan ball. I: Andersen, JR, Bjørhusdal, E., Nesse, JG, Årethun, T.(red.)(2017). Immateriell kapital-Fjordantologien, 2017, 341–361. https://doi.org/10.18261/9788215028163-2017-18
- Goller, D., & Krumer, A. (2020). Let’s meet as usual: Do games played on non-frequent days differ? Evidence from top European soccer leagues. European Journal of Operational Research, 286(2), 740–754. https://doi.org/10.1016/j.ejor.2020.03.062
- Hoffmann, R., Ging, L. C., & Ramasamy, B. (2002). The socio-economic determinants of international soccer performance. Journal of Applied Economics, 5(2), 253–272. https://doi.org/10.1080/15140326.2002.12040579
- Hvattum, L. M., & Arntzen, H. (2010). Using ELO ratings for match result prediction in association football. International Journal of Forecasting, 26(3), 460–470. https://doi.org/10.1016/j.ijforecast.2009.10.002
- Jane, W. J. (2016). The effect of star quality on attendance demand: The case of the National Basketball Association. Journal of Sports Economics, 17(4), 396–417. https://doi.org/10.1177/1527002514530405
- Kelley, K., Clark, B., Brown, V., & Sitzia, J. (2003). Good practice in the conduct and reporting of survey research. International Journal for Quality in Health Care, 15(3), 261–266. https://doi.org/10.1093/intqhc/mzg031
- Kringstad, M., Solberg, H. A., & Jakobsen, T. G. (2018). Does live broadcasting reduce stadium attendance? The case of Norwegian football. Sport, Business and Management: An International Journal, 8(1), 67–81. https://doi.org/10.1108/SBM-11-2016-0071
- Krumer, A. (2020). Testing the effect of kick-off time in the UEFA Europa League. European Sport Management Quarterly, 20(2), 225–238. https://doi.org/10.1080/16184742.2019.1598456
- Krumer, A., & Lechner, M. (2018). Midweek effect on soccer performance: Evidence from the German Bundesliga. Economic Inquiry, 56(1), 193–207. https://doi.org/10.1111/ecin.12465
- Nielsen, C. G., Storm, R. K., & Jakobsen, T. G. (2019). The impact of English Premier League broadcasts on Danish spectator demand: A small league perspective. Journal of Business Economics, 89(6), 633–653. https://doi.org/10.1007/s11573-019-00932-7
- Paul, R. J., Ehrlich, J. A., & Losak, J. (2021). Expanding upon the weather: Cloud cover and barometric pressure as determinants of attendance for NFL games. Managerial Finance, 47(6), 749–759. https://doi.org/10.1108/MF-06-2020-0295
- Schreyer, D. (2019). Football spectator no-show behaviour in the German Bundesliga. Applied Economics, 51(45), 4882–4901. https://doi.org/10.1080/00036846.2019.1602709
- Schreyer, D., & Ansari, P. (2021). Stadium attendance demand research: A scoping review. Journal of Sports Economics. https://doi.org/10.1177/15270025211000404
- Schreyer, D., & Däuper, D. (2018). Determinants of spectator no-show behaviour: First empirical evidence from the German Bundesliga. Applied Economics Letters, 25(21), 1475–1480. https://doi.org/10.1080/13504851.2018.1430314
- Schreyer, D., Schmidt, S. L., & Torgler, B. (2019). Football spectator no-show behavior. Journal of Sports Economics, 20(4), 580–602. https://doi.org/10.1177/1527002518784120
- Solberg, H. A., & Mehus, I. (2014). The challenge of attracting football fans to stadia? International Journal of Sport Finance, 9(1), 3–19.
- Storm, R. K., Nielsen, C. G., & Jakobsen, T. G. (2018). The complex challenge of spectator demand: Attendance drivers in the Danish men’s handball league. European Sport Management Quarterly, 18(5), 652–670. https://doi.org/10.1080/16184742.2018.1470195
- UEFA. (2017). The European club footballing landscape. Club licensing benchmarking report. Financial year 2015.
- UEFA. (2019). The European club footballing landscape. Club licensing benchmarking report. Financial year 2017.
- UEFA. (2020). The European club footballing landscape. Club licensing benchmarking report. Financial year 2018.
- Wang, C., Goossens, D., & Vandebroek, M. (2018). The impact of the soccer schedule on TV viewership and stadium attendance: Evidence from the Belgian Pro League. Journal of Sports Economics, 19(1), 82–112. https://doi.org/10.1177/1527002515612875