
 ?Mathematical formulae have been encoded as MathML and are displayed in this HTML version using MathJax in order to improve their display. Uncheck the box to turn MathJax off. This feature requires Javascript. Click on a formula to zoom.
ABSTRACT
Research Question
We consider how elite European football clubs use available and measurable performance data to value personnel by focussing on the goalkeeper labour market. We test the determinants of goalkeeper pay and discuss if football clubs effectively separate goalkeeper performances from outfield players.
Research Methods
Matching an exclusive salary dataset with rich performance measures, we estimate a Mincer-type salary model for a sample of 260 goalkeepers from five European football leagues (Premier League, Ligue 1, Bundesliga 1, Serie A and La Liga). Our dataset covers seven seasons from 2013/14 to 2019/20.
Results and Findings
We find that clubs use primitive defensive statistics to determine goalkeeper pay. Goalkeepers are paid based on co-production and team outcomes rather than individual workload. Also features of goalkeeper ball distribution positively affect salary - this indicates the importance of goalkeepers to initiating offensive moves.
Implications
Our evidence suggests that decision-makers within clubs are not optimally decoupling individual performance from team qualities. As such, clubs could improve how they value a key team member. Identifying the failure to use advanced statistics is especially important as forming contracts in this setting is costly.
KEYWORDS:
Introduction
Which workers should be paid the most within an organisation? This seems like an easy question to answer: organisations should pay their most valuable workers the highest wages. Of course, this answer depends on the ability of decision-makers to identify the most valuable characteristics of employees. In many industries, this is a difficult question to answer as detailed productivity measures are challenging to acquire, so much so, empirical testing is not tractable. This has led to a classic assumption in standard economic models – workers are paid what they were worth through their marginal revenue product.
The capacity of the professional sports industry in facilitating empirical tests of labour market theories is now well-established. Yet, despite the availability of data that makes the labour market amenable to analysis, unravelling which employee contributions are valuable still remains a challenging task. This is because – and analogous to most work environments – sport entails multi-worker production (Allen, Citation2021). The recurring problem is that not all sports statistics truly separate a player from their team. For some sports positions, such as hitters in baseball, this separation is more straightforward, but for invasive and interactive field sports such as football this represents a greater challenge given the fluidity of play.
This study is concerned with goalkeepers in the elite football leagues in Europe and focusses on the role in football where it is most possible to demarcate individual from group performance. While many studies have considered the determinants of footballer salaries (see Simmons, Citation2022 for a recent summary), our work addresses a gap in the literature by offering a dedicated analysis of the goalkeeping position only. We match a new dataset on goalkeeper pay with a battery of performance measures that vary in sophistication.
The market for goalkeepers is deserving of dedicated analysis given the unique characteristics of the role. First, goalkeepers hold the most clearly defined role in football and have separate skill requirements that are not shared by teammates such as aerial reaching, ball handling/punching and shot stopping. Distinctive aerobatic skills of goalkeepers make it difficult to compare them with outfield players. In addition, goalkeepers are heavier, taller and typically hold a different stature to outfield players (Mala et al., Citation2015). For these reasons, they are often excluded from regression analysis of footballers’ pay (Carrieri et al., Citation2018) and are omitted from valuation studies (Coates & Parshakov, Citation2022; Müller et al., Citation2017).
Second, there is evidence that goalkeepers incur a positional salary penalty relative to outfield players (Deutscher & Büschemann, Citation2016; Frick, Citation2007). In general, goalkeepers are salary penalised relative to defenders, defenders are salary penalised compared to midfielders and midfielders are salary penalised with respect to forwards. This is a finding corroborated in a variety of European and non-European football labour markets, and is robust to considering salary for all goalkeepers in a league and starting goalkeepers only (Butler & Coates, Citation2022). Not only, are the skill requirements of the role unique, but the evidence suggests that this position is not valued as highly as others in labour market. One caveat to this however, it that a salary penalty could be recompensed by virtue of the longer careers that goalkeepers tend to have.
Third, intuition would suggest that elite football clubs find appraising goalkeepers a challenging task. Recruiters tend not to invest equivalent transfer fees on goalkeepers relative to other positions.Footnote1 This lower valuation is also borne out in estimated transfers fees paid for players. Assessing Transfermarkt.co.uk data for the top 50 highest (nominal) transfer fees paid by position, goalkeepers, on average, only commanded compensation of £19.36 m (median £15.98) for the selling club. This is compared to average estimated transfer fees of £42.32 m, £47.98 m and £72.63 m for defensive, midfield and forward positions respectively. Yet if one subscribes to a relatively undisputed view that first-rate goalkeepers are critical to team success, it seems paradoxical that fewer financial resources are dedicated to the position.
It is understandable that decision-makers focus on goals when evaluating goalkeeper performance. Goals conceded are salient and are more easily recalled. However, as we will discuss, making judgements on goals conceded is problematic. But decision-makers within clubs should be able to account for the dynamic nature of the sport and separate the player from their teammates. This has become possible with an array of advanced statistical performance metrics fully available. In other words, we might expect goalkeepers to not be rewarded (or penalised) based on the quality of the defence in front of them. We wish to see how well those who determine goalkeeper pay (e.g. club executives) understand how to separate the goalkeeper performance from their teammate.
Labour market valuations
Although the classic Moneyball (Lewis, Citation2004) story may not have been correct (Holmes et al., Citation2018), many studies have since considered the accuracy of decision-making and objective approaches to the evaluation of talent in a variety of sports settings (Berri et al., Citation2007; Berri et al., Citation2011; Berri & Brook, Citation2010; Massey & Thaler, Citation2013). The literature evaluating productivity and output has now become niche and specific topics within sports attract attention. For example, a recent branch of the literature evaluates injuries impact on labour productivity (Carrieri et al., Citation2020; Gregory-Smith, Citation2021; Hoey, Citation2021).
Solely in the context of football, there are two general literatures considering valuation. The first concerns the value of human capital to the club retaining the services of player - various studies have modelled transfer estimates and fees paid, often appealing to the approximations published on Transfermarkt.co.uk (e.g. Coates & Parshakov, Citation2022). The second line of valuation research concerns the salaries individual players can command, focussing on the determinants of pay (Lucifora & Simmons, Citation2003). Although, these branches clearly intersect, our contribution is positioned within the salary determination literature.
Given the fluid and interactive aspect of association football, sharply identifying a mis-valuation in the labour market for footballers is difficult to achieve (Gerrard, Citation2007). The increasing availability of larger and more precise datasets however is making this question more amenable to analysis. Recently, Weimar and Wicker (Citation2017) measured run frequencies and intensity, finding that effort-related traits can be undervalued in professional soccer. Most recently, Zaytseva and Shaposhnikov (Citation2022) argue that defensive actions are relatively underestimated by the market.
Researchers have recently turned to machine learning techniques to consider the determinants of goalkeeper market value. Contrasting our salary data, these approaches are premised on valuations from online estimate websites and simulations. Behravan and Razavi (Citation2021) use EA sports FIFA20 players valuations and find that general goalkeeper skills such as player weight, reflexes, ball control, handling and speed were important to value. Singh and Lamba (Citation2019) assess FIFA18 valuations, Fantasy Sports data and Transfermarkt.co.uk estimates. While the work only presents the selected variables, they find that clean sheets/shutouts (games with zero goals conceded) represent a significant predictor of goalkeeper value.
Measuring goalkeeper performance
Top division football teams in Europe typically have a roster size of around 25 players, where this list excludes players under 21 years old. There will usually be three goalkeepers comprising one recognised starter and two backup players. In the event of a spate of goalkeeper injuries the team might hire a goalkeeper from another team on emergency loan.
Selection of goalkeepers for first team games is the responsibility of the head coach/manager, who is rarely a former goalkeeper (Bryson et al., Citation2021). The group of team goalkeepers will receive specific training from a specialist goalkeeping coach who will relay performances observed in training to the head coach to aid selection. In addition, the team may hire sports analysts to monitor on-field performance for all players, including goalkeepers (Herberger & Litke, Citation2021). The size of the sports analytics department will tend to be greater for elite teams that qualify for UEFA tournaments (Champions League and Europa League). Small teams with low budgets may not be in a position to hire any sports analysts at all.
Basic goal prevention measures
We propose four basic metrics of goalkeepers’ defensive performance where the objective is primarily goal prevention. The first is Goalkeeper rating provided by www.whoscored.com This Goalkeeper rating is produced by algorithm rather than subjective evaluation. The metric has a starting baseline of six on a one to ten scale. Although it is possible for scores below six to be registered for extremely bad goalkeeper performances, the algorithm adds small increments for performance attributes in each game and then produces a seasonal average which we adopt. These include man of the match performances, goals conceded (total and per game), clean sheets, saves per game and a measure of ‘good claims per game’. We predict that an increase in Goalkeeper rating will be associated with higher pay. While Whoscored ratings are a respected evaluatory tool in football, a difficulty with this measure is that we do not know the algorithm or weighting applied to particular components of goalkeeper performance.
Our second metric is shots faced. On average, goalkeepers in our sample face four shots on target in a game. This is a small number and reflects the nature of football as a low-scoring sport with few shooting opportunities for a given team. One hypothesis is that an increase in the number of shots on target faced is associated with higher pay to reflect the extra effort and workload required to stop more shots that could potentially score goals. We define Shots faced as shots on target per 90 min playing time for a given goalkeeper-season.
Third, we consider the obvious measure of goals conceded (Goals against). Detailing the top 10 goalkeepers in the world, Lane (Citation2021) noted how many games without any goals conceded that a goalkeeper accumulated – there is a clear appeal to this statistic given its simplicity and limitation. Goals conceded does have the advantage of attributing goals conceded to goalkeepers who are actually on the pitch, however, goals conceded are a function of two variables: how many shots an opponent takes and how often those goals find the net. A goalkeeper should be able to impact the latter through shot stopping skill. A goalkeeper has very little impact on shots taken by opposing forwards. Shots taken is primarily a function of how well a defence performs in front of the goalkeeper. Thus, evaluating clean sheets in contract formation would clearly be a crude strategy for clubs to adopt.
Since there are few shooting opportunities for each team in a top division game, saving shots ought to be valuable to teams. Thus, our fourth basic measure is based on evaluating the Saves per shot ratio. This is a more direct method of performance analysis and takes precedence in past works assessing goalkeeper performance in other sports (Berri & Brook, Citation2010, on National Hockey League). Saves per shot at least considers a goalkeeper’s performance relatively. However, one faces a similar challenge as for Goals against. A bias will exist with goalkeepers performing in weak teams likely having to face more shots. Gelade (Citation2014) observes that goalkeepers in weaker teams tend to face shots that are more difficult to save. The ability of these goalkeepers would likely be underestimated. Hence, Saves per shot should be adjusted for shot difficulty or likelihood of a given shot actually scoring a goal. But, until recently, little was known about the nature of shot attempts on goal (precision, power and location of shot, etc.).
Tactical advances and offensive functions
While the four measures above focus on the goalkeeper’s primary defensive function, goalkeeping has become associated with other performance indicators as the sport has evolved tactically. In the twenty-first century, modern professional football has become more possession-based and has facilitated the arrival of less physical and more technical players. Rule changes, in particular the back-pass rule, forced goalkeepers to become more comfortable with the ball at their feet and incentivised new styles of play (Cox, Citation2017). As both Cox (Citation2017) and Wilson (Citation2018) document, there is now a greater emphasis on shorter passing than previously.Footnote2 The current exemplar of this practice, termed ‘playing out from the back’, is Manchester City’s successful head coach, Pep Guardiola, who previously applied the short passing, possession-based strategy in spells at Barcelona and Bayern Munich. Indeed, Guardiola is often heralded as leading the ‘tiki-taka’ revolution, when at Barcelona.
Distribution skills (e.g. direct and accurate passing/throwing) and possession retention appear to be increasingly important for goalkeepers (Otte et al., Citation2022; Peracek et al., Citation2017). Within this framework, goalkeepers now have an important role in starting attacking moves via short passes to teammates rather than a speculative punt upfield
This logic is supported by sports science. Foot control is the second most frequent technique carried out by a goalkeeper (after shot stopping) and is an important precursor to ball distribution which starts an attack (West, Citation2018). Liu et al. (Citation2015) statistically document the range of La Liga goalkeepers technical and tactical roles, showing that goalkeepers now have an important offensive function. From Whoscored.com we use a measure of Pass success, the percentage of attempted passes that reach a teammate, as an indicator of goalkeeper contribution to outfield play. We predict that greater Pass success will be associated with higher goalkeeper salary as foot control/skills have become increasingly important in establishing offensive moves.
Post-shot expected goals
Recently, advanced statistics have emerged to offer improved goalkeeper evaluation methods. This is largely by virtue of the abundance of shots now recorded. The most notable is the post-shot expected goals (PSxG) statistic. This is an ex-post assessment that considers the number of goals each goalkeeper would have been expected to concede based on the type of shots taken and by predicting the ball’s ultimate destination. The important addition to the standard xG model developed for outfield players is the use of additional information present in the environment after a shot is taken. For example, data are incorporated on defensive structures and a shot’s trajectory and velocity. With these additional data, it is possible to predict the direction of the ball, the probability of a goal and the difficulty of saving a shot.
PSxG is estimated by football analytics firms using advanced modelling techniques (machine learning algorithms - extreme gradient boosting) using only saved and scored shots. It is beneficial in evaluating performance as it can be benchmarked against actual goals conceded. The calibration of PSxG involves the use of freeze frame technology that documents a goalkeeper’s stance/movement and position for each shot they face. Additionally, freeze frame analysis identifies the position of defenders allowing the probability of a goal to be scaled based on the pressure applied to attackers.
We use two variables that incorporate PSxG. The first is Post-shot expected goals per shot. This is an indicator of difficulty of shots faced and reflects a goalkeeper’s workload. The second measure is Saves minus post-shot expected goals per shot. This adjusts the earlier saves per shot metric for difficulty of shots faced. Competing hypotheses are possible using this measure. A higher value of the saves per shot measure for a given PSxG value could result in greater pay as the saves are adjusted for shot difficulty (Gelade, Citation2014). A positive coefficient on Saves minus post-shot expected goals per shot would support this hypothesis. Alternatively, for a given number of saves made by a goalkeeper, a larger value of PSxG per shot suggests that a goalkeeper faces more difficult shots and so might be rewarded for this effort with higher pay. A negative coefficient on Saves minus post-shot expected goals per shot would support this hypothesis.
Auxiliary performance traits
Finally, we consider supplementary aspects of performance. Our data source (DSG/StatsBomb via FBref.com) offers a distinction between a pass and a launch. A launch occurs when the ball is kicked over 40 yards (from a goalkeeper’s own half) toward a general pitch zone rather than to a specific teammate. The difference between a pass and a launch is the intention to accurately transfer the ball to teammate. The primary objective is the removal of the ball from the current position and maintaining possession is secondary. The launch is also differentiated from a chipped or long pass at the time of coding by an assessment of the technique used by the goalkeeper to kick the ball. In particular, launches are characterised by wilder swings to connect with the ball. We consider percentage of long passes (over 40 yards) that are completed (Pass40ratio) as an indicator of pass accuracy, percentage of goal kicks that are launched (% goalkicks launched) and percentage of passes that are launched (Launch pass rate). We also use Average pass length.
We also assess ‘sweeper’ characteristics that capture goalkeeper anticipation/awareness and perception skills. These actions occur when a goalkeeper anticipates a dangerous scenario developing and swiftly enters a race with an opposition player to intercept the ball. This ability to selectively rush out is also important to intercept the ball and start counter-attacking moves. These scenarios are coded when two criteria are generally met. First, a goalkeeper leaves their goal line, to at least the edge of their penalty area, to either intercept a pass or close down an attacking player. Second, there must be pressure from the opposing team to reach the ball. The action then follows. For example, goalkeepers might make a clearance, a save or lose a challenge if they are beaten to the ball by an attacking player. If they miss the ball completely their actions are recorded as an ‘error’. We utilise number of Actions outside penalty area and Average sweep as average distance of goalkeeper actions outside the penalty area from the goal-line.
Data and empirical model
The salary measure was obtained by purchase from www.capology.com and comprises pre-tax basic pay figures, excluding performance and signing bonuses.Footnote3 The data come from a survey of player agents and journalists carried out by website analysts and cover the top five European football leagues (English Premier League, France Ligue 1, German Bundesliga, Italy Serie A and Spain La Liga). The salary data were available from seven seasons from 2013/2014 to 2019/2020 and the census point is the beginning of the season.Footnote4
For the Italian Serie A sub-sample, we see that the salary data correspond precisely to values published by the newspaper Gazzetta dello Sport and used by Carrieri et al. (Citation2018) and Őzdemir et al. (Citation2022) in their studies of footballer pay. This gives us confidence in the credibility of the salary data. We regard these salary data as superior to proxy values estimated by journalists (Kicker magazine in Germany, see Deutscher & Büschemann, Citation2016) or by an online community (see Prockl & Frick, Citation2018) simply because they are direct salaries from parties actively involved in player contract negotiations. However, the data do not define whether the salary awarded is a consequence of pre-negotiated unilateral or reciprocal extension clauses.
The salary data were matched with performance data from Whoscored.com and Data Sports Group(DSG)/Statsbomb (that are accessible publicly via FBref.com). We apply a filter of 450 min of game time (equivalent to five full games) to rule out meaningless performances. shows descriptive data for goalkeeper salaries in our sample of 260 players with 739 total observations.
Table 1. Descriptive statistics for Wage and Ln(Wage).
The basic performance measures pertaining to goalkeepers are as published by Whoscored and described above: Goalkeeper rating, Shots faced, Saves per shot, Goals against defined as goals conceded per 90 min of game time and Pass success. These individual performance measures are high-quality OPTA sports data as recorded by Stats Perform. The measures are available from seasons 2012/2013 to 2018/2019. We supplement our basic performance indicators with more detailed metrics available from DSG and StatsBomb. To our knowledge, all of these data, and measures derived from them, are founded on high-quality OPTA data. reports descriptive statistics for performance measures and time-varying control variables.
Table 2. Descriptive statistics for goalkeeper performance and continuous control variables.
We estimate a Mincer-type salary model for our sample of goalkeepers. This is specified as:
(1)
(1) Performance is the set of measures identified above. X is a vector of control variables. These include player age, age squared, career appearances in top five European leagues, UEFA competitions, other leagues and national team, assessed up to season t-1, minutes played in previous season and a dummy variable, Transfer to indicate whether a player was transferred for a fee between teams across seasons.
If a player has completed his contract, they can move to another club as a free agent without a fee being incurred. We label this case by a dummy variable, Free. Also, a player can be loaned to another club while still under contract at his parent club. This termed Loan as another dummy variable. Finally, a player under contract at a club can have his registration transferred to another club conditional on the new club paying a negotiated transfer fee to the original clubs.Footnote5 This is represented by the dummy variable, Transfer.
From our sample of 739, we have 154 observations where goalkeepers changed teams. Out of this, Free comprised 46, Loan made up 37 and Transfer had 71. In our preliminary estimation, we included all three dummy variables as potential predictors of salary. Only Transfer was significant, so this is retained for our main analysis.
Natural log of attendance is a proxy for team ability to pay, where we predict that teams with larger attendances will hire players with greater salaries. We acknowledge that some teams have low attendances yet high ability to pay through revenue generation. Examples are Bournemouth in England and AS Monaco in France. An alternative measure of ability to pay is Log revenue. Total revenue figures, before transfers, were obtained from Prof. Bernd Frick of University of Paderborn for seasons 2013/2014 to 2018/2019. German teams are excluded as they are predominantly member-owned and do not report balance sheets. We comment below on estimation with Log revenue included, for a smaller sample size of 507.
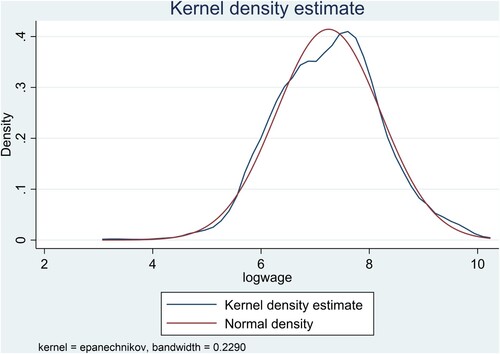
reports a kernel density plot of Ln(Wage) for goalkeepers. Unusually for salary data for sports leagues, and football in particular, we see a distribution that is close to normal. When all players are considered, outfield as well as goalkeepers, the distribution of Ln(Wage) is no longer normal. For goalkeepers in our sample, a joint Chi-squared test for skewness and kurtosis fails to reject the null of normality (p-value of 0.23). This is important as it implies that we can proceed to estimate (1) using Ordinary Least Squares. Estimation by quantile regression is not required although it is warranted for the full sample of all players (Carrieri et al., Citation2018; Deutscher & Büschemann, Citation2016; Kempa, Citation2021). Since we have longitudinal data, with 2.8 observations per player in our panel, our estimates include player fixed effects.Footnote6 Goalkeepers have several time-invariant and intangible attributes. These could include leadership skills, organisational roles for managing defensive players during games, motivational ability and communication skills specific to the role. Unobserved heterogeneity across players is captured by player-fixed effects. Our estimations also include season and league-fixed effects. Our salary figures are nominal so season-fixed effects pick up salary inflation over the sample period.Footnote7 League fixed effects capture time-invariant differences in goalkeeper pay across our five leagues.
Figure 1. Kernel density plot of Ln(Wage) for goalkeepers.
Results
Basic performance measures
Our main results are reported in . Control variables perform much as expected. Age and age² have predicted positive and negative coefficients, respectively. The appearance variables have non-significant coefficients. This is likely due to collinearity with player-fixed effects. Removing these and estimating by OLS restores the significance of appearance variables. Minutes played, Transfer and Log attendance each have positive and significant coefficients. Attendance captures the ability to pay. The significance of the Transfer dummy is consistent with the notion of elite goalkeepers who transfer for fee also command high salaries compared to journeymen free agents who are more likely to move for free.
Table 3. Goalkeeper salary estimates, OLS with player fixed effects.
Goalkeeper performance measures are entered in columns (1) and (2) of . In column (1), Goalkeeper rating is a poor predictor of goalkeeper salary. This is likely due to the narrow range of the measure, from 5.8 to 7.7 in a scale of one to 10, as shown in . This metric has insufficient variation to help predict goalkeeper salaries and is dropped from subsequent estimates.
In column (2), Shots faced has an insignificant coefficient. Saves per shot also has an insignificant coefficient in column (2). It appears that goalkeepers are not rewarded in pay for direct performance measures appropriate to their position and role in the team. When the two direct performance measures are removed in column (3), still with player-fixed effects, Goals against has a negative and significant coefficient at the conventional 5 per cent level. This suggests that goalkeepers are rewarded in pay for game outcomes rather than game workload. It also appears that goalkeepers are rewarded for outcomes that are joint products of player efforts.
The OLS estimates without player-fixed effects are shown in column (4) for comparison and again feature significant coefficients for Goals against and Pass success. An F-test of joint significance of player fixed effects in column (3) delivers a statistic of 5.33 with p-value of 0.00. Given the significance of player-fixed effects, we prefer the estimates in column (3) over (4).
Pass success has a significant, positive coefficient at 5 per cent level or better in the estimates in columns (2) and (3). The coefficients of Goals against and Pass success in column (2) translate into salary elasticities of 0.40 and 0.50, at sample means. Hence, Pass success has greater weight in goalkeeper pay determination than the defensive-oriented measure.
We perform two robustness checks on our model. First, we raise the Minutes filter from 450 to 900. The sample size then drops to 650. The results in are qualitatively similar. Second, we replace Log attendance with Log revenue using the series we privately obtained. The sample size drops to 507 and estimation by OLS and player-fixed effects does not yield interesting results. The number of per player observations drops to 2.2. When we estimate without player-fixed effects, the only performance metric to survive significance is Goals against (coefficient −0.159, t-statistic 2.94). This does at least suggest that the basic metric of Goals against is a robust predictor of goalkeeper salary. However, the reduced sample size when using Log revenue and the poor performance of the model with player-fixed effects lead us to prefer the model without player-fixed effects. We do note that there is a high correlation between Log attendance and Log revenue (coefficient of 0.77).
Offensive, advanced and auxiliary performance metrics
reports results using the Statsbomb measures detailed above. These measures are entered separately alongside the control variables in Equation (1). For brevity, we only report results for the performance measures and highlight those with statistical significance. Player fixed effects are excluded due to the smaller sample size of 210 with two seasons (2018/2019 and 2019/2020) and 137 players.
Table 4. Coefficients on StatsBomb performance measures, OLS estimates. Dependent variable is Ln(Wage).
Post shot expected goals per shot has a negative coefficient, significant at 10 per cent. This is contrary to the hypothesis that increased shot difficulty raises goalkeeper’s salary via a workload effect. This result is, however, consistent with the Shots faced effect in the broader sample above. We offer the same interpretation for the negative effect of Post shot expected goals per shot: goalkeepers are rewarded for reducing the number of more difficult shots they face through their combined proactive measures with defenders. Ideally, any shots on target faced by goalkeepers should be easy to save e.g. shots from distance that are located close to the goalkeeper or closer shots with weak power. Goalkeeper organisation and defensive pressures can deliver these saveable shots and reduce the number of more difficult shots.
Saves minus post shot expected goals per shot adjusts Saves per shot for shot difficulty, as recommended by Gelade (Citation2014). This measure has a positive and significant coefficient at 5 per cent level. For a given shot difficulty, a larger saves per shot ratio is rewarded by higher salary. For a given saves per shot ratio, increased shot difficulty is penalised by lower salary. This is consistent with the Post shot expected goals per shot finding.
Pass40 ratio has a positive and significant coefficient at 5 per cent level. A higher completion rate of long passes (over 40 yards) is rewarded by larger salary. Pass completion for long yardage is a difficult skill, one that is practised by elite goalkeepers such as Alisson (Liverpool) and Ederson (Manchester City), both in the top decile of our sample for this variable.
% goalkick launches has a negative and significant coefficient at 5 per cent level. Goal kicks are distinct from outfield passes as they are set-piece events from a stationary position within the goalkeeper’s six-yard area. The goalkeeper can opt to pass to a teammate from his position or launch the ball forwards. Our result suggests that a higher proportion of kicks that are launched will be penalised in lower pay for goalkeepers. Conversely, a higher proportion of kicks (fewer launches) that are passed to teammates will be rewarded by a higher salary, in line with a strategy of ‘playing out from the back’ to set up attacking moves.
Launch pass rate is the proportion of passes (as opposed to goal kicks) that are launched and this has a negative and significant coefficient (at 10 per cent). Again, more deliberate passes are rewarded with higher salary while launches are penalised.
These results support the findings in , column (5) of the importance of pass success for goalkeeper pay. This is in keeping with the modern strategy of goalkeeper involvement in setting up teams’ passing moves, either to create a shooting opportunity or just to retain possession (Cox, Citation2017; Wilson, Citation2018). More skilled goalkeepers will be able to make successful short and long passes. Less skilled goalkeepers will tend to launch the ball away. As the football playing style has changed over this century, the goalkeepers’ labour market appears to have adjusted by rewarding passing skills more substantially.
When the advanced performance measures discussed above are introduced jointly, rather than just singly. Saves minus post shot expected goals per shot and Pass40 ratio are the two measures that survive significance at the 10 per cent level.
Unconditional quantile regression
In , we report unconditional quantile regression results for a much larger sample of all players with at least 450 min playing time over 2013/2014 to 2019/2020. The unconditional quantile approach follows Carrieri et al. (Citation2018) and Kempa (Citation2021). The models have the same control variables as for and include position, season and league-fixed effects but not player-fixed effects.
Table 5. Coefficients on player performance measures, all positions, unconditional quantile regression estimated at median log wage.
In column (1) we interact WhoScored ratings with position indicators. The results show that Goalkeeper rating has an insignificant coefficient, in line with , column (1). Column (2) interacts positions with performance measures and these are Pass success for goalkeepers, defenders and midfield players and Shots on target for forwards. Goalkeeper*Pass success has a significant positive coefficient reinforcing the earlier result in column (5) but now derived across the whole set of positions. This highlights the importance of pass success in salary determination for goalkeepers as well as outfield players.
Discussion and conclusion
Taken together – and relative to other positions – skills differences, wage discrepancies and transfer peculiarities all point to the exclusivity of the goalkeeper labour market. Our study has proposed several performance metrics that might usefully serve as predictors of goalkeepers’ salaries. We have attempted to advance our knowledge of goalkeeper pay determination beyond the simple result that goalkeepers are ranked below outfield players in terms of average pay levels (Frick, Citation2007).
Our analysis has three main results. First, and counter-intuitively, we fail to find evidence from our preferred model that goalkeepers who save more shots get paid more. Moreover, for a given saves per shot ratio, increased shot difficulty is penalised, not rewarded, by lower salary. We find that goalkeepers in European football are not evaluated for pay determination by their direct defensive contributions. Second, goalkeepers who concede more goals suffer a salary penalty and this is a robust result. This suggests that teams reward and penalise goalkeepers according to outcomes rather than workload. Furthermore, goalkeepers are rewarded for the joint outcomes of their own efforts combined with those of outfield players tasked with preventing goals.
Our evidence suggests that decision-makers within European football clubs are not optimally decoupling individual performance from team qualities. Clubs could improve how they evaluate goalkeepers’ pay. Identifying the failure to use advanced statistics is especially important as forming contracts in our setting is costly.
Our third and arguably most interesting key result is the importance of goalkeeper’s passing success for salary determination, found both for the main sample and the restricted sample where passing accuracy mattered for goalkeeper pay. It appears that the player labour market rewards goalkeepers who are better than others at contributing to their team’s offensive moves and, indirectly, to number of goals scored.
We suggest that in assessing outcomes, club salary negotiators probably tend to give credence to heuristic indicators of player performance such as goals conceded and games won or lost. Our results cannot rule out the possibility that insufficient performance evaluation of goalkeepers leads to non-optimal (not cost minimising) use of payroll budgets. Use of heuristics is a low-cost approach for executives. Sports analytics services are expensive, whether purchased from OPTA (the primary source of football performance data) or developed in-house at clubs with aspirations for participation in UEFA competitions. Acquiring and processing sports analytics outputs is both difficult and costly. Nevertheless, teams could gain a competitive edge by skilful use of sports analytics and future work should track the growth of analytics in terms of impacts on player contract negotiations. Our results from the use of Statsbomb measures point to the relevance of some detailed performance measures for goalkeeper salary determination.
Above, we highlighted how the modern goalkeeper is seen as integral to an outfield playing style of ball retention, possession and passing moves. A further aspect of this development is that passing moves started by goalkeepers tend to be more enjoyable for fans than aimless punts that go out of play or simply reach the opposition goalkeeper. Better passing proficiency, including the goalkeeper, makes a team more attractive to watch. If this style is replicated throughout a league then enhanced revenue generation should follow, especially from sale of TV broadcast rights. There is a feature of fan-derived demand which can help augment goalkeeper salaries.
There are several particular ways in which our study can be improved and possible directions for future research. First, as the Statsbomb measures are now publicly accessible, the sample sizes to facilitate analysis of deeper performance measures will increase over time. Precision of estimates is likely to improve as well. Second, it is possible to explore different methods of separating performance effects for goalkeepers and defenders. One way forward for solving this problem is to collect player injury data to identify effects on player and team performances and player salaries when starting players get injured (Carrieri et al., Citation2020; Gregory-Smith, Citation2021; Hoey, Citation2021). This will require game-level data on player performances and matching injury data. Such data were unavailable for the present study but should prove rewarding in future work. Third, we do not measure psychological traits – future studies could consider goalkeepers ability to respond to cues, their focus and leadership qualities. Fourth, we do not access any information on a club’s use of analytics – assuming this is heterogenous, research could investigate the success of these operations within clubs.
Disclosure statement
No potential conflict of interest was reported by the author(s).
Notes
1 Only two recent goalkeeper transfers appear in the list of top 50 transfers of all time (Kepa Arrizabalaga – Chelsea and Alisson Becker – Liverpool).
2 Wilson demonstrates two further important developments in modern football. First, the game has become less physically aggressive so there has been an arrival of smaller, more agile and faster players with less emphasis on size. Second, team formations have changed with the arrival of ‘attacking midfielders’ who can interchange with a single striker in attacking moves based on precise passing rather than ‘long balls’ to a big forward. Both of these changes affect goalkeepers with greater current emphasis on ball distribution.
3 There is some variation in top tax rates in our leagues: 45% in England, 40% in France, 42% in Germany, 43% in Italy and 47% in Spain. These variations are captured in our estimates by league fixed effects.
4 Since we acquired our data, the website has made the data publicly available without charge.
5 Unlike North American sports, player trades for cash fees are common in European football. The size of fee varies inversely with remaining length of contract (Buraimo et al., Citation2015). In addition to the transfer fee payable to the original club. the player will receive a negotiated signing bonus for joining the new team. The transfer is not necessarily involuntary as the player’s agent might prompt the move and there might be competing bids for the player’s services. Hoey et al. (Citation2021) offer a recent investigation of the transfer system in Europe.
6 Salary studies of professional leagues, including North American and not just football, have tended to omit player fixed effects due to small sample sizes and the problem that these fixed effects dominate explanation of the variation in the dependent variable with lack of significance of time-varying covariates (Simmons, Citation2022). Carrieri et al. (Citation2018) and Carrieri et al. (Citation2020) on Italy Serie A are notable exceptions.
7 Over our sample period, each league generated enhanced revenues from new TV broadcast rights deals. These will have been transmitted into higher player salaries to a large extent. Consistent with this, the season dummies show significant and increasing coefficients over our sample period compared to 2013/2014.
References
- Allen, W. D. (2021). Work environment and worker performance: A view from the goal crease. Journal of Labor Research, 42(3), 418–448. https://doi.org/10.1007/s12122-021-09323-w
- Behravan, I., & Razavi, S. M. (2021). A novel machine learning method for estimating football players' in the transfer market. Soft Computing – A Fusion of Foundations, Methodologies and Applications, 25(3), 2499–2511.
- Berri, D. J., & Brook, S. L. (2010). On the evaluation of the ‘most important’ position in professional sports. Journal of Sports Economics, 11(2), 157–171. https://doi.org/10.1177/1527002510363097
- Berri, D. J., Brook, S. L., & Fenn, A. J. (2011). From college to the pros: Predicting the NBA amateur player draft. Journal of Productivity Analysis, 35(1), 25–35. https://doi.org/10.1007/s11123-010-0187-x
- Berri, D. J., Brook, S. L., & Schmidt, M. B. (2007). Does one simply need to score to score? International Journal of Sport Finance, 2(4), 190–205.
- Bryson, A., Buraimo, B., Farnell, A., & Simmons, R. (2021). Special ones? The effect of head coaches on football team performance, IZA Discussion Papers, No. 14104, Institute of Labor Economics (IZA), Bonn.
- Buraimo, B., Frick, B., Hickfang, M., & Simmons, R. (2015). The economics of long-term contracts in the footballers’ labour market. Scottish Journal of Political Economy, 62(1), 8–24. https://doi.org/10.1111/sjpe.12064
- Butler, D., & Coates, D. (2022). Position premium in Major League Soccer. International Journal of Sports Finance, Forthcoming.
- Carrieri, V., Jones, A., & Principe, F. (2020). Productivity shocks and labour market outcomes for top earners: Evidence from Italian Serie A. Oxford Bulletin of Economics and Statistics, 82(3), 549–576. https://doi.org/10.1111/obes.12347
- Carrieri, V., Principe, F., & Raitano, M. (2018). What makes you ‘super-rich’? New evidence from an analysis of football players’ wages. Oxford Economic Papers, 70(4), 950–973. https://doi.org/10.1093/oep/gpy025
- Coates, D., & Parshakov, P. (2022). The wisdom of crowds and transfer market values. European Journal of Operational Research, 30(1), 523–534. https://doi.org/10.1016/j.ejor.2021.10.046
- Cox, M. (2017). The mixer: The story of Premier League tactics, from route one to false nines. HarperCollins.
- Deutscher, C., & Büschemann, A. (2016). Does performance consistency pay off financially for players? Evidence from the Bundesliga. Journal of Sports Economics, 17(1), 27–43. https://doi.org/10.1177/1527002514521428
- Frick, B. (2007). The footballers players’ labour market: Empirical evidence from the major European Leagues. Scottish Journal of Political Economy, 54(3), 422–446. https://doi.org/10.1111/j.1467-9485.2007.00423.x
- Gelade, G. (2014). Evaluating the ability of goalkeepers in English Premier League football. Journal of Quantitative Analysis of Sports, 10(2), 279–286. https://doi.org/10.1515/jqas-2014-0004
- Gerrard, B. (2007). Is the Moneyball approach transferable to complex invasion team sports? International Journal of Sport Finance, 2(4), 214.
- Gregory-Smith, I. (2021). Wages and labor productivity: Evidence from injuries in the National Football League. Economic Inquiry, 59(2), 829–847. https://doi.org/10.1111/ecin.12960
- Herberger, T. A., & Litke, C. (2021). The impact of Big Data and sports analytics on professional football: A systematic literature review. In T. A. Herberger & J. J. Dötsch (Eds.), Digitalization, digital transformation and sustainability in the global economy. Springer proceedings in business and economics (pp. 147–171). Springer. https://doi.org/10.1007/978-3-030-77340-3_12.
- Hoey, S. (2021). One man’s pain is another man’s gain – early career exposure and later labor market outcomes. Mimeo.
- Hoey, S., Peeters, T., & Principe, F. (2021). The transfer system in European football: A pro-competitive no-poaching agreement? International Journal of Industrial Organization, 75, 102695. https://doi.org/10.1016/j.ijindorg.2020.102695
- Holmes, P. M., Simmons, R., & Berri, D. J. (2018). Moneyball and the baseball players’ labor market. International Journal of Sport Finance, 13(2), 141–155.
- Kempa, K. (2021). Task-specific human capital and returns to specialization: Evidence from association football. Oxford Economic Papers, 74(1), 136–154. https://doi.org/10.1093/oep/gpab006
- Lane, B. (2021, 23 June). The 10 best goalkeepers in World Soccer right now. Insider. https://www.insider.com/10-best-goalkeepers-in-world-soccer-2021-5
- Lewis, M. (2004). Moneyball: The art of winning an unfair game. WW Norton.
- Liu, H., Gómez, M. A., & Lago-Peñas, C. (2015). Match performance profiles of goalkeepers of elite football teams. International Journal of Sports Science & Coaching, 10(4), 669–682. https://doi.org/10.1260/1747-9541.10.4.669
- Lucifora, C., & Simmons, R. (2003). Superstar effects in sport: Evidence from Italian soccer. Journal of Sports Economics, 4(1), 35–55. https://doi.org/10.1177/1527002502239657
- Mala, L., Maly, T., Zahalka, F., & Hrasky, P. (2015). Body composition of elite youth soccer players with respect to field position. Journal of Physical Education and Sport, 15(4), 678. https://doi.org/10.7752/jpes.2015.04103
- Massey, C., & Thaler, R. H. (2013). The loser's curse: Decision making and market efficiency in the National Football League draft. Management Science, 59(7), 1479–1495.
- Müller, O., Simons, A., & Weinmann, M. (2017). Beyond crowd judgments: Data-driven estimation of market value in association football. European Journal of Operational Research, 263(2), 611–624. https://doi.org/10.1016/j.ejor.2017.05.005
- Otte, F., Dittmer, T., & West, J. (2022). Goalkeeping in modern football: Current positional demands and research insights. International Sport Coaching Journal. Forthcoming. https://doi.org/10.1123/iscj.2022-0012
- Őzdemir, A., Dietl, H., Rossi, G., & Simmons, R. (2022). Are workers rewarded for inconsistent performance? Industrial Relations: A Journal of Economy and Society, 61(2), 137–151. https://doi.org/10.1111/irel.12292
- Peracek, P., Varga, K., Gregora, P., & Mikulic, M. (2017). Selected indicators of an individual performance of a goalkeeper at the European Championship among the 17 year old elite soccer players. Journal of Physical Education and Sport, 17(1), 188–193. https://doi.org/10.7752/jpes.2017.01028
- Prockl, F., & Frick, B. (2018). Information precision in online communities: Player valuations on www.Transfermarkt.de. International Journal of Sport Finance, 13(4), 319–335.
- Simmons, R. (2022). Professional labor markets in the Journal of Sports Economics. Journal of Sports Economics, 23(6), 728–748. https://doi.org/10.1177/15270025211051062
- Singh, P., & Lamba, P. S. (2019). Influence of crowdsourcing, popularity and previous year statistics in market value estimation of football players. Journal of Discrete Mathematical Sciences and Cryptography, 22(2), 113–126. https://doi.org/10.1080/09720529.2019.1576333
- Weimar, D., & Wicker, P. (2017). Moneyball revisited: Effort and team performance in professional soccer. Journal of Sports Economics, 18(2), 140–161. https://doi.org/10.1177/1527002514561789
- West, J. (2018). A review of the key demands for a football goalkeeper. International Journal of Sports Science & Coaching, 13(6), 1215–1222. https://doi.org/10.1177/1747954118787493
- Wilson, J. (2018). Inverting the Pyramid: The history of football tactics. Orion.
- Zaytseva, I., & Shaposhnikov, D. (2022). Moneyball in offensive versus defensive actions in football. Applied Economics, 1–17. https://doi.org/10.1080/00036846.2022.2091746
