
ABSTRACT
Adsorption of methylene blue and malachite green dyes from aqueous solution by neem leaves was studied using experimental and computational chemistry approaches. The two dyes have N–H stretch, C≡C vibration vibration, C=C stretch and C–Cl stretch as common functional groups. Batch adsorption experiments were concluded by measuring absorbance (at wavelength of maximum absorption, i.e. 660 and 630 nm for methylene blue and malachite green dyes, respectively). The adsorption of the dyes on neem leaves favoured Langmuir and Temkin isotherms and was influenced by concentration, biomass dose, pH and by contact time, and favoured chemisorption mechanism. Although surface adsorption and intra particle diffusion were identified as the rate-limiting steps, a pseudo second-order kinetics was also favoured. Quantum chemical analysis supported better adsorption of methylene blue dye on neem seed surface than malachite green dye and through Fukui function analysis, the site for adsorption of the dyes was proposed.
1. Introduction
Dyes of various types are the essential organic compound in the textile, carpet, pulp and paper industries. These industries often generate dye containing wastes that are discharged directly or indirectly (surface runoff) to the water bodies. When discharge into water bodies, dyes may constitute environmental pollutants hence their removal is inevitable. Adsorption is one of the best options available for the removal of dyes from aqueous solution. Several materials have been investigated as effective adsorbents for the removal of various dyes from aqueous solution. For example, cellulose-based wastes are good adsorbent for some dyes including methyl orange, methylene blue, rhodamine blue, Congo red, methyl violet and amido black. The adsorption of these dyes was found to follow the Freundlich and Langmuir adsorption isotherms and favoured alkaline pH [Citation1]. Crini [Citation2] reported that three insoluble beta-cyclodextrin polymers having a different degree of beta-cyclodextrin are good adsorbents for the removal of several dyes from aqueous solutions. Physiosorption mechanism was confirmed for the adsorption of these dyes onto the polymers while an inclusion complex was formed through the interaction of beta-cyclodextrin with the host–guest. Iqbal and Ashiq [Citation3] investigated the adsorption capacity of charcoal for bromophenol, alizarine red-S, methylene blue, eriochrome black-T, malachite green, phenol red and methyl violet from aqueous solution. They found that the adsorption efficiency of charcoal for these dyes depended on contact time, pH and temperature. The adsorption characteristics of the dyes were best described by the Langmuir, Freundlich and BET adsorption models while the mechanism of adsorption was chemisorption. Other studies are those reported by Liao et el. [Citation4] (microwave modified bamboo charcoal), Rafatullah et al. [Citation5] (low cost adsorbent), Malana et al. [Citation6] (polymeric gels), El Qada et al. [Citation7] (activated carbon), Annadura et al. [Citation1] (cellulose-based waste), Malik [Citation8] (activated carbon from wood sawdust), Halder et al. [Citation9] (thermally modified granular charcoal), Onai [Citation10] (activated carbon prepared from apricot waste), Perira et al. [Citation11] (carbons), Tahir and Rauf [Citation12] (bentonite clay), Vega-Negron et al. [Citation13] (chitosan/cellulose beads), Beheshti et al. [Citation14] (supramolecular complex) , Naeem et al. [Citation15] (graphene oxide sheets integrated with gold nanoparticles), Ogata et al. [Citation16] (poly-y-glutamic acid), El Alouani et al. [Citation17] (fly ash-based geopolymer), Adeyemo et al. [Citation18] (clay), etc. However, most of the reported studies on the adsorption of dyes have not paid significant attention on the potential of neem seed as an adsorbent nor fully explored detail mechanism for their adsorption. Methylthionium chloride, called, methylene blue (MB) has a chemical structure shown in . Its molecular formula is C16H18ClN3S while its molecular weight is 319.09 g/mol. The mass to charge ratio (m/z) of the dye reveals the following composition; 319.09 (100.0%), 321.09 (36.80%), 320.09 (19.20%), 322.09 (7.0%), 323.08 (1.4% and 321.10 (1.4%). The compound contains 60.08, 5.67, 11.08, 13.14 and 10.02% C, H, Cl, N and S, respectively. On the other hand, the chemical name of malachite green (MG) is [4-[[4-(dimethylamino)phenyl]-phenylmethylidene]-cyclohexa-2,5-dien-1-ylidene]-dimethylazanium;chloride while its chemical formula is C23H29Cl2N3 (see chemical structure in ). Molecular weight of the dye is 418.40 g/mol. Mass spectra analysis reveals that the dye consist of the following fragments; 417.17 (100%), 419.17 (64.20%), 418.18 (25.2%), 420.17 (16.6%), 421.17 (10.4%), 419.18 (3.0%), 422.17 (2.6%), 421.18 (1.9%) and 418.17 (1.1%). These dyes seem to have strong potentials to be adsorbed on suitable adsorbent because they have hetero atoms, which can act as the adsorption centre for the dyes.
Figure 1. Optimized structure of (a) methyl blue and (b) malachite green.
Although the use of neem leaves for the adsorption of MB and MG dyes has not been reported elsewhere (to the best of the knowledge of the authors), several adsorbents of plant origin have been successfully used to remove these dyes from aqueous solution. Some of the reported materials for the removal of methyl blue dye include some carbons [Citation19], activated carbon [Citation20], Indian Rosewood sawdust [Citation21], Scolymus hispanicus L. [Citation22], Peat [Citation23], Mansonia altissima wood sawdust [Citation24] and garlic peel [Citation25]. Similarly, some natural adsorbents are excellent for the removal of malachite green from aqueous solution including ground nut shell [Citation26], bagasse fly ash/activated carbon [Citation27], cyclodextrin [Citation28], granular activated carbon and natural zeolite [Citation29], bentonite [Citation30], etc.
Computational chemistry is an effective tool that uses quantum chemical principles to explain the feasibility, direction and predictions of chemical reactions. Although computational chemistry has not been explicitly applied in adsorption of pollutants from aqueous solution, its usefulness has been fully appreciated in the field of pharmaceutical chemistry (in drug design), corrosion (in studying inhibitors and designing new corrosion inhibitors), etc. In this study, computational chemistry shall be applied to complete experimental data in correlating the ease of adsorption with calculated quantum chemical descriptors and to elucidate the mechanism of adsorption of the studied dyes. Therefore, the present study is aimed at using neem plant leaves for the adsorption of methyl blue and malachite green dyes from aqueous solution. Batch experiments shall be used to investigate the adsorption capacity of the neem seed while computational chemistry shall be used to study the feasibility and mechanism of adsorption of the dyes.
2. Materials and method
2.1. Materials
Neem leaves samples used for the adsorption experiment were dried to constant weight. The dried samples were sieved to 30 BSS size using an electric shaker. Stock solutions of methyl blue and malachite green dyes were prepared from analar grades of the respective dye.
2.2. Batch experiments
Batch bio-sorption experiments were conducted using a 250 ml beaker placed in a shaker maintained at 100 rpm. Concentrations of the respective dye were determined by measuring the absorbance (using UV spectrophotometer) at the wavelength of maximum absorption of the dye (i.e. 660 and 630 nm for methyl blue and malachite green, respectively). Investigated variables were effects of contact time, initial dye concentration, biomass dose and solution pH. In each case, the equilibrium concentration of the dye adsorbed per gram of the adsorbent was calculated using Equation (1) [Citation31],(1) where C0 and Ce are the initial and equilibrium concentrations of the dye, V is the volume of the solution in litre and m is the mass of the adsorbent in gram. Effect of concentration was studied using various concentrations of the dye (ranging from 10 to 50 mg/L) while the agitation rates of 100 rpm for 2 h were applied. Effect of each of the response property on adsorption was investigated through maintenance of constancy of other functions but varying values of the investigated parameter. For example, the effect of period of contact was investigated using fixed mass of adsorbent (2 g), constant concentration of the dye (50 mg/L) but varying time (20–180 min).
2.3. FTIR analysis
FTIR analyses of the dye, adsorbent(before and after adsorption) were carried out using Scimadzu FTIR-8400S Fourier transform infra-red spectrophotometer The sample was prepared using KBr and the analysis was done by scanning the sample through a wave number range of 400–4000 cm−1.
3. Results and discussions
3.1. Spectrophotometric characterization of the dyes
Plots showing the variation of absorbance with wave length for methyl blue and malachite green dyes were used to estimate the wavelength of maximum absorption of MB and MG dyes. It was evident from the plots (not shown) that maximum wavelengths of absorption for methyl blue and malachite green are 660 and 630 nm, respectively. Hence, these wavelengths were used for further spectrophotometry measurements. FTIR spectra of methyl blue and malachite green (spectra not presented) revealed four prominent peaks for the FTIR spectrum of methyl blue which include N–H stretch at 3365 cm−1, C≡C vibration at 2066 cm−1, C = C stretch in ring at 1641 cm−1 and C–Cl stretch at 543 cm−1. However, for malachite green, the associated functional groups are NH stretch at 3276 cm−1, C≡C vibration at 2066 cm−1, C = C stretch in ring at 1641 cm−1 , NH stretch at and 1006 cm−1 and C–Cl at 570 cm−1.
3.2. Effect of dye concentration and biomass dose on adsorption
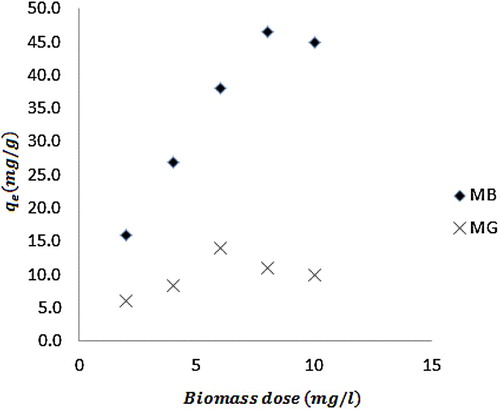
reveals plots showing the variation of equilibrium amount of MB and MG dyes adsorbed with time. It is evident from the plots that the amount of dye adsorbed by neem leaves increases with increase in the concentration of the dye. This implies that as the concentration of the dye increases, the amount of the adsorbate available to be driven to the surface increases until there was saturation. On the other hand, shows plots for the variation of the equilibrium amount of dye adsorbed with biomass dose. From the plots, it is indicative that the amount of dye adsorbed increases with increase in biomass dose before decreasing to a steady trend. Therefore, there exist an optimum amount of the adsorbent that must be used in order to have efficient adsorption. The decrease in the amount of dye absorbed at certain critical biomass weight may be due to competition between forces of adsorption and desorption. As the adsorbate continue to stick to the surface of the adsorbent, a stage is reached where the surface is saturated such that further increase in concentration of the adsorbent may not influence the amount of the molecules that are adsorbed. Beyond the saturation, desorption can set in, leading to a decrease in the amount of the adsorbate on the surface.
Figure 2. Variation of equilibrium concentration of dye adsorbed with dye concentration.
Figure 3. Variation of equilibrium concentration of dye adsorbed with biomass dose.
3.3. Effect of pH on adsorption of MB and MG
shows plots for the variation of the amount of MB and MG dyes adsorbed with pH. The plots clearly reveal that the amount of dye adsorbed increases with increase in pH before attending steady trend. Generally, pH can influence various solution factors including charge, degree of dissociation or ionization, etc. MG and MB dyes are anions, which have the tendency to be strongly adsorbed at low pH due to the presence of H+ but as the pH increases, the concentration of the H+ becomes gradually depleted and their adsorption decreases as shown in . According to Mall et al. [Citation26], MG and MB dyes can be protonated (thus forming positive ions) at lower pH but gradually become deprotonated with increasing pH. Increase in degree of protonation will lead to increasing degree of adsorption, which is in good agreement with the present experimental data.
Figure 4. Variation of equilibrium concentration of dye adsorbed with pH.
3.4. Effect of contact time on adsorption
Variation of the amount of MB and MG dyes adsorbed with time is shown in . From the plots, it is evident that the amount of dye adsorbed increases with time up to a maximum before dropping downward. The observed trend reflects the fact that, as the adsorption progresses with time, the surface of the adsorbent becomes gradually filled until a saturation adsorption is reached. After saturation, desorption may set in and may decrease the concentration of adsorbed dye on the surface of the adsorbent.
Figure 5. Variation of equilibrium concentration of dye adsorbed with time.
3.5. Adsorption isotherm
Curve fittings to identify best isotherms for the adsorption of MB and MG dyes on neem surface were carried out for the various adsorption isotherms. The tests indicated that the adsorption of MB and MG dyes on neem leaves surface best fitted the Langmuir and Temkin isotherms. According to Annadurai et al. [Citation1], the Langmuir adsorption equation can be written as,(2) where KL is the Langmuir constant, qe is the equilibrium amount of the dye that is adsorbed, qm is the amount of dye adsorbed at saturation. Multiplication of Equation (2) by Ce leads to Equation (3).
(3)
From Equation (3), a plot of versus
is expected to be linear provided the Langmuir adsorption equation is obeyed. Degree of linearity obtained from the Langmuir plots () with respect to MB and MG were 0.8376 and 0.8922, respectively. Adsorption parameters derived from the Langmuir plots are recorded in . From the presented results, values of KL and qm are higher for MB than for MG. Generally, qm is equivalent to adsorption capacity indicating that increasing value of qm points toward better adsorption. Hence, higher values of qm obtained for MB confirm that neem leaves adsorbed MB better than MG. The adsorption capacity of neem leaves for MB dye is 60.60 mg/g, which is lower than adsorption capacity of Rice husk (690 mg/g) [Citation32] and that of teak tree bark (333 mg/g) [Citation33] for MB dye. However, this value is comparable to that of sun flower seed husk (45.25 mg/g) [Citation34], hazelnut shell (76.9 mg/g) [Citation35], cherry saw dust (39 mg/g) [Citation35] and that of walnut saw dust (59.17 mg/g) [Citation35] for MB dye. However, the adsorption capacity of neem leaves for MG dye was 7.65 mg/g, which is comparable to that of pandanus leaves (9.737 mg/g) [Citation36] and that of neem bark (0.36 mg/g) [Citation37] but lower than that of ], rice husk (63.85 mg/g) [Citation38] for MG dye. Bhattacharyya and Sharma [Citation39] has reported adsorption capacity of 72 mg/g for the adsorption of Congo dye by neem leaves powder, which compares relatively with the adsorption of MB dye but at significant variance for the adsorption of MG dye. It is evident from this study that adsorption capacity depends on the type of dye, the nature of adsorbent and other factors. A significant model that can be related to the Langmuir adsorption equation is called dimensionless constant, i.e. the separation factor, which can be written as,
(4)
Figure 6. (a) Langmuir and (b) Temkin plots for the adsorption of MB and MG dyes on neem leaves.
Table 1. Langmuir and Temkin parameters for the adsorption of MB and MG dyes.
The implication of Equation (4) is that when RL is greater than unity, the adsorption is unfavourable. When RL is equal to unity, the adsorption is linear and when RL is less than unity but greater than zero, the adsorption is favourable. However, when RL is equal to zero, the adsorption is irreversible. Calculated values of RL for MB and MG are also presented in . The results obtained confirm that the adsorption of MB and MG on neem leaves surface is favourable.
Adsorption of MB and MG dyes was also found to follow the Temkin adsorption isotherm, which can be expressed as,(5) where BT is the equilibrium binding constant, corresponding to the binding energy,
, is related to the heat of adsorption. Temkin plots for MB and MG dyes are shown in while contains values of adsorption parameters deduced from the isotherm. It is worth noting that the standard free energy of adsorption of MB and MG dyes on neem leaves surface is related to KT according to the Gibb Helmholtz equation (Equation (6)),
(6)
Figure 7. Pseudo (a) first and (b) second-order kinetic plots for the adsorption of MB and MG dyes.
Calculated values () are positive indicating chemisorption mechanism. The free energy change for MG is higher than that of MB signifying better adsorption of MG dye on neem leaves surface than MB dye. Therefore, the adsorption of MG will favour higher temperature and may be more irreversible compared to the adsorption of MB dye. Also, since BT values are related to the heat of adsorption, which increases for chemisorption mechanism. BT value for MG dye been higher than that of MB confirms the remark deduced from standard free energy data.
3.6. Kinetic study
Aspects of kinetics that are significant in adsorption of dyes from aqueous solutions are pseudo first order, pseudo second order and intra particle diffusion model. The essential characteristics of pseudo first and second-order kinetics rest on the fact that the adsorption steps (including external and internal diffusion/adsorption) are lumped together. However, the adsorption rate is proportional to the driving force (i.e. concentration) in a pseudo first-order kinetics but proportional to the square of the driving force in a pseudo second-order kinetics. The linear forms of pseudo first and second-order kinetics are given by Equations (7) and (8),(7)
(8)
From Equation (7), a plot of versus t is linear if a pseudo first-order kinetics is obeyed. Also from Equation (8), plotting of
versus t is linear for data obeying a pseudo second-order kinetics. displays plots showing pseudo first and second-order plots for the adsorption of MB and MG by neem leaves. Kinetic data obtained from slopes and intercepts of the plots are presented in . The results contain evidences on the existent of significant differences between calculated and experimental equilibrium amount of MB and MD dyes that are adsorbed on neem leaves surface. However, these values are in better agreement with the pseudo second-order kinetics than for the pseudo first-order model. Calculated values of R2 also confirm that the adsorption of MB and MG dyes favours a pseudo second-order kinetics better than a pseudo first-order kinetics.
Table 2. Pseudo first and second-order kinetic parameters for the adsorption of MB and MG.
The pseudo second-order kinetics parameters can be used to calculate the initial adsorption rate, h and half adsorption time, t1/2 according to the following equations,(9)
(10)
Calculated h values for MB and MG dyes were 3.665 and 0.023, respectively. On the other hand, t1/2 values were 0.1322 and 2.3096 min−1. Therefore, the initial adsorption rate of MB dye is better than that of MG dye while the half adsorption time for MG dye is better than that of MB dye.
3.7 Intra particle diffusion model
The occurrence of intra particle diffusion as the rate limiting step requires that a plot of qe versus square root of t should be linear with zero intercept. This plot is in line with the following equation,(11) where kp is the intra particle diffusion constant. presents the linear section of intra particle diffusion plots for the adsorption of MB and MG dyes. Calculated R2 values for the plots of MB and MG dyes were 0.8964 and 0.8285, respectively. However, three sections were identified in the plots. The first section was the slowly rising graph followed by a straight line and lastly a plateau. The existent of non-linear sections in the plots indicate that both surface adsorption and intra particle diffusion process occur simultaneously. Calculated values of kp for MB and MG dyes were 0.4448 and 4.336 mg/g min0.5, respectively.
Figure 8. Intra particle diffusion plots for the adsorption of MB and MG on neem leaves.
3.8. Desorption study
Fix bed experiment was carried out as reported elsewhere. The experiment was carried out at a pH of 8 and 4 for MB and MG dyes, respectively. The desorption study was conducted by eluting with dilute NaOH through the fixed bed of the adsorbent column and the concentrations of the dye recovered were 17.15 and 7.29 mg/g, which represented good percentage recovered. The absorbance of the solution containing MB dye before and after elution was 2.405 and 0.430 while that of MG dye were 2.233 and 0.374, respectively.
3.9. Computational chemistry study
presents calculated quantum chemical descriptors for MB and MG dyes. The descriptors include the frontier molecular energies (the energy of the highest occupied molecular orbital, EHOMO, the energy of the lowest unoccupied molecular orbital, ELUMO and the energy gap, ΔE), the dipole moment (μ) the polarizability (π*), the electronic energy (EE), the binding energy (EB), the hydration energy (EH), the surface area (SA) and surface volume (SV). Adsorption is a process involving charge or electron transfer between the adsorbent and the adsorbate. This implies that one species donate, while the other accept electron or charge. The EHOMO is a molecular descriptor that describes the tendency of a molecule to donate electron to acceptor specie [Citation40]. Thus increasing value of EHOMO is associated with increasing ease of adsorption. However, ELUMO is an index that signifies the ability of a molecule to accept electron or charge from a donor [Citation41]. Consequently, the lower the value of ELUMO, the better should be the adsorption potential. On the other hand, ΔE is the difference between the ELUMO and EHOMO and is related to the energy barrier that must be overcome before adsorption. It is also an index that is related molecular hardness or softness. Soft molecules have lower ΔE (and vice versa) hence better adsorption tendency than hard molecule. Therefore, the ease of adsorption is expected to correlate with decreasing value of ΔE. From the results presented, the EHOMO for MB dye is higher than that of MG dye while its ELUMO is lower than that of MG dye. These trends are in better agreement with experimental results since MB dye is better adsorbed than MG dye. However, the ΔE of MB dye is higher than that of MG dye, suggesting that the adsorption of these dyes may not depend on the ease of transition between EHOMO and ELUMO, that is the energy gap. The dipole moment of MB dye was significantly lower than that of MG dye. The exact relationship between dipole moment and adsorption has not been fully derived but most adsorption processes are favoured by lower value of μ as observed in this study. The strength of a chemical compound, hence its reactivity/adsorption can also be assessed by its EB, EH and EE. The higher the values of EB, EH and EE for a molecule, the more difficult the compound will be hydrated, protonated or become adsorbed on a surface. Therefore, MB dye having lower values of these parameters is better hydrated, protonated and adsorbed on neem leaves surface than MG dye. Polarizability is a measure of the behaviour of molecular specie in the present of charge atmosphere. The better the respond, the ease is the tendency of the molecule to be adsorbed. This explains why MB dye is better adsorobed on neem surface than MG dye. Better adsorption of MB dye than MG dye on neem leaves is also favoured by higher value of log P and lower values of SA and SV. The larger the surface area and volume of the adsorbate, the more difficult it will compete to fit into the adsorption matrix of the adsorbent.
Table 3. Calculated quantum chemical descriptors for MB and MG dyes.
Adsorption of a molecule onto an adsorbent is favoured by suitable functional groups hence analysis of the electronic parameters of the constituent atoms can furnish information on the site where adsorption is preferentially favoured. The Fukui function is an index that can be used to assess the local reactivity (hence adsorption) of a molecule on the bases of the electronic properties of its constituent atoms. The Fukui function is established by the fact that if an N electron system loses an electron, it becomes (N − 1) but N + 1 when an electron is gained. Therefore, there are two major Fukui functions corresponding to N− 1 and N + 1 systems, respectively. These are defined according to the following equations [Citation42],(12)
(13) where
and
are condensed Fukui function associated with the LUMO and HOMO, respectively (i.e. electrophilic and nucleophilic Fukui functions).
,
and
are Milliken, Lowdin or Hierfield charges for N + 1, N and N − 1 electron systems, respectively. Calculated Fukui functions for MB and MG dyes are presented in and , respectively. In MB dye, the highest electrophilic Fukui function resides in the sulphonium sulphur S(6) while the nucleophilic Fukui function resides in the aromatic ring at C(2). Therefore, the adsorption of MB dye on neem leaves will preferentially occur through the sulphonium sulphur. In MG, the
resides in the C(2) atom while the
resides in the C(7) atom. Therefore, the adsorption of MG on neem leaves occurs through the aromatic ring. The HOMO and LUMO molecular orbital diagrams of MB and MG are shown in . The diagrams clearly reveal the distribution of positive (red loop) and negative charge (blue loop) on the molecules. The information provided by these diagrams do not contradict revelation from Fukui function analysis.
Figure 9. HOMO and LUMO molecular orbital diagrams of MB and MB dyes.
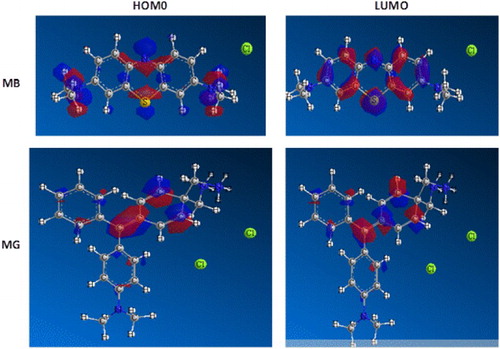
Table 4. Condensed Fukui functions for MB dye.
Table 5. Condensed Fukui functions for MG dye.
4. Conclusions
Neem leaves is an effective adsorbent for methylene blue and malachite green dyes. It functions through surface adsorption and intra particle diffusion. Within a certain range of the various response parameters, the adsorption of the dyes depends on the variation of concentration, biomass dose, pH and contact time. Mechanism of chemisorption favours the adsorption of MB and MG dyes on neem seed and their adsorption characteristics best fitted pseudo second-order kinetics, Langmuir and Temkin adsorption models. Quantum chemical descriptors are significant in explaining why MB dye is better adsorbed than MG dye and in the provision of the mechanism of adsorption.
Disclosure statement
No potential conflict of interest was reported by the authors.
References
- Annadurai G, Juang R, Lee D. Use of cellulose-based waste for adsorption of dyes from aqueous solutions. J Harz Mater. 2002;92(3):263–274. doi: 10.1016/S0304-3894(02)00017-1
- Crini G. Studies on adsorption of dyes on beta-cyclodextrin polymer betacyclodextrin polymer. Bioresource Technol. 2003;90(2):193–198. doi: 10.1016/S0960-8524(03)00111-1
- Iqbal MJ, Ashiq MN. Adsorption of dyes from aqueous solution on activated charcoal. J Harz Mater. 2007;139(1–2):57–66. doi: 10.1016/j.jhazmat.2006.06.007
- Liao P, Ismael ZM, Zhang W, et al. Adsorption of dyes from aqueous solutions by microwave modified bamboo charcoal. Chem Engr J. 2012;195/196(1):339–346. doi: 10.1016/j.cej.2012.04.092
- Rafatullah M, Sulaiman O, Hashim R, et al. Adsorption of methylene blue on low-cost adsorbent: a review. J Harz Mater. 2010;177(1–3):70–80. doi: 10.1016/j.jhazmat.2009.12.047
- Malana MA, Ijaz S, Ashiq MN. Removal of various dyes from aqueous media unto polymeric gels by adsorption process: their kinetics and thermodynamics. Desalination. 2010;263(1–3):249–257. doi: 10.1016/j.desal.2010.06.066
- El Qada EN, Allen SJ, Walker GM. Adsorption of basic dyes from aqueous solution onto activated carbon. Chem Engr J. 2008;135(1):174–184. doi: 10.1016/j.cej.2007.02.023
- Malik PK. Dye removal from wastewater using activated carbon developed from sawdust: adsorption equilibrium and kinetics. J Harz Mater. 2004;113(1–3):81–88. doi: 10.1016/j.jhazmat.2004.05.022
- Halder S, Bukhari N, Park SY, et al. Adsorption of bromo-phenol blue from an aqueous solution onto thermally modified granular charcoal. Chem Engr Res Design. 2011;89(1):23–28. doi: 10.1016/j.cherd.2010.04.022
- Onai Y. Kinetics of adsorption of dyes from aqueous solution using activated carbon prepared from waste apricot. J Harz Mater. 2016;137(3):1719–1728.
- Pereira MFR, Soares SF, Orfalo JJM, et al. Adsorption of dyes on activated carbons: influence of surface chemical groups. Carbon N Y. 2003;41(4):811–821. doi: 10.1016/S0008-6223(02)00406-2
- Tahir SS, Rauf N. Removal of a cationic dye from aqueous solutions by adsorption onto bentonite clay. Chemosphere. 2006;63(11):1842–1848. doi: 10.1016/j.chemosphere.2005.10.033
- Vega-Negron AL, Alamo-Nole L, Perales-Perez O, et al. Simultaneous adsorption of cationic and anionic dyes by chitosan/cellulose beads for waste water treatment. Inter J Environ Res. 2018;12(1):59–65. doi: 10.1007/s41742-018-0066-2
- Beheshti A, Hashemi F, Behvandi F, et al. Selective high adsorption capacity for Congo red dye of a new 3D supramolecular complex and its magnetic hybrid. Inorg Hem Front. 2018;3. doi: 10.1039/C7QI00799J
- Naeem H, Ajimal M, Muntha S, et al. Synthesis and characterization of graphene oxide sheets integrated with gold nanoparticles and their applications to adsorptive removal and catalytic reduction of water contaminants. RSC Adv. 2018;8:3599–3610. doi: 10.1039/C7RA12030C
- Ogata F, Nagai N, Kawasaki N. Adsorption capability of cationic dyes (methylene blue and crystal violet) onto poly-y-glutamic acid. Hem Pharm Bull. 2017;65(3):268–275. doi: 10.1248/cpb.c16-00827
- El Alouani M, Alehyen S, El Achouri M, et al. Removal of cationic dye-methylene blue –from aqueous solution by adsorption on fly ash-based geopolymer. J Mater Environ Sci. 2018;9(1):32–46.
- Adeyemo AA, Adeoye IO, Bello OS. Adsorption of dyes using different types of clay: a review. Water Sci. 2017;7(2):543–568. doi: 10.1007/s13201-015-0322-y
- Kannan N, Sundaram MM. Kinetics and mechanism of removal of methylene blue by adsorption on various carbons-a comparative study. Dye and Pigments . 2001;51(1):25–40. doi: 10.1016/S0143-7208(01)00056-0
- Ameed BH, Din ATM, Ahmad AL. Adsorption of methylene blue onto bamboo-based activated carbon: kinetics and equilibrium studies. J Harz Mater. 2007;141(3):819–825. doi: 10.1016/j.jhazmat.2006.07.049
- Garg VK, Amita M, Kumar R, et al. Basic dye (methylene blue) removal from simulated wastewater by adsorption using Indian rosewood sawdust: a timber industry waste. Dyes Pigm. 2004;63(3):243–250. doi: 10.1016/j.dyepig.2004.03.005
- Barka N, Abdennouri M M, El Makhfouk M. Removal of methylene blue and Eriochrome black T from aqueous solutions by biosorption on Scolymus hispanicus L.: kinetics, equilibrium and thermodynamics. J Taiwan Inst Chem Engr. 2011;42(2):320–326. doi: 10.1016/j.jtice.2010.07.004
- Femandes AV, Almeida CAP, Debacher NA, et al. Isotherm and thermodynamics data of adsorption of methylene blue from aqueous solution onto peat. J Mol Struct. 2010;982(1–2):62–65. doi: 10.1016/j.molstruc.2010.08.006
- Ofomaja AE. Kinetic study and sorption mechanism of methylene blue and methyl violet onto mansonia (Mansonia altissima) wood sawdust. Chem Engr J. 2008;143(1–3):85–95. doi: 10.1016/j.cej.2007.12.019
- Hameed BH, Ahmad AA. Batch adsorption of methylene blue from aqueous solution by garlic peel, an agricultural waste biomass. J Harz Mater. 2009;164(2–3):870–875. doi: 10.1016/j.jhazmat.2008.08.084
- Malik R, Ramteke DS, Wate SR. Adsorption of malachite green on groundnut shell waste based powdered activated carbon. Waste Mgt. 2007;27(9):129–1138.
- Mall ID, Srivastava VC, Agarwal NK, et al. Adsorptive removal of malachite green dye from aqueous solution by bagasse fly ash and activated carbon- kinetic study and equilibrium isotherm analyses. Colloids Surf A: Physicochem. Engr Aspects. 2005;264(1–3):17–28. doi: 10.1016/j.colsurfa.2005.03.027
- Crini G, Peindy HN, Gimbert F, et al. Removal of C.I. based green 4 (malachite green) from aqueous solution by adsorption using cyclodextrin based adsorbent: kinetic and equilibrium studies. Sep Purif Technol. 2007;53(1):97–110. doi: 10.1016/j.seppur.2006.06.018
- Meshko V, Markovska L, Mincheva M, et al. Adsorption of basic dyes on granular activated carbon and natural zeolite. Water Res. 2001;35(14):3357–3366. doi: 10.1016/S0043-1354(01)00056-2
- Bulut E, Ozacar M, Sengil A. Adsorption of malachite green onto bentonite: equilibrium and kinetic studies and process design. Micropourous and Mesoporous Mater. 2008;115(3):234–246. doi: 10.1016/j.micromeso.2008.01.039
- Eddy NO. Modeling of the adsorption of Zn2+ from aqueous solution by modified and unmodified Cyperus esculentus shell. Electronic J Envrn Agric Food Chem. 2009;8(11):1177–1185.
- Chandrasekhar S, Pramada PN. Rice husk ash as an ad-sorbent for methylene blue – effect of ashing temperature adsorption. Adsorption. 2006;12:27–43. doi: 10.1007/s10450-006-0136-1
- Patil S, Renukdas S, Patil N. Removal of methylene blue, a basic dye from aqueous solution by ad-sorption using teak tree (Tectona grandis) bark powder. Int J Env Sci. 2011;1 (5):711–725.
- Ong ST, Keng PS, Lee SL, et al. Equilibrium studies for the removal of basic dye by sunflower seed husk (Helianthus annus). Int J Phys Sci. 2010;5 (8):1270–1276.
- Ferrero F. Dye removal by low cost adsorbents: hazelnut shell in comparison with wood saw dust. J Hazard Mater 2007;142:144–152. doi: 10.1016/j.jhazmat.2006.07.072
- Hema M, Arivoli S. Adsorption kinetic and thermodynamics of malachite green dye into acid activated low cost carbon. J App Sci Environ Manag. 2008;12(1):43–51.
- Srivastava R, Rupainwar DC. A comparative evaluation for adsorption of dye on neem bark and mango bark powder. Indian J Chem Technol. 2011;18:67–75.
- Sharma YC, Singh B, Uma SV. Fast removal of malachite green by adsorption on rice husk activated carbon. Open Environ Pollut Toxicol J. 2009;1 :74–78.
- Bhattacharyya KG, Sharma A. Azadirachta indica leaf powder as an effective biosorbent for dyes: a case study with aqueous Congo red solutions. J Environ Manag. 2004;71:217–229. doi: 10.1016/j.jenvman.2004.03.002
- Eddy NO. Theoretical study on some amino acids and their potential activity as corrosion inhibitors for mild steel in HCl. Mol Simul. 2010;36(5):354–363. doi: 10.1080/08927020903483270
- Eddy NO, Ita BI. QSAR, DFT and quantum chemical studies on the inhibition potentials of some carbozones for the corrosion of mild steel in HCl. J Mol Mod. 2011;17(2):359–376. doi: 10.1007/s00894-010-0731-7
- Ameh PO, Eddy NO. Theoretical and experimental studies on the corrosion inhibition potentials of 3-nitrobenzoic acid for mild steel in 0.1 M H2SO4. Cogent Chem. 2016;2:1253904. doi: 10.1080/23312009.2016.1253904