
 ?Mathematical formulae have been encoded as MathML and are displayed in this HTML version using MathJax in order to improve their display. Uncheck the box to turn MathJax off. This feature requires Javascript. Click on a formula to zoom.
ABSTRACT
The welding process led to the heating of very heterogeneous metals, some volumes of matter know that the high temperature causes their fusion. The cooling after fusion is also heterogeneous from considering the speed in which the temperatures change. The solidification of the molten zone and the complete return of that heated to the ambient temperature cause local modifications in the microstructure of metals due to constraints and residual deformations. They are generated at the same time by heterogeneity of the variations in temperature, of the crystalline transformations related to the heat treatment of welding and the efforts related to the side pressure of the electrodes through which circulates the current necessary to welding. Stress levels alone do not justify the fatigue behaviour of material when it does not present homogeneous properties of fatigue strength in the studied volume. Nevertheless, the distribution and stress levels encountered are a valuable contribution to the understanding of local fatigue damage, the sensitivity of stress levels and their spatial distribution in the welded point and their immediate vicinity will be studied in relation to several geometric parameters. The digital model implemented thus aims to identify the critical zones of the welded point and to quantify the influence of certain geometrical risks. Thus, the established model and the results of calculations carried out correlate in a very satisfactory way the experimental results obtained on the test piece welded by point.
1. Introduction
The particular geometry of a welded point assembling two sheets generates high concentrations of stresses in the vicinity and even inside the welded point. These constraints cause the starting and the propagation of cracks under a cyclic loading until the rupture of one of the sheets or the molten core. The cracking of sheets and the shearing of the point are the two damaging modes by the tiredness of the assemblies carried out by welded points. In order to better understand the fatigue damage of the spot-welded specimens, the simulation of the welding process and the calculation of the stresses in the structure give a very valuable support to the analysis of the different modes of the ruin of the specimens subjected to traction loads’ time-varying shear [Citation1–4]. The objective of this article is to analyse and to attempt to justify numerically the finite element method [Citation5,Citation6] of the two observed modes of rupture of the specimens welded by point and stressed in tension-shear. The diameter of the welded point, the interface between the two sheets and the shape of the notch are the geometric parameters of this study. The calculation of the constraints was carried out by means of the calculation code by finite elements FEMAP-NASTRAN. This first paragraph is intended to present the geometrical model used for the calculations, by finite elements, of the constraints existing in the test-tube requested in traction.
2. Numerical model of the welded specimen
2.1. Geometric model
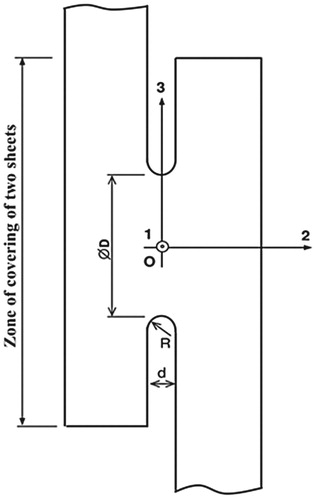
The geometric model used is that shown in Figure . The test-tube consists of two thin sheets of dimensions 124 × 30 (mm) with a length of covering of 38 mm. Two rectangular wedges of dimensions 38 × 30 (mm) are used to locate the resultant of the tensile-shear stress in the plane of contact of the sheets. The two sheets and blocks are connected by the welded point produced by the resistance welding process [Citation6–8]. A three-dimensional analysis of the specimen was performed by finite elements to determine the distribution of normal and shear stresses within the welded spot. The objective is to try to correlate the two modes of fatigue ruin usually observed on the plates assembled by a welded point with the values of the stresses generated by the tensile-shear stress. One of the two mechanisms of fatigue is the cracking of the sheets, first in the thickness then by transverse propagation; the other is the transverse shear of the molten core of the welded point. The orthonormal reference (1, 2, 3) used for the whole study is shown in Figure . Because of its loading and symmetry plane (2, 3) of the test-tube, a half-test-tube only is modelled.
Figure 1. Geometrical model of the test piece “welded point” (a) drawing of definition, (b) mesh.
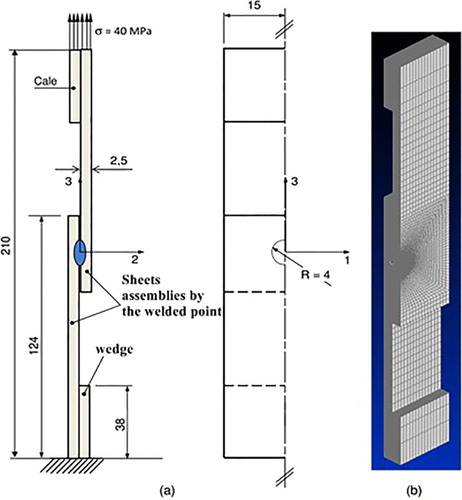
That makes it possible to reduce the computing times. The loading is applied at the higher side of the test-tube, the lower side being fixed (Figure (a)). The computing precision and times are strongly dependent on the quality of the grid of the point welded in the vicinity of the bottom the notch. Finally, the EF model comprises 492,192 elements of the isoparametric type with 701,993 nodes (Figure (b)). The FEMAP-NASTRAN software is used to perform these calculations. The mechanical properties of elasticity of the steel used are Young's modulus equal to 210,000 MPa and a Poisson's coefficient equal to 0.3.
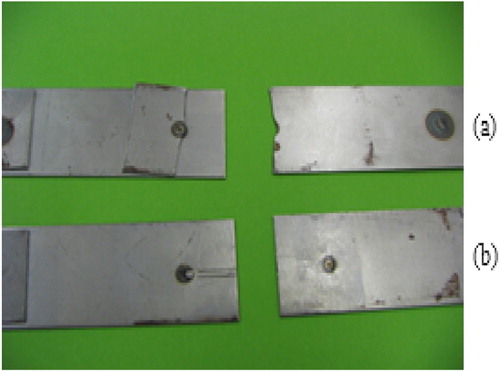
The specimen is subjected to a tensile-shear stress in the form of a uniform tensile stress of 40 MPa applied to the upper section of the test-tube (Figure (a)). This type of stress corresponds to a tensile force of the test-tube equal to 6000 N. In a first stage, the calculations are carried out within the framework of a purely elastic behaviour of the material. In reality, the acuteness of the bottom notch and the elastoplastic behaviour of the material generate local plasticity. The rupture of the test piece is linked to the predominance of one of the two modes of rupture in competition. The welding conditions and stress levels may be more favourable to one than to the other, which would then explain why one of the two leads to rupture before the other. Figure shows two similar test pieces, one broken by cracking one of the two sheets, the other by shearing the welded point.
Figure 2. Specimens welded by spot and broken in two distinct modes of rupture (a) by cracking one of the two sheets, (b) by shearing the core of the welded point.
2.2. Choice and optimization of the specimen mesh
Given the geometry of the specimen used, the study was based on three-dimensional modelling and therefore required voluminal elements.
The mesh size of the test-tube adopted is that shown in Figure (b). The model has 16 elements on half-width (15 mm) and 34 elements in thickness (2.5 mm). In the fillet of the molten core with the two sheets, stress concentration zone, a fine mesh has been chosen for better accuracy of the results (Figure ).
Figure 3. Mesh models used to optimize results.
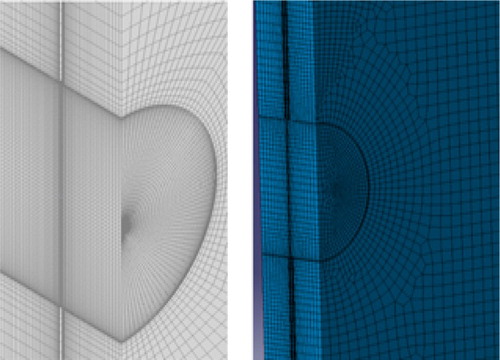
The preliminary study of the convergence of the mesh required the successive use of several element sizes. The final mesh retained is such that the size of the elements no longer influences the results obtained in terms of constraints. Two particular zones are retained for the comparison of the results of calculations of the states of constraints obtained for each type of mesh. These zones contain the ignition sites of the two modes of fatigue failure of the welded points and are defined in Figure . Both are located in the plane of symmetry (2, 3) of the test piece. The first zone is the AB segment located on the internal face of one of the two assembled sheets; point A belongs to the upper sheet and is therefore located on the side where the tensile force is applied. The second zone is the vertical diameter CD of the molten core with centre O.
Figure 4. Local geometrical model at the welded point: description of the zones of comparison of the constraints for the optimization of the mesh in the plane of symmetry of the test piece.
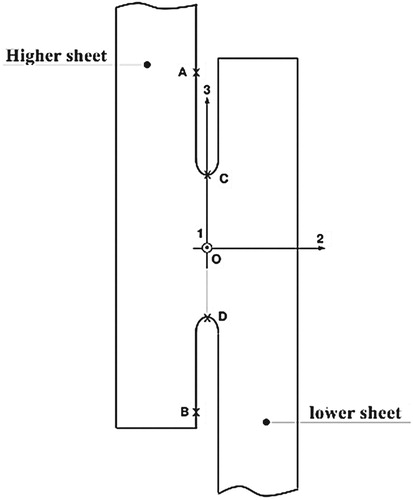
Figure shows the evolution of the normal stress σ33 along the vertical diameter CD of the welded point of the test piece for four different meshes used: the mean mesh width in the fillet is 0.0754 mm (296,588 elements); in the first case, 0.0546 mm (368,524 elements) in the second, 0.0336 mm (492,192 elements) in the third and 0, 0294 mm (524,064 elements) in the latter case.
Figure 5. Comparison of the results of calculation of σ33 for the four mesh sizes analysed.
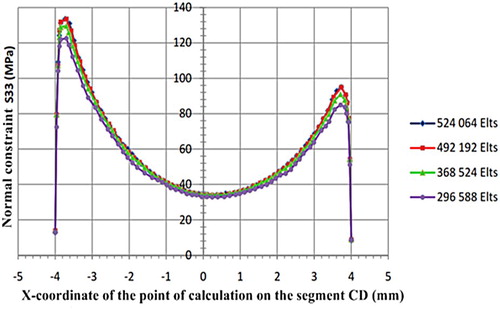
On all the stress distribution graphs on CD or AB, one denotes the parameter that corresponds to the opposite of the dimension z in the overall reference of the test piece. The points A, B, C and D, therefore, have respectively X-coordinate −15, +15, − 4 and + 4 in Figures and .
It is noted from Figure that the evolutions of the normal stress σ33 for mesh sizes of 492,192 and 524,064 elements are confused.
For the sake of clarity, the result of the calculations is shown in Figure for the last two mesh sizes. The two curves together show the convergence of stress calculations. The mesh with 492,192 elements was therefore retained for the following finite element calculations.
Figure 6. Comparison of the calculation results of σ33 for meshes with 4,92,192 and 5,24,064 elements.
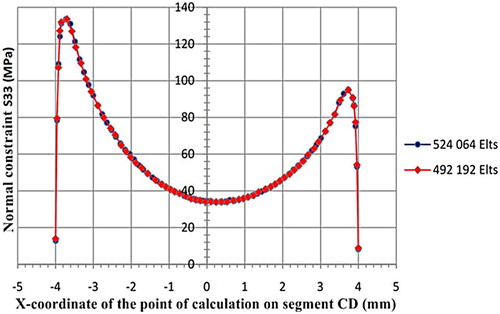
Figure shows the same comparison of the evolution of the normal stress σ33 for the last two meshes studied.
Figure 7. Comparison of the results of calculation of σ33 on the segment AB for the two grids comprising 492,192 and 524,064 elements.
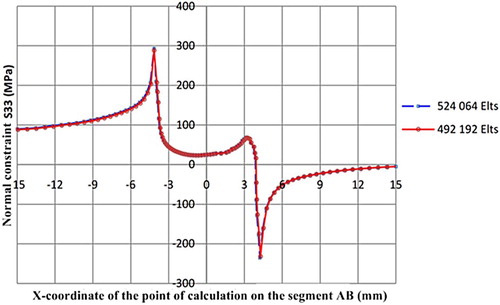
The evolutions of the normal stress σ33 on AB for each of the last two meshes are also analogous and thus indicate the convergence of the results of the calculation, which justifies here also the retaining of the mesh at 492,192 elements according to the principle retained.
3. Stress analysis in the case of elastic behaviour
Local variations in the geometry of a structure, subjected to monotonic or cyclic loading, can lead to local amplification of the stress field with respect to its nominal value. Any sudden variation in cross section (notch, groove, hole, roundness, crack, etc.) locally amplifies the stresses, which generally leads to a significant weakening of the structure in terms of safety. In a test-tube composed of two thin sheets assembled by a welded point and subjected to uniaxial tension, the lines of force are concentrated at the level of the fillet connecting the molten core to the two sheets, greatly increasing the intensity of the local stresses. This principle of stress concentration greatly affects the fatigue strength in the case of variable loads. The analysis of the stress distribution in the area where the stress concentration is high, i.e. in the welded spot and its immediate vicinity, is therefore crucial for identifying sites of fatigue crack initiation and their criticality by comparing the stress levels.
3.1. Constraint concentration areas
Figure shows (a) the shape of the deformed specimen under the tensile stress of 6000 N, (b) the distribution of the normal stress σ33 in the plane of symmetry of the welded spot and (c) the distribution of the tangential stress σ23, always in the plane of symmetry of the welded point.
Figure 8. Analysis of the behaviour of the “welded-point” specimen under tensile-shear stress (a) deformation of the plates, (b) distribution of the normal stress σ33, (c) shear stress distribution σ23.
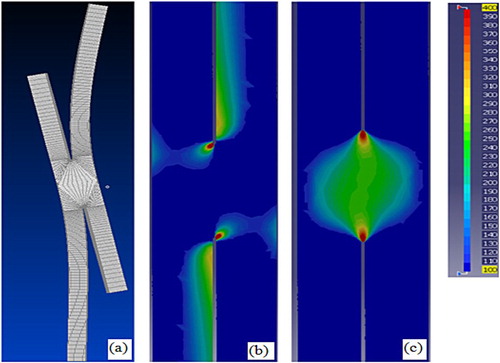
The two segments AB and CD thus appear well justified as places of study and comparison of the representative stresses existing within the points welded under a load of traction-shearing, since they contain the sites where the constraints are maximum. These sites are, in the case of a corrugated loading, those where the amplitude of the stresses is maximum; they are therefore critical areas from the point of view of fatigue.
3.2. Analysis of the influence of geometrical parameters on the distribution of stresses in the welded point
The observations of the fillet of the molten core on the sheets show a very variable shape of the notch bottom and of the interface between the sheets, even when all the test pieces examined are carried out with a protocol and similar welding conditions [Citation4]. Moreover, as Radaj and Sonsino [Citation3, Citation9–11] point out, the shape of the notch floor varies according to the welding conditions and is not uniform or identical over the entire periphery of the point. This variation in the geometry of the specimen in the area of the welded spot probably plays a considerable role in the dispersion of the lifetimes of the test pieces under identical conditions. In order to understand this phenomenon and to try to explain the two modes of ruin observed, we propose to analyse the influence of the parameters likely to play a role in the mechanical behaviour of the test piece. These parameters are the diameter D of the core, the distance d between the plates (or interface) and the radius R of the fillet of the molten core on the two sheets. In Figure these three parameters are mentioned.
Figure 9. Definition of the geometric parameters of the test specimen.
The parametric study is described and carried out within this paragraph. All the calculations carried out in this framework are assumed to be elastic. In order to facilitate the comparison base, the specimens are stressed in each case in tensile shear force by an effort of 6000 N.
3.2.1. Distribution and triaxiality of the stresses within the welded point on the segment AB and the diameter CD
The nature and the distribution of the stresses along the two comparison segments are established for the first time and presented in Figures and . The parametric study itself will be discussed below. Figure shows the evolution of each of the six components of the stress tensor on the segment AB of the upper sheet. Figure gives the same evolution on the diameter CD, always for the same loading of the test piece (traction of 6000 N).
Figure 10. (a) Representation of the six components of the stress tensor on the AB welded point (b) Representation of the six components of the stress tensor on the diameter CD of the welded point.
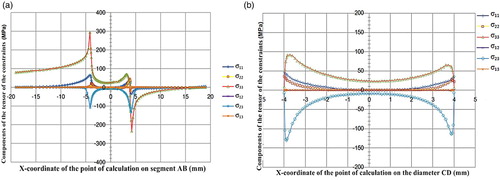
Figure 11. (a) Distribution of the normal stress σ33 on the diameter CD for three different values of the diameter of the welded point (b) Distribution and shear stress σ23 on the CD diameter for three distinct values of the diameter of the welded point.
At the level of the notch bottom to which the periphery of the molten core is related, a predictable stress peak appears very clearly in the two preceding figures because it is related to the concentration of stresses generated by the local geometry and the nature of the loading of the specimen.
It also appears that the components of constraints σ33 and σ23 are predominant. They are therefore the components of the most influential constraints on the mechanical strength of the welded point and will, therefore, be the main object of our numerical study.
The variability of the notch bottom and the interface between the sheets according to the test pieces can probably play a major role, which explains the dispersion of the results of the lifetimes of the test specimens tested. In order to understand their effect on the two modes of fatigue failure of the material, a sensitivity analysis of the parameters likely to play a role in the mechanical behaviour of the test piece is now discussed. This is the diameter D of the core, the distance d between the sheets and the radius R of the notch bottom (Figure ). The analysis will consist of varying these parameters and analysing their influence on the distribution of stresses on the two segments AB and CD.
3.2.2. Influence of diameter D of the welded-point nucleus
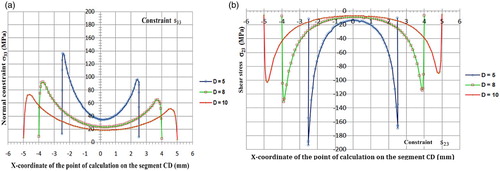
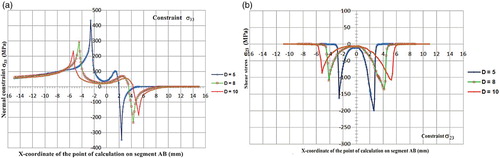
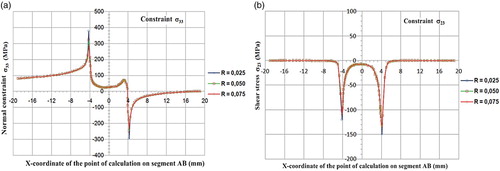
The test is carried out on specimens having a welded-point core with a diameter D equal to 5, 8 or 10 mm. The other two parameters, the interface between the two sheets and the shape of the notch (radius of the fillet), are kept constant at 0.15 and 0.075 mm, respectively. The graphs of Figures and relate the distribution of the normal and shear stresses as a function of the diameter of the core of the welded point.
Figure 12. (a) Distribution of the normal stress σ33 on the segment AB for three distinct values of the diameter of the welded point (b) Distribution of the shear stress σ23 on the segment AB for three distinct values of the diameter of the welded point.
Constraints on the diameter CD of the molten core.
Constraints on the segment AB (internal face of the sheet).
The maximum values on the diameter CD and the segment AB of the normal stresses σ33 and shear stresses σ23 are summarized in Table . Figures and give a graphical representation of CD and AB, respectively.
Table 1. Values of σ23max and σ33max on the diameter CD and the segment AB as a function of the diameter of the welded point for an applied stress-shearing force equal to 6000 N.
This first parametric study reveals the increase of the stresses σ33 and σ23 when the diameter of the core decreases, which seems quite logical with constant tensile force. Two other important lessons can be drawn from this study.
The tangential stress σ23 is preponderant in front of the normal stress σ33 on the diameter CD of the welded-point nucleus, which justifies the shear rupture of the molten core when this mode of ruin is observed. The ratio between σ23max and σ33max is about 1.4.
On the segment AB, located on the internal face of the sheet, it is the normal stress σ33 which clearly takes precedence over the tangential stress σ23 (ratio of the order of 2.7 between σ33max and σ23max). The rupture by cracking of the sheet is therefore justified on AB when the fatigue ruin occurs in this place. The cracking mechanisms are therefore not the same on the diameter CD and on the segment AB. There is competition between these two modes of ruin, one on the diameter CD in shear, the other in cracking on the internal face of the sheet. The respective crack propagation velocities lead one or the other of the two modes of ruin to win in the end. As such, it should be pointed out that a crack within one or both of the two sheets assembled by the welded point has always been observed in the case of shear rupture of the point. The inverse is more delicate to observe (beginning of cracking by shear of the molten core after rupture by cracking of one of the two plates) but it was in the framework of the work of thesis of Rossillon [Citation4].
3.2.3. Influence of the interface between the two sheets
Figure shows the evolution of the normal and shear stresses as a function of the interface between the sheets. The diameter of the molten core is taken equal to 8 mm for this study, the shape of the notch bottom is circular with a radius equal to half the interface. The test is carried out on spot-welded specimens with an interface between the two plates taken equal to 0.10, 0.15 and 0.20 mm respectively. The calculation results, in terms of stresses σ33 and σ23, are plotted on the diameter CD and the segment AB.
Constraints on the CD diameter of the molten core.
Constraints on the segment AB (internal face of the sheet).
Figure 13. (a) Distribution on the diameter CD of the normal stress σ33 for the three distinct values of the interface between plates (b) Distribution on the CD diameter of the shear stress σ23 for the three distinct values of the interface between sheets.
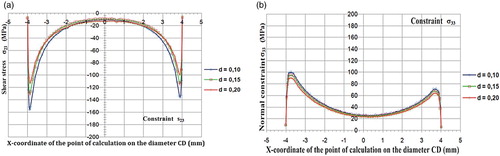
The maximum values on the diameter CD and the segment AB of the normal stresses σ33 and shear stresses σ23 are summarized in Table and are then plotted as a function of the value of the interface in Figure CD and AB, respectively.
Figure 14. (a) Distribution on the segment AB of the normal stress σ33 for the three distinct values of the interface between plates (b) Distribution on the segment AB of the shear stress σ23 (for the three distinct values of the interface between plates).
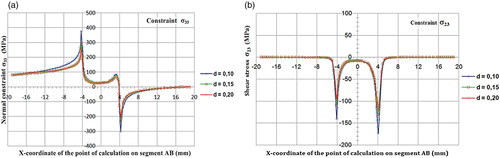
Table 2. Values of σ23max and σ33max on the diameter CD and the segment AB as a function of the interface between the two sheets for an applied tension-shear force equal to 6000 N.
The first observation that emerges from this table is that the stress level increases when the interface between plates decreases. The increase in stress, when passing from an interface of 0.2 to 0.1 mm, is more marked for the maximum shear than for the maximum normal stress: ratios for σ23max of 1.38 and 1.63 on CD and AB, respectively, against ratios of 1.13 and 1.42 for σ33max on CD and AB.
The tangential stress is always preponderant over the normal stress on the diameter CD, and this preponderance is accentuated when the interface decreases. The tendency is inverse on the segment AB: the normal stress is preponderant in front of the tangential stress but the ratio σ33max/σ23max decreases when the interface also decreases: it is 2.46 for d = 0.20 mm and increases to 2, when d = 0.10 mm.
3.2.4. Influence of the shape of the notch
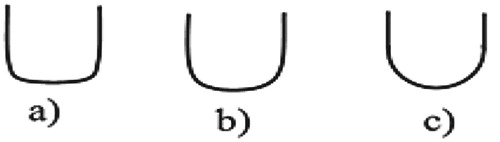
The study is carried out on spot-welded specimens, the fillet of the notch having a radius R equal to 0.025, 0.05 and 0.075 mm (Figure briefly describes the profile of the corresponding notch base to these three cases). The diameter of the molten core and the distance between the two sheets (interface) are equal to 8 and 0.15 mm, respectively, for this parametric study.
Figure 15. Different shapes studied from the notch bottom, as a function of the radius R of the fillet: (a) R = 0.025 mm, (b) R = 0.050 mm, (c) R = 0.075 mm.
Figures and show the distributions of the normal stresses σ33 and shear stresses σ23 as obtained by calculation on CD and AB, as a function of the radius of the fillet of the notch.
Constraints on the CD diameter of the molten core.
Constraints on the segment AB (internal face of the sheet).
Figure 16. (a) Distribution on the CD diameter of the normal stress σ33 for the three different values of the radius of the fillet in the bottom of the notch (b) Distribution on the CD diameter of the shear stress σ23 for the three different values of the radius of the fillet in the bottom of the notch.
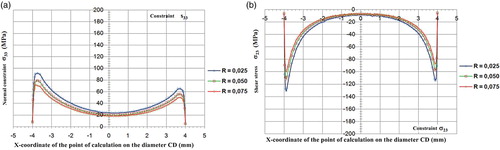
Figure 17. (a) Distribution on the segment AB of the normal stress σ33 for the three distinct values of the radius of the fillet at the bottom of the notch (b) Distribution the shear stress σ23 for the three distinct values of the radius of the fillet at the bottom of the notch.
The maximum values on the CD diameter and AB segment of the normal stress σ33 and the shear stress σ23 are summarized in Table . Figure and give a graphical representation of these maximum stress values as a function of the radius of the fillet.
Table 3. Variation of σ23max and σ33max on the diameter CD and the segment AB as a function of the radius of the fillet at the bottom of the notch between the sheets.
A particular point is to be noted as to the influence of the value of the radius of the fillet on the stress levels obtained. On the diameter CD, an increase in the radius leads to a decrease of the normal stress and of the shear stress. The same evolution is observed on the segment AB: the normal and maximum shear stresses decrease when the radius of the fillet increases. These results are logical because the acuity of the stress concentration in an angle or a shoulder decreases as the radius of the fillet increases.
The tangential stress σ23 is preponderant, over the diameter CD, in front of the normal stress σ33, as was also observed in the previous parametric studies. On the AB segment, the preponderance order is reversed. It even increases when the radius of the fillet increases. Indeed, one passes from a ratio σ33max/σ23max equal to 2.53 for R = 0.025 mm at a ratio equal to 2.90 for R = 0.075 mm. On the diameter CD, the ratio σ23max/σ33max is independent of the value of the radius of the fillet.
3.3. Justification of experimental sites for crack initiation by the calculation of stresses
The calculation of the finite element stresses carried out during this work revealed the very clear predominance of the normal stress σ33 in front of the tangential component σ23 on the segment AB of the internal face of the spot-welded specimen. Figure , on the left, shows schematically the distribution of these normal and tangential stresses on the segment AB. The stress peak observed on the distribution of each of the two components lies at the foot of the fillet of the molten core on the sheet, on the side where the latter transmits the tensile force. This rule was not defeated by any of the three parametric studies that were done. The cracking of the sheets with a priming on the internal face and then a propagation in the direction of the thickness of the sheet and then laterally in the sheet is therefore logical and supported by the calculations of the stresses, carried out on the internal side of the sheets.
Figure 18. (A) Distribution of the stresses (a) normal and (b) tangential along the segment AB (B) Distribution of the stresses (a) normal and (b) tangential along the diameter CD.
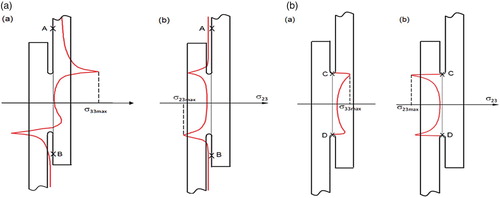
Figure , on the right, gives the same schematic representation as Figure on the left but on the minimum diameter CD of the molten core. On this diameter, it is always the tangential stress σ23 which takes precedence over the normal stress σ33, especially in the precise place where both reach their maximum values. This state of affairs has always been respected by each of the three parametric studies carried out. The ruin of the point welded by shear of the molten core, observed during the experiments mainly for high loading levels, is therefore plausible with regard to the distributions of the stresses obtained.
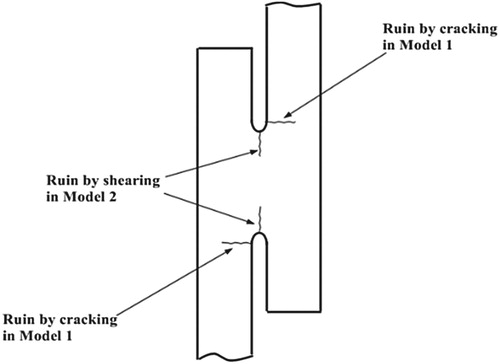
There is, in fact, a competition between the two modes of failure of the spot-welded specimen during tensile-shear fatigue tests. The respective stress concentrations on the internal face of the sheets and on the minimum diameter of the molten core simultaneously generate localized fatigue damage at the sites where the stresses are maximal. Figure describes the location of the sites of initiation and cracking of the specimen welded by point and subjected to tensile-shear.
Figure 19. Experimental sites for the initiation and cracking of the test piece.
3.4. Plate bending and stiffener influence
The behaviour of the specimen under tensile-shear loading reveals a more or less pronounced flexing of the sheets, depending on the thickness of the assembled sheets and the level of the traction load applied to the test piece. This inflection is related on the one hand to the shift of the resultant of the effort applied by the bits of the machine to the unit made up of sheet and the hold with the average line of the sheet by which forwards the tractive effort towards the welded point, and on the other hand at the distance between sheets noted after welding. The stresses existing in the upper sheet between the jaws of the machine and the welded point are the superposition of those related to the tensile force and those of the moment of flexion. The tensile stress due to the tensile force and the tensile stress also generated by the bending moment is added to the inner face of the upper sheet. The same tensile stress and the compression stress due to the bending moment are added to the tensile face. Figure gives a representation of the distribution of the normal stress σ33 on the two inner and outer faces of the upper sheet.
Figure 20. Longitudinal distribution of the stress σ33 on the internal faces of C to D and external of the sheet.
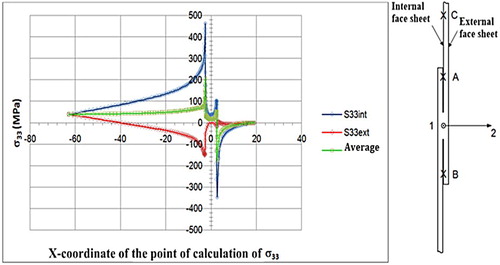
The constraints existing on one and the other of the two faces of sheet are very different as the form of the deformation of Figure (a) could enable it to foresee. The area of the welded point is, of course, one of the highest stress concentrations. In order to ensure a pure shear-to-shear stress, in particular for specimens of small thickness, a stiffener is mounted and remains on each test piece tested during the test in order to limit the bending of the sheets and consequently too great a rotation of the point welded around the axis 1 of the overall reference mark (Figures and (a)). The resulting sheet peeling is added to the overall shear of the welded spot and is very unfavourable in terms of the experimental life of the specimen in the absence of a stiffener. In order to measure qualitatively the influence of the presence of the stiffener on the states of the stress of which the sheets and the molten core are the seats, the calculations were carried out for three distinct cases:
test piece without stiffener,
test piece fitted with a stiffener with a lateral clearance of 0.2 mm,
test piece without play.
The modelling of the new boundary conditions generated by the stiffener is performed by means of the virtual contact pieces preventing the movement of certain zones of the test piece in direction 2 of the global reference mark.
In Figure , the distributions of the normal stress σ33 obtained in each of the three calculation cases on the inner face of the upper sheet were superimposed. The analysis of the results obtained unambiguously confirms the experimental observations made during the tests. There is practically no difference in stress peaks for the test specimen without stiffener and for which a stiffener with a clearance has been modelled. The possibility of moving in the interval corresponding to the existing clearance in direction 2 is sufficient to generate a behaviour analogous to that corresponding to the absence of stiffener.
Figure 21. Distribution of the normal stress σ33 as a function of the presence or not of a stiffener and the lateral clearance test piece stiffener.
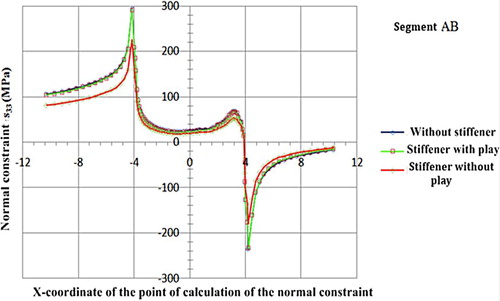
On the other hand, the presence of a stiffener without clearance induces a reduction in the peaks of stress observed at the foot of the fillet of connection of the molten core on the internal face of the sheet. This evolution of the stresses corroborates the experimental effect observed of the presence of a stiffener without play, namely an increase in the service life, i.e. a better fatigue strength of the welded point. The absence of stiffening test piece clearance makes it possible to maintain a pure shear stress of the welded point, whereas in its absence the stress becomes rapidly mixed (shearing-peeling), which is more damaging in this case.
Recall that the problem of bending the sheets and pivoting the welded point about the axis 1 is essentially linked to the relatively small width of the test pieces. In practice, and for the same type of tensile-shear stress, the transverse part of the mechanical component provides rigidity such that the rotation of the welded point about the axis 1 is made very difficult or even is simply prevented. The particular geometry of the spot-welded specimens does not have this transverse stiffness. The stiffener has appeared as a palliative to reproduce the maintenance in the plane of each sheet, in particular in the vicinity of the welded point.
4. Stress analysis in the case of the elastoplastic behaviour of the material
The high concentration of the stresses existing in the welded spot and in its immediate vicinity may cause local lamination in some cases of heavy loading, such as during the application of overloads. The objective of this section is to establish the distribution of the stresses from a modelling of the elastoplastic behaviour of the steel used to obtain a more realistic description of the real stresses in the most stressed zones, especially during the application of overloads. For this, a kinematic hardening was chosen.
The stress distribution for elastoplastic behaviour was calculated for two loading levels: 6000 and 10,000 N. The distribution of the stresses calculated with a purely elastic behaviour is superimposed on that of the elastoplastic behaviour in order to measure the relative difference between the results of the finite element calculations.
4.1. Load defined by a tensile force of 6000 N
Figures and show the distributions of the normal stresses σ33 and tangential stress σ23 on the segment AB and on the diameter CD. There is essentially a relative decrease in the stress peaks observed on the minimum diameter of the melting point near the bottom of the notch and at the fillet of the molten core on the assembled sheets. There is no change in the location of these stress peaks. The presumed seed sites, therefore, remain identical in the two cases of behaviour used. It is above all this point that appears to be the essential result, since it allows an elastic calculation, much faster in terms of calculation time, to locate the critical zones of the spot-welded specimen (Figure ).
Figure 22. (a) Distribution of the normal stress σ33 on the segment AB according to elastic or elastoplastic behaviour of the material (for a tensile force of 6000 N) (b) Distribution of the tangential stress σ23 on the segment AB according to the elastic or elastoplastic behaviour of the material (for a tensile force of 6000 N).
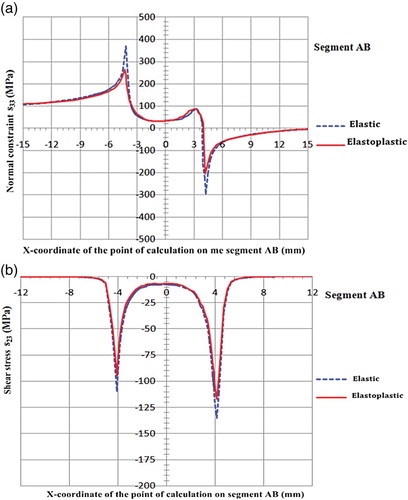
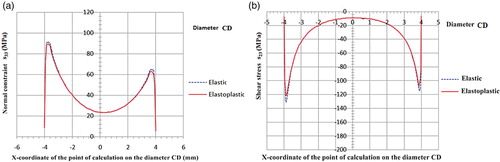
Figure 23. (a) Distribution of the normal stress σ33 on the CD diameter according to elastic or elastoplastic behaviour of the material (for a tensile stress of 6000 N) (b) Distribution of the tangential stress σ23 on the CD diameter according to the elastic or elastoplastic behaviour of the material (for a tensile stress of 6000 N).
4.2. Load defined by a tensile force of 10,000 N
Figure gives the representation of the normal stress σ33 on the segment AB for a traction load of the test piece of 10,000 N this time under the hypothesis of an elastic or elastoplastic behaviour. The difference between the stress peaks obtained for each of the two behaviours is marked but the localization of the peaks remains unchanged, validating the conclusions about the good correlation between the cracking sites observed experimentally and the prediction of the forecast of the sites of starting according to the computation results of the constraints.
Figure 24. Distribution of the normal stress σ33 on the segment AB according to the elastic or elastoplastic behaviour of the material (for a tensile force of 10,000 N).
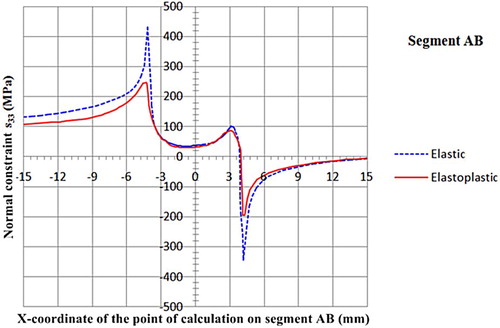
The time allowed for the calculation did not make it possible to go beyond this analysis but it very probable that one of the effects of the incidental overloads after the creation of a strong plastic deformation on the level of the fillet of the core is melted, that is to say the generation of residual stresses of compression in the same zone, which limits the damaging character of more the “small” cycles between two overloads. The observed beneficial effect of overloads in the long lifespan is probably related to the creation of these residual stresses. The same is not true for the diameter CD, as regards the residual stresses, which explains the occurrence of the shear breaks of the points at lower loading levels of the base cycles when they are superimposed regularly overloads. In other words, the beneficial effect of the overloads is manifested on the segment AB and not on the CD segment probably by the creation of compressive residual stresses on the critical zone of AB which does not exist on the diameter CD.
4. Conclusion
The modelling and the calculation of a specimen welded by point, solicited in traction – shearing made it possible to locate the critical zones or the most requested zones test piece. It is on the one hand about the sheet transmitting the tractive effort to the right of the fillet of the molten core of the point welded onto the sheet, and on the other hand very close to the bottom of the notch in the core melted on the diameter parallel with the direction of the tractive effort. Each one of these two zones is requested by multiaxial states of stresses which correspond mainly to traction-shearing but of different nature: for the first zone, the dominating tensile stress is very broad whereas for the second zone it is the shear stress which is dominating. From this point of view, the established model and the results of calculations carried out correlate in a very satisfactory way the experimental results obtained on the test-tubes welded by point. A parametric study was undertaken on several geometrical parameters, which testifies a certain dispersion for a batch to test-tubes produced with a particular adjustment of the parameters of welding. The diameter of the welded point, the average distance between the two assembled plates and the shape of the notch bottom by the radius of the fillet of the molten core on the sheets are the three elements whose sensitivity of the dispersion on the calculation of the stresses was evaluated numerically. In a general way, a very clear sensitivity was observed on the levels of constraints maxima existing in the critical zones of the test-tubes. Qualitatively, the study carried out justifies the dispersion observed in the experimental results of the lifespan even if the metallurgical risks also contribute and in a way are quite as significant to these dispersions. It should be noted indeed that the mechanically most requested zones are very affected zones thermally, and thus the seat of strong transformations of phases and microstructures. It would be interesting to connect the nature and the levels of constraints established in the critical zones of the test-tubes to the fatigue life of these test-tubes. In addition to the role of the gradient of constraints, extremely significant in the critical zones, a second element complicates the implementation of an approach in constraint for the estimate of the lifespan; it is about the characterization of the fatigue behaviour of the new microstructures existing in the most requested zones, very different from those of the base metal of which the sheets are made up.
Acknowledgement
This work is the result of research carried out in the laboratory of Institute Pascal, University Blaise Pascal of Clermont-Ferrand (France). I would like to thank Jean-Louis Robert, Nadjitonon Ngarmaim, Arnaud Mbainguebem, Djonglibet Wel-Doret and N. Kimtangar for their participation in the production of this document.
Disclosure statement
No potential conflict of interest was reported by the authors.
ORCID
Djonglibet Wel-Doret http://orcid.org/0000-0001-8669-1823
References
- Adib H, Jeong J, Pluvinage G. The three-dimensional finite element analysis of tensile-shear spot-welded joints in tensile and compressive loading conditions. Strength Mater. 2004;36(4):353–364. doi: 10.1023/B:STOM.0000041536.03924.d4
- Dancette S. Comportement mécanique des soudures par points: mécanismes et stratégies de prédiction dans le cas des tôles en acier pour automobile, Thèse de l’INSA LYON, 2009, N° d’ordre 2009 – ISAL – 0039.
- Radaj D, Sonsino CM. Fatigue assessment of welded joints by local approaches. Cambridge: Abington Publishing; 1998.
- Rossillon F. Influence des conditions de soudage sur le comportement en fatigue d’un acier THR Dual Phase soudé par point. Thèse de l’Université Blaise Pascal – Clermont II, Clermont-Ferrand, Clermont-Ferrand, 2007.
- Nielsen CV, Martins PAF, Zhang W, Bay NO. Numerical methods in simulation of resistance welding. Proceedings of the VI International Conference on Coupled Problems in Science and Engineering. Barcelona: International Center for Numerical Methods in Engineering (CIMNE); 2015. p. 322–333. doi: 978-84-943928-3-2.
- Ramos T, Braga DFO, Eslami S, Tavares PJ, Moreira PMGP. Comparison between finite element method simulation, digital image correlation and strain gauges measurements in a 3-point bending flexural test. Procedia Eng. 2015;114:232–239. doi: 10.1016/j.proeng.2015.08.063
- Jia JH, Zhang ZQ, Zhang C. Numerical simulation of stress intensity factor for socker weld toe cracks in small branch pipes. Procedia Eng. 2015;130:150–157. doi: 10.1016/j.proeng.2015.12.184
- Eshtayeh M, Hijazi A, Hrairi M. Nondestructive evaluation of welded joints using digital image correlation. J Nondestruct Eval. 2015;34:37. doi:10.1007/s10921-015-0310-z.
- Niu X, Glinka G. The weld profile effect on stress intensity factors in weldments. Int J Fract. 1987;35:3–20.
- Bezerra AC, Vieira LC, Rade DA, Scotti A. On the influence of welding residual stresses on the dynamic behavior of structures. Shock Vib. 2008;15:447–458. doi: 10.1155/2008/683506
- Ottersböck MJ, Leitner M, Stoschka M, Maurer W. Effect of weld defects on the fatigue strength of ultra high-strength steels. Shock Vib. 2008;15:447–458. doi: 10.1155/2008/683506