
 ?Mathematical formulae have been encoded as MathML and are displayed in this HTML version using MathJax in order to improve their display. Uncheck the box to turn MathJax off. This feature requires Javascript. Click on a formula to zoom.
Abstract
Aluminium alloys and intermetallic are being widely investigated as potential aerospace materials. In this study, metal flux has been employed as a synthesize method for different intermetallic phases. The considerable potential of aluminium liquid is demonstrated as a powerful synthesis solvent of important intermetallic phases such as ,
and CaMgSi.
The mechanical properties of the synthesized system have been estimated through the hardness analysis using Nano-indentation hardness test. The microstructure evolution and the phase analyses were examined using scanning electron microscopy (SEM) and X-ray diffraction (XRD). The interactions between intermetallic phases and the eutectic microstructure of molten flux is rather complex and yet to be fully understood. Thus, tracing of local chemistry on an atomic scale is crucial. The atom probe tomography technique is utilized to characterize the intermediate reaction steps of the flux-grown intermetallic phases. The study proposed a direct approach to investigate the involved reactions during the formation of the synthesized intermetallic phase.
1. Introduction
Al and Mg are two highly important lightweight metals that are commonly used in applications that require reduced vehicle weight to improve fuel economy. Innovations in design strategies are always directed toward weight-saving measures; therefore, it is common to employ lightweight materials [Citation1]. Other light elements such as Si, Ca and Zn are usually added to Al and/or Mg alloys to maximize their functionality. Al–Mg–Si alloys, for example, are versatile heat-treatable alloys with high strength/weight ratios. They are easy to extrude and have good hardening characteristics, and thus find application in a wide range of areas [Citation2]. The potential of these alloys to save weight, improve fuel economy, and decrease exhaust emissions has led to a growing research interest in understanding and discovering new intermetallic compounds that contain light metals, i.e. Al and Mg.
In general, studying the intermetallic phases of known compounds is an important subject in metallurgy. To create advances in the understanding and discovery of new intermetallic compounds, it is also desirable to employ other subjects, such as solid-state chemistry. The synthetic tool box for intermetallic compounds contains many powerful techniques. These techniques, such as arc melter and induction heating, involve very high temperatures that pose a serious limitation for these methods [Citation3]. High temperatures usually produce the most thermodynamically stable product and leave little room for kinetic control because of the high energies involved [Citation3]. For this reason, methods that permit reactions to be carried out at lower temperatures are preferable. A molten metal flux is a good example of such a method. Metal flux has been highlighted as an important tool for the exploration of intermetallic compounds. It has also been used as a medium for the synthesis of a new class of intermetallics. This approach allows the discovery of new materials as well as the growth of large crystals of known materials [Citation3]. The method for synthesizing alloys in this approach is simply to mix appropriate metals that will act as a flux. The aim is to lower the melting point of the solvent by forming eutectics. Moreover, a mixed flux introduces an additional avenue for controlling the reaction chemistry [Citation4]. It is not necessary to completely dissolve the elemental components of the desired product when using the metal flux methodology, as the flux will act as a transportation medium that can dissolve a component in one location while the product grows at another location in the sample container [Citation3].
Among the different fluxes used as media for the growth of single crystal phases, Al has been shown to be useful in the synthesis of several interesting intermetallic compounds, due to its good characteristics. It has a low melting point (660°C) and can dissolve a large number of elements. It dissolves readily in non-oxide acids. A large variety of intermetallic aluminides have been prepared from liquid Al, and many of them feature fascinating new structures. Many of these intermetallic aluminides are also key components in advanced Al alloys [Citation5–7]. In particular, the use of an Al/Mg mixture is of practical interest [Citation7]. The Al/Mg phase diagram exhibits a wide, low melting range (40–60 at.% Mg, ∼ 450°C) between two binary phases ( and
) [Citation7]. Moreover, Al/Mg mixtures have proven to be good solvents for the synthesis of silicides such as
and
(R = Gd, Dy, Y) [Citation4,Citation6].
In light of the information presented above, knowledge of the solidification process and of crystallization within molten Al is required. Here, the synthesis of technologically important phases from an Al metal flux is presented. Then, different characterization techniques such as X-ray diffraction (XRD), scanning electron microscopy (SEM), hardness test (HT) and atom probe tomography (APT) are applied to shed light on the growth mechanism of the different synthesized phases. The role of these synthesized phases on the mechanical properties of Al-Mg based alloy was also conducted in this study.
2. Experimental
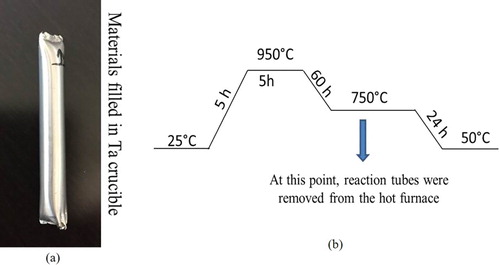
Appropriate quantities of Al sheet (99.9%) obtained from (Sigma Aldrich), Mg metal slugs (99.9%) obtained from (Sigma Aldrich), metallic Ca shots (99.9%) obtained from (Acros Organics) and a Si wafer (99.9%) obtained from (SVM) were weighed out in a 15/15/3/3: Mg/Al/Ca/Si mmol ratio in an glove box and placed in a Ta crucible ((a)). The Ta crucible was welded shut using an arc-melter (Edmund Buhler Gmbh). After the welding was completed for both sides of Ta crucible, it was placed into a quartzite ampule. The Ta crucible was used to prevent Al vapour from attacking the quartzite, which would lead to loss of the protective atmosphere. After placing the Ta crucible in a sealed, evacuated quartzite ampule and slightly elevating it off of the bottom of the ampule by shaking the quartzite ampule, the ampule was gently placed into an electric furnace. The sample was heated from room temperature to 950 °C and held for 5 h, cooled to 750 °C over a period of 60 h and then held at 750°C for 20 h, at which point, the reaction tubes were removed from the furnace. A chart illustrating this temperature programme is shown in (b). The tube was then quickly inverted and quenched in cold water. The samples were then extracted from the Ta tube.
Figure 1. Synthesis of intermetallic phases: (a) Used Ta crucible for synthesis. (b) Illustration Chart of the applied temperature programme.
Samples for SEM – EDX analysis were prepared via a standard metallurgy procedure. This has been done by mounting the disk samples in a goniometer holder and mechanically grinded by distilled water and SiC paper of 600, 1200 and 2400 grit size. This step is followed by final polishing to eliminate scratches by using colloidal silica on cloth and diamond paste with a size of 6, 3, 0.5, 0.2 and 0.1um, respectively. The samples were then ultrasonically cleaned using acetone. The samples were examined using an SEM (Quanta 200) equipped X-ray spectroscopy (EDX). XRD was carried out after the samples were prepared by grinding the specimens in an agate mortar to have a powder shape. The analysis was carried out using a STOE STADIMP powder diffractometer using – radiation operated at 40 kV.
The mechanical properties of the synthesized material have been tested using hardness measurements. HT was performed using a Nano-indentation system (Nano test Vantage) with a load of (200 mN) and dwell time of (10 s). The hardness value has been estimated by averaging the values of eight measurements taken at different locations in the sample.
Preparation of APT-tips has been done using the focused ion beam (FIB) method. FIB-based, site-specific specimen preparation was performed by using Helios FEI. APT experiments were performed in a Cameca LEAP 4000 HR using a laser pulse mode. A diode-pumped (Nd:YAG) solid-state laser operating in the frequency-tripled ultraviolet region with a wavelength of 355 nm, a pulse duration of approximately 12 ps and a repetition rate of 200 kHz was used. The best analytical parameters were chosen by performing different test analyses. The best parameters for analysis are found to be 50 pJ for the laser pulse energy and 50 K for the base analysis temperature. The detection rate was set to 0.01 ions per pulse. The location of the laser spot on the specimen was monitored using a charge – coupled device camera. Data reconstruction was carried out using the IVAS software [Citation8].
3. Results and discussion
The XRD diffraction pattern for the synthesized material is shown in . The acquired diffraction pattern was found to match the calculated patterns for ,
and
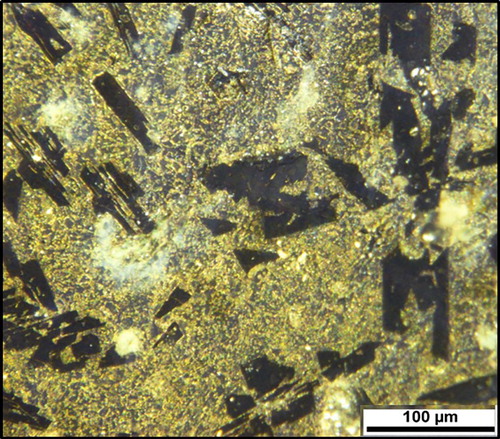
. An optical micrograph of the microstructure is shown in . Areas of different contrast are readily seen in the image, and they indicate the presence of different phases within the microstructure.
Figure 2. XRD diffraction pattern for the synthesized material.
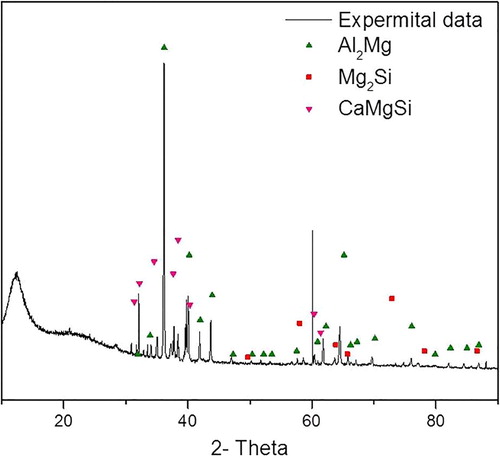
Figure 3. Optical micrograph of the microstructure of the synthesized material.
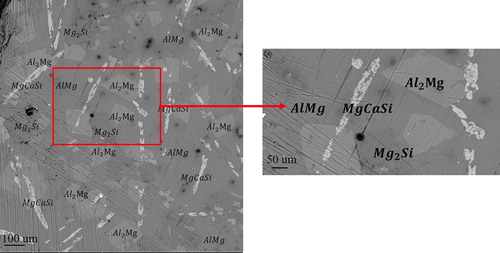
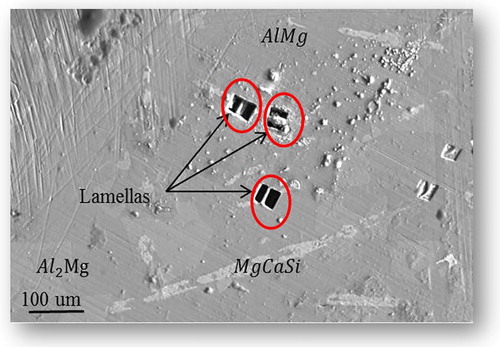
SEM / EDX analyses were used to quantify the different phases that exist in the material. Selected pieces of synthesized material were arranged on double-sided carbon tape adhered to an Al sample puck. An example of an SEM micrograph is shown in . Using EDX analysis, the several phases that exist in the synthesized material were identified as,
,
and
as shown in (a). The existence of multiple phases in the microstructure can be explained as follows; the use of a stoichiometric reaction does not result in the formation of a pure single crystalline phase but instead yields a mixed phase powder composed of
,
and
[Citation4]. Reactions carried out in pure Mg flux do not usually yield any of the title compounds, such as
. However, the addition of Al may promote this reaction. Al usually acts either as a transport agent within the flux or as a solvent for the incorporation of elements that have low solubility in molten Mg. Al metal has been shown in the literature to be a highly reactive solvent that facilitates the growth of aluminide intermetallics [Citation9]. However, the observed four phases in (a,b) might be in their metastable stage. This would be expected due to the absence of a real single crystal phases from the microstructure as has been shown in . According to the EDX analysis that was applied to different regions of the sample and is presented in , Al exists in the matrix in the form of
and
, and the incorporation of Al atoms into the observed products, such as
and
, was not recorded. (b) shows a magnified SEM image of the synthesized material. Parts of crystals of
, which are apparent as broken fragments, are shown in this figure along with some amount of the
,
and
phases. EDX analyses of several surfaces on the
regions show an average atomic percent composition of 33.8 at.% Ca, 32.35 at.% Mg, 30.95 at.% Si and 2.09 at.% Al, while the average atomic percent composition of
was determined to be 64.39 at.% Mg, 34.27 at.% Si, 0.19 at.% Ca and 1.15 at.% Al. The chemical compositions of the other surrounding regions measured by EDX analysis were found to be 60.03 at.% Al, 36.34 at.% Mg, 3.53 at.% Ca and 0.1 at.% Si, which closely matches the
composition , and 52.10 at.% Al, 46.86 at.% Mg, 0.76 at.% Ca and 0.28 at.% Si, which closely matches the
composition. In general, the separation of a single crystal phase from the surrounding flux or matrix has been carried out by centrifugation or by dissolving the excess flux in sodium hydroxide (NaOH) because the Al can be eaten away by NaOH [Citation10]. Dissolving the excess flux or separating out a crystalline product is outside the scope of this study, and so a powder composed of multiple phases was used instead.
Figure 4. SEM micrograph of the microstructure of the synthesized material: (a) multiple phases in the microstructure. (b) A magnified image of the existing phases.
The correlation between the microstructure and the mechanical properties is also of great interest, as the ternary system of Al, Mg and Si is known to have excellent age – hardening characteristics [Citation11]. Moreover, alloying Al/Mg elements with SiC particles has been recorded to yield a good ultimate tensile strength of 250 ± 6 MPa [Citation12]. In our study, the evaluation of the hardness properties of the synthesized material was performed. According to the hardness measurement, the material has a relatively high hardness value of (2.8 ± 1 GPa). This hardness value proves that our synthesized material shows a good hardness behaviour. However, using of other mechanical tests are required in order to make a quantitative estimation about the overall mechanical properties. The relationship between the observed hardness behaviour and the microstructure of the synthesized material requires an investigation at an atomic scale. Through such an investigation, the correlation between the macroscopic and microscopic properties can be understood. Moreover, an atomic scale investigation will allow the transition between different phases to be followed.
Knowledge of the mechanisms that govern the growth of an intermetallic product from a molten flux is limited. Therefore, the APT technique is used to investigate this mechanism. APT involves one of the most spectacular microscopes in existence. It provides a three-dimensional (3D) image at the atomic scale with single-atom sensitivity in which each atom or isotope in the image is defined. The fundamental data format is the 3D position and identity of individual atoms in a volume that contains potentially millions of atoms; thus, different information about the analysed material can be gleaned. Detailed information about APT can be found in Ref [Citation13,Citation14]. The first step in preparing an APT needle-shaped specimen using site-specific FIB preparation is to select an area of interest as marked in Figure .
Figure 5. SEM micrograph shows the selected areas of interest for the subsequent APT analysis.
A number of FIB-based preparation techniques have been developed to create APT tips that contain the features of interest. The methods are described elsewhere [Citation15]. illustrates the followed steps to prepare APT tips with the aid of the standard lift-out method by using FIB. After imaging the surface of the sample using the backscattering signal, the region of interest has been selected ((a)). A FIB-deposited platinum strip was added to protect the surface and mark the region to be extracted ((b)). The platinum layer is typically 2–3 um wide and 2.5 um thick with a length depending on the geometry of the region of interest (3 um in our case). After depositing the Pt layer, staircase-shaped cross sections are cut on both sides beyond the Pt layer, resulting in a lamella of approximately 16 um × 12 um × 15 um in size ((c)). A micrometer-sized needle called an Omniprobe, is then introduced and attached to the lamella via Pt welding ((d)). After the lamella can be cut free, it will be manipulated and positioned on commercial arrays of the post (micro-tip Tm arrays) in flat-topped form ((e)). The last step is to convert a left-out lamella in (f) into a sub-100-nm diameter sharp needle. This is accomplished through a series of annular milling steps with progressively smaller beam currents and inner diameters ((a)) [Citation14], until the desired radius has been achieved. The ideal shape of the tip prepared via this technique is shown in (b).
Figure 6. Steps of preparation of APT sample using lifted-out method (a) Selection of the region of interest. (b) Deposition of Pt protection layer. (c) Cutting cross section lamella. (d) Lift out the sample by using Omniprobe. (e) An image of a commercial microtip array. (f) Lift-out lamella attached to the Si microtip by using Pt deposition.
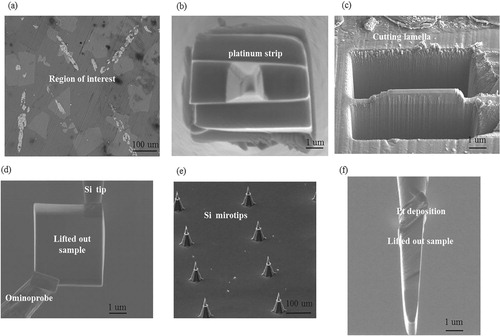
Figure 7. An annular milling of the tip. (a) Milling pattern [Citation14]. (b) The final ideal shape of APT tip.
![Figure 7. An annular milling of the tip. (a) Milling pattern [Citation14]. (b) The final ideal shape of APT tip.](/cms/asset/4aab0a9d-d31b-4365-a904-5c7ed4eae6ad/tusc_a_1542869_f0007_oc.jpg)
After the preparation of several APT tips have been done, the first APT experiment was devoted to analysing the Al/Mg matrix or flux region (). The radius of the tip apex was estimated to be approximately 50 nm ((a)). The data set measured is a collection of 5 million atoms ((b)). The data quality was assessed by observing the desorption map. (c) shows the desorption map, the hit map that forms during analysis, of the data set in (b). It is clear from (c) that the hit density at the detector is almost homogenous, which indicates that the atoms are field-evaporated from the specimen in a highly controlled order. An accurate chemical composition for the whole reconstructed volume shown in (b) is given in . The distribution of impurity atoms such as Si and Ca in the Al/Mg flux is shown in the 3D atom map in (b).
Figure 8. APT analysis of the flux region. (a) SEM micrograph showing the measured radius at the apex of the prepared APT tip. (b) The reconstructed volume showing the distribution of different elements. (c) The desorption map.
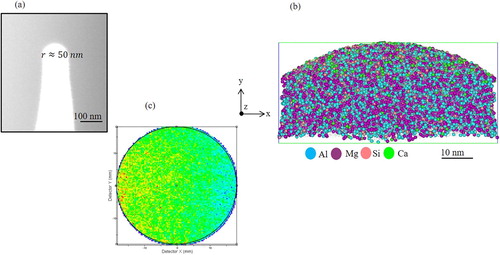
Table 1. A summary of the phases observed in the synthesized material and their chemical composition according to APT measurements.
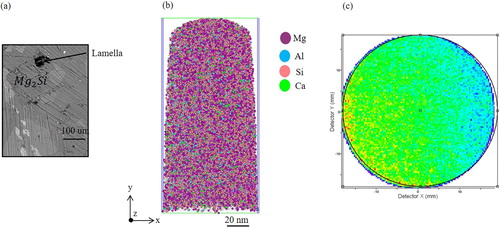
Transitioning from the matrix Al/Mg or the flux region toward a single phase region of comprises the next step of the analysis. In this case, lamella that has been extracted from the sample to prepare an APT tip was selected from the
region ((a)). Performing APT analysis for this tip yielded a collection of 20 million atoms ((b)). Once again, the desorption map in (c) demonstrated that the APT data set is of good quality. The chemical composition of the whole reconstructed volume is shown in . This chemical composition is in fairly good agreement with that obtained via EDX analysis. The distribution of impurity atoms of Al and Ca is also shown in (b).
Figure 9. APT analysis of the flux region. (a) SEM micrograph showing the position of lamella for the prepared APT tip. (b) The reconstructed volume showing the distribution of different elements. (c) The desorption map.
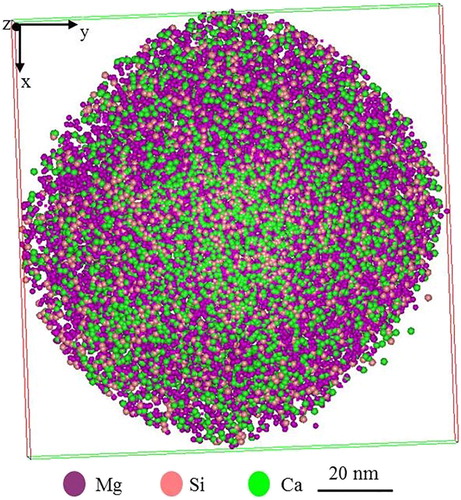
To understand the growth mechanism, it is important to perform APT analysis in an area of the sample that contains both flux and intermetallic phases. In this case, the position for cutting the lamella was selected to include the area of at the interface between the phases and the flux. The top view of the reconstructed volumes of the analysed tips that were prepared from selected areas in is shown in . In this case, the presence of different phases is clearly visible. Moreover, the APT analysis for the region corresponding to the phase is shown in . In this case, the distribution of Al was not observed. This observation confirms the idea that Al does not incorporate into the final product. The chemical composition of the reconstructed volume is shown in .
Figure 10. APT analysis of the interface region between the flux and intermetallic phases. The top view of the reconstructed volumes illustrates the distribution of different phases.
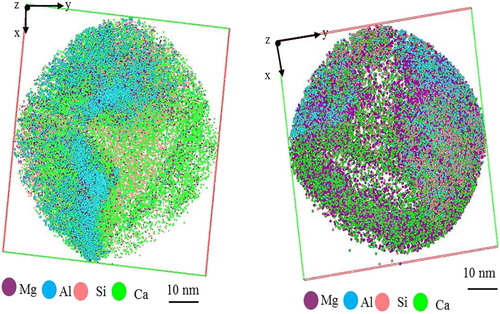
Figure 11. APT analysis for the at phase region.
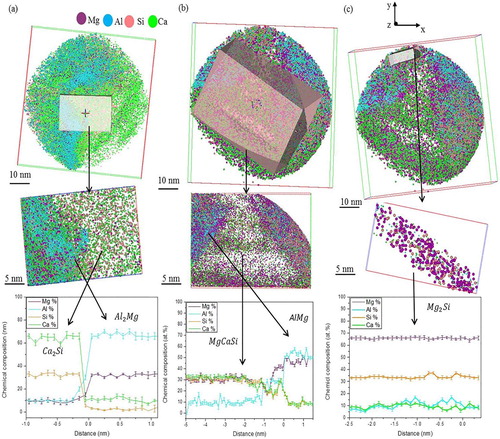
To follow the transition between these phases, different small volumes from the reconstructed volumes in were cut and quantified individually. Quantification of the chemical composition was done using the concentration depth profile method. Detailed information about this method can be found elsewhere [Citation13,Citation14]. A series of the small cutting volumes together with their corresponding depth concentration profiles are shown in . According to the depth concentration profiles drawn from (a), the chemical compositions for the observed phases have been identified as and
. For the observed phases in (b), the depth concentration profile shows that these phases are corresponding to
and
. Moreover, there is one region in the reconstructed volume represents the presence of
phase according to the depth concentration profile ((c)). The chemical composition of the
and
phases are also shown in .
A eutectic flux composed of Mg and Al solidifies at 450°C, but above this temperature, it becomes very viscous and difficult to remove. This could explain the presence of both and
phases ((a,b)). Before the crystallization of
takes place, the formation of a solid solution between
and
is also observed ((a,c)). The probability of forming this solid solution was investigated theoretically using density functional theory (DFT) [Citation15]. In this study, the authors reported the substitution of Mg atoms in the
unit cell with Ca atoms and substitution of Ca atoms in the
unit cell with Mg atoms, which clarified the possible formation of an
–
solid solution.
Theoretical investigation of this system also confirmed that of the
-type, where all of the Ca atoms that occupy one type of 4c site are completely substituted by Mg and all other 4c sites remain occupied by Ca, is energetically quite stable. The APT analysis presented in proposes that the transition path is happening in which solid solution of
and
reacts with AlMg phase. It can be expected that the transition produces the
phase through an intermediate
–
solid solution. It has been reported that
is the only equilibrium phase in the
–
pseudobinary system [Citation16].
Based on this quantitative APT analysis above together with the DFT study [Citation16], the transition from the molten flux to the single crystal phase of can be summarized as follows:
From the SEM micrograph () and the above quantitative APT analysis, it seems that the processed reaction to form a single phase of CaMgSi is a peritectic reaction, in which the two solid phases in equilibrium and the transition has been performed from solid and liquid phases to different solid phases. However, the shape of CaMgSi phase dose not matches the recorded shape of this crystal [Citation4]. This might be explained in the term of short annealing time resulting in uncomplete shape of this crystal.
The presence of this mixture of phases in the microstructure, in addition to the distribution of impurity atoms, is responsible for the good hardness characteristics of our synthesized material.
In this study, the considerable potential of aluminium liquid is demonstrated as a powerful synthesis solvent of important intermetallic phases such as ,
and CaMgSi. The atom probe tomography technique is utilized to characterize the intermediate reaction steps of the flux-grown intermetallic phases. The study proposed a direct approach to investigate the involved reactions during the formation of the synthesized intermetallic phase by using the APT technique.
Figure 12. A series of the small cutting volumes together with their corresponding depth concentration profiles. (a) At and
phases. (b) At
and
phases. (c) At
phase.
4. Conclusion
The great potential of Al liquid as a powerful solvent for the synthesis of important intermetallic phases is demonstrated. Different important phases such as ,
and CaMgSi have been synthesized. The APT technique provides critical knowledge of the Nano-scale evolution of microstructure. Intermediate steps in the mechanism of the flux – grown intermetallic phases were investigated. The proposed path of the reaction is:
The processed reaction to form a single phase of CaMgSi is peritectic reaction, in which the solid phase of is reacted with liquid Al and solid solution of
–
to produce other intermetallic phases, i.e.
and CaMgSi.
A combination of physical metallurgy and solid-state chemistry might be used as a direct approach to improve the production of Al alloys and improve their mechanical properties.
Disclosure statement
No potential conflict of interest was reported by the author.
ORCID
Muna S Khushaim http://orcid.org/0000-0002-0941-7086
Additional information
Funding
References
- Hirsch J, Al-Samman T. Superior light metals by texture engineering: optimized aluminum and magnesium alloys for automotive applications. Acta Mater. 2013;61(3):818–843. doi: 10.1016/j.actamat.2012.10.044
- Hasting HS, Froseth AG, Andersen SJ, et al. Composition of β″ precipitates in Al–Mg–Si alloys by atom probe tomography and first principles calculations. J Appl Phys. 2009;106(12):123527. doi: 10.1063/1.3269714
- Kanatzidis MG, Pottgen R, Jeitschko W. The metal flux: a preparative tool for the exploration of intermetallic compounds. Angew Chem. 2005;4(43):6996–7023. doi: 10.1002/anie.200462170
- Whalen JB, Zaikina JV, Achey R, et al. Metal to semimetal transition in CaMgSi crystals grown from Mg−Al flux. Chem Mater. 2010;22(5):1846–1853. doi: 10.1021/cm9033275
- Sieve B, Gray DL, Henning R, et al. Al flux synthesis of the oxidation-resistant quaternary phase REFe4Al9Si6 (RE = Tb, Er). Chem Mater. 2008;20(19):6107–6115. doi: 10.1021/cm801554d
- Ma X, Chen B, Latturner SE. Synthesis and properties of New multinary silicides R5Mg5Fe4AlxSi18–x (R = Gd, Dy, Y, x ≈ 12) grown in Mg/Al flux. Inorg Chem. 2012;51(11):6089–6095. doi: 10.1021/ic202735b
- Ma X, Lu J, Whalen JB, et al. Flux growth and magnetoresistance behavior of rare earth zintl phase EuMgSn. Inorg Chem. 2013;52(6):3342–3348. doi: 10.1021/ic302828p
- Manual of Ivas 3.6.6- software programe – CAMECA - www.cameca.com/service/software/ivas.
- Latturner SE, Kanatzidis MG. RE(aual2)nAl2(AuxSi1−x)2: A New homologous series of Quaternary intermetallics grown from aluminum flux. Inorg Chem. 2008;47(6):2089–2097. doi: 10.1021/ic701799z
- Canfielda PC, Fiska Z. Growth of single crystals from metallic fluxes. Philosophical Magazine Part B. 1992;65(6):1117–1123. doi: 10.1080/13642819208215073
- Chakraborti N, Lukas HL. Thermodynamic optimization of the Mg-Al-Si phase diagram. Calphad. 1992;16(1):79–86. doi: 10.1016/0364-5916(92)90041-U
- Valdez S, Campillo B, Perzo R, et al. Synthesis and microstructural characterization of Al–Mg alloy–SiC particle composite. Mater Lett. 2008;62(17–18):2623–2625. doi: 10.1016/j.matlet.2008.01.002
- Miller MK. Atom probe tomography: analysis at the atomic level. New York: Kluwer Academic/ Plenum; 2000.
- Gault B, Moody MP, Cairney JM, et al. Atom probe microscopy. Springer Series in Materials Science. New York: Springer; 2012.
- McKenzie WR, Marquis EA, Munroe PR. Focused ion beam sample preparation for atom probe tomography. Microscop Sci Technol Appl Edu. 2010;1:1800–1810.
- Imai Y, Mori Y, Nakamuras S, et al. Energetic prediction of Mg2Si–Ca2Si pseudobinary system using first-principles calculations. J Alloys Compd. 2013;558:179–187. doi: 10.1016/j.jallcom.2012.12.083