
 ?Mathematical formulae have been encoded as MathML and are displayed in this HTML version using MathJax in order to improve their display. Uncheck the box to turn MathJax off. This feature requires Javascript. Click on a formula to zoom.
ABSTRACT
The purpose of this paper is to examine the spillover of returns, information and volatility of returns, and conditional variance-covariance between the stock markets of developed countries namely the United States of America, the United Kingdom and China (US, UK and CH) and the stock markets of Gulf Cooperation Council (GCC) countries (Kuwait, United Arab Emirates, Qatar, Saudi Arabia, Oman, and Bahrain) using daily returns spanned from 2 March 2003 to 9 December 2010. We consider shocks and volatility spillover model by applying a multivariate generalized autoregressive conditional heteroskedasticity (MGARCH) model using; MGARCH-BEKK to identify the source and magnitude of volatility and shock spillover. We get the correlation between GCC markets is positive, indicating that there is a common factor which is driving the markets towards the same direction. Evidence shows that the own-shocks and volatility in GCC markets are highly significant. Cross-information spillover effects, as another observable trend, are found between Qatar and Oman. Furthermore, the results show that UA is significantly affected by spillover (return, shocks and volatility) from developed markets, while there have been no significant effects seen from Kuwait markets. This study takes a new empirical look in the sense that the models incorporating all the countries under investigation are estimated jointly utilizing multivariate GARCH-BEKK formulation. In addition, this paper should be interesting for academicians as well as practitioners. Including those interested in modelling multivariate volatility for financial market risk management.
1. Introduction
The volatility of the stock market is growing rapidly with the general observation that stock markets around the world are becoming strongly connected and more inter-dependent. [Citation1] stated that the interest of the volatility of the stock market has comprehensively extended beyond developed markets to move further towards the emerging markets because the investment in emerging markets is a good alternative to investment in developed markets, this is evidenced by the clear increase in the share of global capital markets invested in the former. As noted by [Citation2], emerging markets obviously exhibit a higher degree of volatility, higher average returns and lower correlations in comparison with developed markets. Tables and display this volatility behaviour. Here it worth noting that the GCC countries stock markets are relatively new compared to those of the advanced markets. The Kuwait Stock Exchange is one of the oldest organized markets in the Arab Gulf region, which commenced operations in 1983, followed by the Saudi market in 1985, while the UAE market was officially launched in 2000. The six countries in the Arabian Gulf Cooperation Council (GCC), namely KSA, the UAE, Qatar, Oman, Bahrain and Kuwait have become the latest “emerging markets” in the Middle East. This region has developed significantly over the last decade, and such a progress has been contributed by many profitable factors such as the GCC accounts for 45% of global oil reserves, 16% of the world oil production and 20% of world gas reserves. In fact, an impressive reality is that the combined stock markets of the GCC region are larger than the Hong Kong stock exchange and nearly 1/3 the size of the London stock exchange(see [Citation3]) (Table ).
Table 1. Descriptive statistics of all markets’ log-returns.
Table 2. The correlation between all markets’ log returns.
Table 3. The correlation of square returns (volatility) between all-time series.
The choice of the international stock market for this study is not randomly singled out, but it has been motivated by some important factors. The choice of the US stock market, to name an instance, is due to the fact that it is the world’s largest market where it was placed in the first rank in the world in terms of GDP in 2010. In addition, the US has strong political and economic relations with GCC countries. On the other hand, the UK is vitally selected in this study because of its historical importance to GCC countries, as well as being the fourth largest stock market in the world and ranked the sixth in GDP in 2010 and prevails as the strongest in the Euro region stock markets. On the other hand, China became the fastest growing emerging economy in the world, recently, where it ranked second in terms of GDP in 2010.Footnote1
We will now turn tore viewing some of the recent studies on the GCC market spillover. [Citation4] have recently examined the extent of the stock market integration among the GCC countries with the developed market (US and Europe) using the ARDL modelling approach utilizing the monthly data over the period from May 2002 to April 2009. The authors note that the GCC nations are not fully integrated and there still exist arbitrage opportunities between some of the markets in the region. Moreover, their results suggest no evidence of co-integration between the GCC stock markets and developed markets. Unlike above-mentioned investigation, [Citation5], in turn, examine the dynamic conditional covariance and correlation between equity markets of developed markets (US and UK)with two of the GCC countries (UAE and Kuwait) over the period from October 2005 to October 2009utilizing the VEC-MGARCH. Their results indicate that GCC Countries seem to suggest higher correlations in the region in comparison with the global one. [Citation6] investigated the volatility spillover among the Arab Gulf emerging markets, using the VAR-GARCH, with the BEKK specification. They have concluded that the high own-volatility spillover and a high degree of own-volatility are persistent in all GCC markets during the period from January 2003 to January 2009. The authors in [Citation7] attempt to study whether the emerging Gulf markets of Saudi Arabia and Bahrain in conjunction with the US market do exhibit a co-integrating relationship. Specifically, they employ a bivariate VEC-EGARCH model to explore the transmission of information and volatility spillover between the Gulf markets over the period from October 1998 to October 2003. Their finding suggests that even the markets are not co-integrated, the Gulf markets do share some information flows. Specifically, there is seen to be an asymmetric volatility spillover from the smaller though more liberal and accessible Bahraini market to the larger and less accessible Saudi market. [Citation8] investigated the relationship among stock market returns from six GCC countries using the VAR model on weekly data over the period 1997–2000 and discovers a substantial evidence of inter-dependence among the GCC markets. For more discussion from a mathematical point of view about the option pricing, see [Citation16].
Previous studies appear to ignore some economic factors affecting the spillover of the mean returns and volatility such as the capital inflows to the GCC countries. Here one may note that the capital flows increased by about ten times in 2009 compared to 2003. In addition, portfolio investment (bonds and equity) of US holding in GCC had also increased substantially from 994 million in 2003–12,704 million in 2009. Furthermore, Table shows the portfolio investment (bonds and equity) of GCC holding in the US increased as well from 84,411 million in 2003–391,227 million in 2008 and to 352,822 million in 2009.
Table 4. Total of foreign portfolio holdings of U.S. securities and U.S. portfolios holding of GCC (millions of USD).
Motivated by the large movements of capital flow in and out of the GCC markets, our objectives are to analyse the fundamental forces which drive volatility in GCC stock markets. Specifically, we will focus on how and to what extent is the volatility in the individual GCC equity markets driven by shocks occurring in the US, UK and China equity markets. Furthermore, the above studies have used a bivariate modelling approach to identify the volatility spillover, while this paper considers a volatility spillover model by applying a multivariate BEKK-GARCH model of [Citation9], for which a BEKK representation is adopted, for each of the GCC against the US, UK and China using daily returns for the last-8 years.
Taking into account all economic coefficients such as (mean, shocks and volatility) spillover as well as the bi-directional effects, we present whether the efforts for more monetary, economic and financial integration have fundamentally altered the sources and intensity of volatility spillovers to the individual stock market. This BEKK formula makes us detect the volatility of the market in terms of increasing or decreasing ([Citation10]).
2. Data and methodology
The daily data are taken from Data Stream database for all countries (GCC countries, US, UK, China) under investigation. The market indicators of spanned from 2 -3- 2003 to 9 -12- 2010, yielding a total of 2070 daily observations. The indices are Bahrain all share (Bahrain), Saudi Tadawul all share – TASI – (Saudi Arabia) FTSE (United Kingdom), S&P 500 (United State), Kuwait SE Kuwait Companies (Kuwait), ADX General (United Arab Emirate), Oman Muscat Securities (Oman),Qatar Exchange index (Qatar) and Shanghai index (China). At time , the daily return of market
are measured in local currency and given by,
where
is the daily closing price of market
.
Figures and display the plots of the moving daily price and returns for all series which clearly indicate that all returns have constant mean but time-varying variances. Similarly, figures in Table also support this hypothesis. The analysis is based on a multivariate AR(1)-GARCH(1,1)-BEKK model, in the mean equation presented as the return of the series of GCC country at time
and returns of the developed country at time
. The conditional mean of the process is modelled as an vector autoregressive VAR (1) model as,
(1)
(1)
(2)
(2)
where
Figure 1. Plot movement price of GCC stock markets, and the returns of all series.
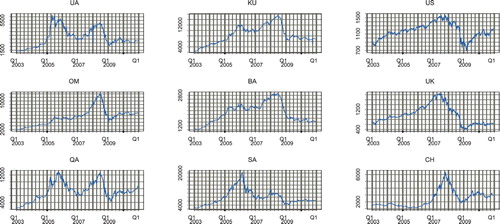
Figure 2. Plot movement price of GCC stock markets, and the returns of all series.
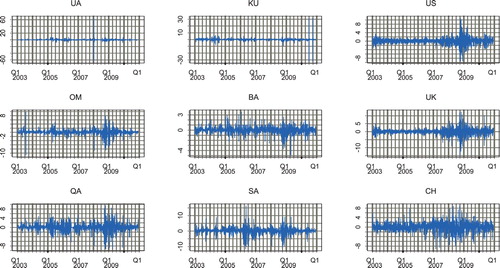
Equation (1) shows that the conditional expected return equation accommodates each market’s own returns and the returns of other markets are lagged by one period. Assuming that have a time-varying conditional variance that
where the index is
and
are (1 = United Arab Emirates(UA), 2 = Oman(OM), 3 = Qatar(QA), 4 = Kuwait(KU), 5 = Bahrain(BA), 6 = Saudi Arabia(SA), 7 = either one of the named developed countries (US, UK and CH)). The matrix entries
represent the degree of mean spillover effect from market
to market
, for example,
measures the degree of mean spillover effect from the Saudi Arabia market to the Oman market.
The conditional variance-covariance of the process is specified as multivariate GARCH-BEKK formulation introduced by [Citation9] and given as,
(3)
(3)
where,
Variance-covariance matrix is given as
where
must be positive definite for all
.
In General, as in our case, where
is a component of GCC countries and
represents developed markets or GCC countries,
presents the variance of the market as in
and
otherwise, it presents the co-variance relation between markets
and
. In the conditional variance model
and
above are
parameters matrices with
being a lower triangular matrix. The entries of a matrix
measure the market shocks degree from the market
to the market
, for instance,
means the degree of Qatar market shocks to Oman market shocks or shocks spillover from Qatar to Oman, and
as the elements of matrix
is presented by the degree of effects of the conditional volatility between market
and market
, for illustration and clarity,
indicates the volatility spillover from Oman to Qatar.
The BEKK model ensures that the condition of +ve definite for variance-covariance matrix which is necessary for the estimated conditional variance of the linear combination
to be greater than, or equal to, zero. The specification of this model displays that the variance-covariance matrix of equation depends on the square and cross products of innovation
and volatility
for each market lagged by one period.
In General, the condition covariance matrix is well specified based on the model chosen, which is the MGARCH model. For estimating that model, using a given
observation, the quasi-maximum likelihood (QML) approach estimates the parameters underlying the Gaussian log-likelihood function as demonstrated below:
(4)
(4)
This log-likelihood function is maximized using [Citation11], which is also known as the BHHH algorithm.
3. Empirical result
To start with the basic distribution properties for stock returns for the sample under consideration, Table reports that all the sample returns are positive and fluctuate around zero except the UK statistics which show that the mean is negative. In general, the average returns of GCC countries are higher than that of developed countries which is common for emerging markets and is consistent with previous studies ([Citation12–14]). Qatar and Oman have the highest returns among the GCC countries; also at the same time having high volatility, which is deemed reasonable. Table also tabulates that the log returns for all periods (except for the UA) are negatively skewed, that the distribution of the log-returns tends to be in the negative side, which means, in general, all returns display more losses than gains. Nevertheless, the magnitude of these losses differs from a market to another as these stock market series have the typical fat tail feature. Table also shows that the log-returns have a distribution with a kurtosis value of more than 3 which is described as leptokurtic relative to normal. The normality test statistic and Q-statistic of non-serial correlations are rejected at 5% significance level. Finally, the ARCH LM test statistic is highly significant and this is a signal for the presence of ARCH effects for all markets indicating the legitimacy of using ARCH/GARCH models. In Figures and , one may observe that the daily market prices and returns appear to suggest time-varying volatility and leverage effects. A starting point of many studies on the financial integration deals with the examination of the traditional measure underlying the degree of integration of stock markets, i.e. correlation coefficients among financial markets. Table displays the pairwise correlation matrix which indicates strong evidence of coexistent correlations among the markets. The correlation between all the markets is positive which indicates that there is a common trend/factor that is driving the markets in the same direction. The highest correlation coefficients pairs among GCC are between Oman – Qatar and Oman – Bahrain, while the lowest correlation coefficient found between Saudi Arabia – Bahrain. Meanwhile, the highest correlation coefficients pairs among developed markets and GCC markets are found to be between UK-Oman. The UK-US markets also display a strong correlation. However, the correlation between all these stock market returns is low (i.e. less than 5%). As a matter of fact, the correlation matrix does possess a weakness, where empirically it does not imply causality and merely presents an insight into short-run market linkages, but fails to account for long-term arbitrage activities in stock markets (see [Citation15]). Therefore, we need to make some inferences from other empirical tests.
Referring to the sign and significance of the coefficients of the return shocks at period
in mean Equation (1), Table shows the tendency for market returns to depend on past observations in the GCC markets as well as developed markets. All markets conditional mean shows the high significance of the own-mean spillover in general, except KU and SA. The coefficient
(where i is GCC countries and 7 is US) is significant which indicates that GCC markets are influenced by the world factor of the US markets (except KU and BA). On the contrary, only Oman and Qatar markets are influenced by the markets in the UK. Interestingly, none of the GCC markets are influenced by China. Surprisingly, only Oman and Qatar markets are influenced by both world markets such as the US and UK. One may argue that the US mean returns on average improve the market sentiment in the GCC markets leading to an upward adjustment of earning forecasts for the markets as both tend to move in the same positive direction.
Table 5. Returns, shocks and volatility spillover effects from BEKK model.
The BEKK model parameter estimates for Equation (3) are also provided in Table . We report only the estimated parameters of interest, (the ARCH effects) which present the shocks spillover and
which presents the volatility spillover. In relation to the shocks spillover or information coefficient, the results indicate that own-shocks spillover generated from its origins are highly significant. The cross-information spillover effects are found to be positive and highly significant for country pairs QA-OM, SA-UA whilst it is significant and negative for pairs SA-OM and UA-developed markets. Turning to the volatility spillover coefficient,
, it is expected that all the markets have a positive and a significant own volatility affected by its own past volatility. The bi-directional volatility spillover is found to be strong between the UA-OM markets. The unidirectional volatility spillover is found to be positive for BA-SA, while it is negative for QA-OM, QA-SA, and SA-UA. On the other hand, the volatility spillover generated from developed markets to GCC markets are US-UA, US-OM and UK-UA. Furthermore, volatility generated from China has no effect on GCC markets, with the exception for the UA. There is no cross-market volatility persistence from the KU market to any other markets.
Finally, the validity of BEKK- MGARCH models is essential in identifying whether a well specified MGARCH model can provide us with reliable inference and estimates diagnostics graphics for MGARCH models can be fulfilled by examining plots of the autocorrelation of the sample (ACF) and Q-Q plot in Figures and . The ACF plot for the residual of the BEKK model is conclusively non-significant except a very rare which we can conclude that all residual series have no serial correlation (white noise). Table shows the evidence that our model serves as an adequate model for underlining data.
Figure 3. ACF and Q-Q plot of residual of fit BEEK-VAR-GARCH (1, 1).
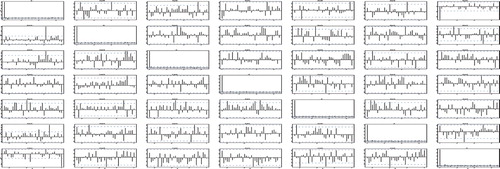
Figure 4. ACF and Q-Q plot of residual of fit BEEK-VAR-GARCH (1, 1).
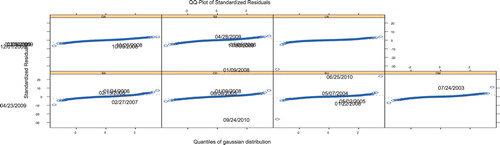
Table 6. Models diagnostic.
4. Conclusion
In this study, we present the first- and second- moment interactions (return and volatility spillover) among the GCC emerging stock markets with that of three developed markets (US, UK and CH) over the period of 2 March 20039 December 2010. The conditional mean is specified using VAR(1) formulation while variance-covariance is modelled utilizing GARCH-BEKK technique to analyse the issue for the countries under investigation. We have discovered that the correlation between GCC markets is +ve which obviously indicates that there is a common factor that is driving the markets towards the same direction. However, the correlation between all series is low. It is clear from the highly significant results of their own-mean spillover that the trend surrounding the markets’ returns seems to be dependent on past observations on the GCC markets as well as developed markets except for KU and SA. Moreover, the results indicate that the own-shocks spillover and own- volatility spillover in all markets in GCC as well as developed market are highly significant. The influence of the US proves to be substantial on the GCC markets mean returns except on KU and BA, while it has no influence on GCC market shocks except displaying a negative significance with the UA. Moreover, the US has influence on the volatility of the UA and OM markets. The UK has influence on mean returns of OM and QA markets, and the influence of the UK on shocks has been noticeable between the UA and BA. There has been no influence from CH on GCC except on shocks or volatility of the UA markets. Among the GCC markets, the mutual influence has been found only in mean returns between UA, OM and QA, and the volatility spillover only found between UA and BA, and it is also found from SA to KU and from BA to SA. In return, BA is also influenced by SA. The only market that spreads its influence on a developed market is SA, where it has a significant effect on the UK. On the other hand, KU has not shown an influence on any markets in GCC. The model diagnostic supports the methodological approach adopted in this study.
Disclosure statement
No potential conflict of interest was reported by the author.
Notes
1 The GDPs of advanced countries are available in the International Financial Statistics of International monetary fund.
References
- Hartmann M, Khambatta D. Emerging markets: investment strategies of the future. Colombia J World Business. 1993;28(2):83–104.
- Bekaert G, Harvey CR. Emerging equity market volatility. J Finan Econ. 1998;43:22–77.
- Rao A. Analysis of volatility persistence in Middle East emerging equity markets. Stud Econ Finan. 2008;25:93–111. doi: 10.1108/10867370810879429
- Marashdeh S. Stock market integration in the GCC countries. Inter Res J Finan Econ. 2010;37:102–114.
- Fayyad D. The volatility of market returns: a comparative study of emerging versus mature markets. Inter J Bus Manag. 2010;5(7):5. doi: 10.5539/ijbm.v5n7p24
- Nekhili R, Naeem M. Volatility spillovers among the Gulf Arab emerging markets. The 3rd Inter Conf Comput Finan Econo Limasso Cyprus. 2009:1–14. Available from: https://www.researchgate.net/publication/44257074Volatility_spillovers_among_the_Gulf_Arab_emerging_markets
- Abraham S. Information transmission between the Gulf equity markets of Saudi Arabia and Bahrain. Res Inter Bus Finan. 2006;20:276–285. doi: 10.1016/j.ribaf.2005.05.007
- Assaf A. Transmission of stock price movements: the case of GCC stock markets. Rev Mid East Econ Finan. 2003;1(2):171–189. doi: 10.1080/1475368032000139305
- Engle RF, Kroner KF. Multivariate simultaneous generalized GARCH. Econ Theory. 1995;11:122–150. doi: 10.1017/S0266466600009063
- Engle RF, Ng VG, Rothschild M. Asset pricing with a factor ARCH covariance structure: empirical estimates for treasury bills. J Econ. 1990;45(1–2):213–238. doi: 10.1016/0304-4076(90)90099-F
- Berndt E, Hall R, Hausman J. Estimation and inference in nonlinear structural model. Annals Econ Soc Meas. 1974;3:653–665.
- Ng A. Volatility spillover effects from Japan and the US to the Pacific-basin. J Inter Money Finan. 2000;19:207–233. doi: 10.1016/S0261-5606(00)00006-1
- Shamiri A, Abu Hassan A. Modelling and forecasting volatility of the Malaysian and Singaporean stock indices using asymmetric GARCH models and non-normal densities. Malaysian J Math Sci. 2007;1:83–102.
- Shamiri A, Isa Z. Volatility transmission: what do Asia-Pacific market expect? Stud Econ Finan. 2009;27:299–313. doi: 10.1108/10867371011085147
- Narayan KP, Smyth R. Cointegration of stock markets between New Zealand, Australia and the G7 economies: searching for co-movement under structural change. Austr Econ Papers. 2005;44(3):231–247. doi: 10.1111/j.1467-8454.2005.00262.x
- Nouri K, Abbasi B. Implementation of the modified Monte Carlo simulation for evaluate the barrier option prices. J Taibah Univer Scim. 2017;11(2):233–240. doi: 10.1016/j.jtusci.2015.02.010