
ABSTRACT
A accurate, precise and robust isocratic HPLC method has been developed and validated for simultaneous determination of Rifampicin and Ofloxacin. The chromatographic separation was carried out on Kinetex C18, 100 A Phenomenex column with a mixture of 0.03M Potassium dihydrogen phosphate buffer pH 3.0: Acetonitrile (55:45) as mobile phase at 230 nm. The retention times were 2.91 and 4.87 min for Ofloxacin and Rifampicin, respectively. Calibration plots were linear over the concentration range 1–5 and 2–10 µg/ml for Rifampicin and Ofloxacin, respectively. The method was validated for linearity, sensitivity accuracy, precision, and robustness. Percent recoveries were found to be close to 100% with low variability. Fractional factorial design with four factors was chosen for robustness testing. The volume of acetonitrile and flow rate showed significant effect on retention factor of both the drugs and asymmetry factor of ofloxacin. The method may be adopted for routine analysis at industry.
1. Introduction
Tuberculosis (TB) remains a major global threat, the control of which has become more complicated since the emergence of multidrug-resistant (MDR) and extensively drug-resistant strains of Mycobacterium tuberculosis. In 2015, there were an estimated 10.4 million new (incident) TB cases worldwide and 480,000 new cases of multidrug-resistant TB (MDR-TB). There were an estimated 1.4 million TB deaths in 2015 and it remained one of the top 10 causes of death worldwide [Citation1]. Current therapy against Tuberculosis is ineffective due to several reasons including lengthy treatment time, hepatotoxicity and various side effects of conventional drugs, and premature self-termination by patients [Citation2]. Thus, combination therapy is a key of reducing chances of resistance by shortening the duration of treatment, making newer drug combinations availability an urgent requirement.
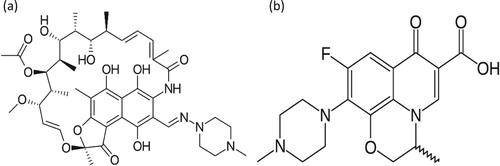
Rifampicin (RIF) (Figure (a)) is a complex semisynthetic macrocyclic rifamycin class of antibiotic derived from Streptomyces mediterranei [Citation3], used for the treatment of tuberculosis and other infectious diseases [Citation4–7]. It is categorized one of the first line antituberculous agents. RIF acts via the inhibition of DNA dependent RNA polymerase, leading to a suppression of RNA synthesis and cell death. Due to rapid emergence of resistant bacteria it is restricted to treatment of mycobacterial infections, where the customary use of combination drugs delays resistance development, and the treatment of asymptomatic meningococcal carriers [Citation8]. In recent years, fluoroquinolones such as ofloxacin (OFX) or moxifloxacin (MXF) have appeared as a promising new therapy and are frequently used in the treatment of drug-resistant cases [Citation9]. Moreover, clinical trials have found that fluoroquinolones may also be useful in the treatment of drug-susceptible M. tuberculosis in order to shorten the treatment [Citation10]. OFX (Figure (b)) is a synthetic fluoroquinolone antibacterial agent that inhibits the supercoiling activity of bacterial DNA gyrase, halting DNA replication [Citation11].
Figure 1. Structures of (a) Rifampicin, (b) Ofloxacin.
As per various research work, it had been concluded that inclusion of OFX to first line drug combination containing rifampicin showed synergism in terms of better efficacy and being of potential use in drug resistant as well as drug-susceptible isolates [Citation12,Citation13]. Hence, RIF and OFX are proposed to be formulated as combination therapy by our research group to widen the anti-tubercular effect in both resistant as well as susceptible isolates. As a part of fabrication of microparticles based dry powder inhaler drug delivery system of RIF and OFX, development of suitable assay method for the simultaneous estimation of both the drugs is the prerequisite [Citation14]. From the thorough literature survey, various methods have been reported for the determination of RIF [Citation15–22] and OFX [Citation23–25] individually and in combination with other drugs. However, high performance liquid chromatographic (HPLC) method for the simultaneous determination of RIF and OFX in combination has not yet been reported.
The aim of the present study was to develop accurate, precise and selective reverse phase HPLC assay procedure for the simultaneous estimation of RIF and OFX in synthetic mixture. The validation of proposed method is done according to the ICH guideline ICH Q2 (R1). Quality by design has become an important concept for pharmaceutical industry since the time it was first initiated by the USFDA [Citation26]. Quality by design approach utilizes statistical concepts along with experimental design plans aiding method development and validation as an efficient and fast tool. The method has to be validated in compliance with regulatory requirements for demonstrating its suitability when used. In order to study the simultaneous variation of the factors on the considered responses, a multivariate approach using design of experiments is recommended in robustness testing [Citation27]. Generally the large numbers of experiments required by standard designs applied in Response Surface methodology discourage their use in the validation procedure. Among the various experimental designs, fractional factorial design (FFD) as a response surface was preferred for prediction of nonlinear response and also due to its flexibility, in terms of experimental runs and information related to the factor's main and interaction effects [Citation28]. Hence, in line with the notion and keeping the current FDA requirements in mind while pursuing the research considering QbD based approach, the objective of our study was to develop a novel, simple, accurate, robust and specific HPLC method suitable for quality control of RIF and OFX using FFD design for robustness testing.
2. Materials and methods
2.1. Materials
Analytically pure RIF and OFX were purchased from Swapnroop drugs and pharmaceuticals, Aurangabad, India. PLGA 75:25 used in preparation of synthetic mixture was received as gift sample from Evonik Degussa India Pvt. Ltd., Mumbai, India. All solvents and chemicals used were of analytical grade, purchased from Merck Specialities Pvt. Ltd., Mumbai, India.
2.2. Instrumentation
A HPLC system, with LC solutions data handling system (Shimadzu-LC2010-CHT, Kyoto, Japan), with SPD-M20A PDA detector and an auto sampler was used for the analysis. The data was recorded using LC 2010 solutions software version 1.25. Analytical balance (Shimadzu AUW220 balance, Japan), Vacuum filtration assembly (TID 15, Mumbai, India) and Ultrasonic bath sonicator were used during the study.
2.3. Preparation of standard solutions
Ten milligrams of standard RIF and OFX were accurately weighed, transferred to 10 ml volumetric flasks separately, dissolved in acetonitrile and then volumes were made up to the mark with acetonitrile, to obtain solution containing 1000 µg/ml. Aliquots of the stock solutions were appropriately diluted with acetonitrile to obtain working standards of 100 µg/ml solutions of RIF and OFX.
2.4. Chromatographic conditions
Various solvents in different ratios such as water and acetonitrile along with potassium dihydrogen phosphate buffer were tried. The chromatographic separation was achieved on Kinetex C18, 100 A Phenomenex column (250 mm × 4.6 mm, 5 µm) at room temperature (25 ± 2°C) using optimized mobile phase consisting of 0.03M potassium dihydrogen phosphate buffer pH 3.0: acetonitrile (55:45). The mobile phase flow rate was 0.8 ml/min, injection volume 10 µL and run time was 10 min. The analysis was performed at 230 nm, using mobile phase as diluent. The standard solutions of different concentrations were filled in vials and kept in autosampler. The mobile phase was prepared daily, degassed by ultrasonicator and filtered through a 0.45-µm membrane filter prior to use.
2.5. Method validation
The HPLC method was validated in terms of linearity, sensitivity, precision, accuracy, robustness in accordance with ICH Q2 (R1) guideline and system suitability test as per USP [Citation29,Citation30].
2.5.1. System suitability test
The system suitability test was carried at a 1 and 2 µg/ml standard solution of RIF and OFX respectively by five replicate injections. Various parameters like peak area, tailing factor, theoretical plates, and resolution and retention time were evaluated.
2.5.2. Linearity
The linearity of an analytical method is its ability, within a given range, to provide results that are directly, or through a mathematical transformation, proportional to the concentration of the analyte. Different volumes of standard solutions of drugs were injected to obtain a concentration range of 1–5 µg/ml of RIF and 2–10 µg/ml for OFX, in five replicates. The linearity in terms measured peak areas versus corresponding concentration of drugs were estimated by ordinary linear regression analysis. The slope, intercept (with respective confidence intervals) and correlation coefficient (r2) were calculated and evaluated. Furthermore, the homoscedasticity of the variances along the regression line of each drug was verified using the Bartlett's test [Citation31].
2.5.3. Sensitivity
The sensitivity of method was measured in terms of Limit of Detection (LOD) and Limit of Quantification (LOQ). LOD and LOQ of the developed method were calculated from the standard deviation of the response and slope of the calibration curve of drugs using the formula as per ICH guideline,
Limit of detection = 3.3 × σ/S
Limit of quantitation = 10 × σ/S
Where, “σ” is standard deviation of y intercepts of regression lines, “S” is Slope of calibration curve.
2.5.4. Precision
The precision of the developed method was evaluated by performing Intra-day and Inter-day precision studies. Intra-day precision was carried out by performing three replicates of three different concentrations (1, 3 and 5 µg/ml for RIF; 2, 6 and 10 µg/ml for OFX) on same day and peak area measured was expressed in terms of percent relative standard deviation (% RSD). The inter-day precision study was performed on three different days using mentioned concentrations of both drugs in triplicate and % RSD was calculated.
2.5.5. Accuracy
The accuracy of the method was assessed employing the standard addition method [Citation32], where sample containing synthetic mixture of Rifampicin, ofloxacin and PLGA were spiked at three different concentrations levels of 50%, 100%, and 150%. Briefly, recovery studies were carried out by spiking three different amounts of RIF standard (1, 2 and 3 µg) and OFX standard (2, 4 and 6 µg) to the synthetic mixture containing RIF (2 µg/ml) and OFX (4 µg/ml). Recovery studies were performed in triplicate by calculating the recovery and % RSD for both the drugs.
2.5.6. Robustness testing using 24–1 fractional factorial design
In the present study, robustness of HPLC analytical method for simultaneous estimation of rifampicin (RIF) and ofloxacin (OFX) was determined by 24–1 fractional factorial design (FFD). In the present study, four independent factors were selected based on the criticality of factors observed during trial runs, chromatographic intuition and experience gained from previous studies. The effect of changes on parameters like, acetonitrile volume in mobile phase composition (A), buffer concentration (B), flow rate (C) and wavelength (D) on the retention time of both drug, resolution and asymmetric factor of OFX was examined.
To quantitatively analyze the deviation of the considered responses from the original value, the ranges of factors examined were deliberately changed from the optimum method settings of both drugs. The four factors with their deliberate changes in terms of high and low level are as shown in Table . The data generated were analysed using Design Expert (Version 10.0, Stat-Ease Inc., Minneapolis, MN, USA) statistical software. All experiments were performed in randomized order to minimize the bias effects of uncontrolled factors.
Table 1. Experimental factors and levels used in FFD.
2.6. Analysis of synthetic mixture
The synthetic mixture of drugs viz. RIF, OFX with PLGA 75:25 polymer was prepared and assay of drugs in synthetic mixture was analyzed as per below mention procedure. PLGA 75:25 is chosen as polymer for synthetic mixture as we aim to formulate dry powder inhaler of the two drugs using PLGA 75:25 as polymer in order to provide sustained release properties. The synthetic mixture comprised of RIF: OFX (1:2) and drugs: polymer (1:1), the ratio mimicking the formulation composition. Accurately weighed 60 mg of synthetic mixture equivalent to 10 mg of RIF and 20 mg OFX was transferred in to 10 ml volumetric flask and dissolved in 5 ml acetonitrile. Then the solution was sonicated for 5 min and made up the volume up to 10 ml with acetonitrile. The solution was filtered through Whatman filter paper no. 42 wetted with acetonitrile and further diluted to obtain 1 µg/ml of RIF and 2 µg/ml of OFX.
3. Results and discussion
3.1. Optimization of chromatographic conditions
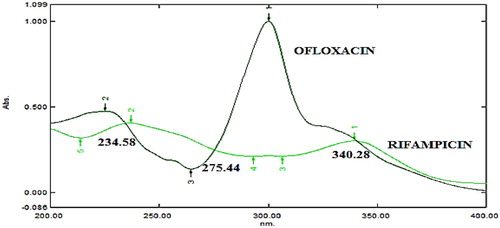
The optimization of chromatographic conditions were done with a view to develop HPLC method for the simultaneous determination of RIF and OFX in bulk and in pharmaceutical dosage form. For the selection of wavelength, 10 µg/ml standard solutions of RIF and OFX were scanned in the spectrum mode between 200 and 400 nm using acetonitrile as a blank. Both drugs absorbed appreciably at 230 nm, which was selected as the detection wavelength (Figure ).
Figure 2. Zero order overlay spectra of Rifampicin and Ofloxacin.
Various mobile phases comprising different ratios of water, acetonitrile and potassium dihydrogen phosphate buffer were tried. Water and acetonitrile when used as mobile phase in different ratios lead to early elution of both drugs giving sharp peak of RIF but tailing was observed in OFX peak. Hence, various ratios of different strengths of potassium dihydrogen phosphate buffer and acetonitrile were tried that gave acceptable peak shape of RIF and OFX and resolution. Finally, mobile phase comprised of 0.03M potassium dihydrogen phosphate adjusted to pH 3.0 with ortho-phosphoric acid and acetonitrile in ratio of 55:45 v/v gave acceptable retention time OFX (2.91 ± 0.447 min) and RIF (4.87 ± 0.395 min) at 230 nm and 0.8 ml/min flow rate. The injection volume to carry out chromatography was set at 10 µL.
3.2. System suitability parameters
System suitability testing in HPLC method showed that the method was suitably performed under the optimized conditions, and % RSD was found less than 2%, for system suitability parameters: Rt (For RIF, 4.87 ± 0.395; for OFX, 2.91 ± 0.448), area (For RIF, 23714.2 ± 1.083; for OFX, 76786.4 ± 0.122), and resolution (7.42 ± 0.343). Moreover, theoretical plates, 3576.34 ± 0.893 and 7262.54 ± 1.819 as well as tailing factor 1.35 ± 0.523 and 1.266 ± 0.706 for OFX and RIF, respectively were obtained.
3.3. Method validation
3.3.1. Linearity
The linearity of an analytical method is its ability, within a given range, to provide results that are directly, or through a mathematical transformation, proportional to the concentration of the analyte. The RIF and OFX showed a good correlation coefficient (r2 = 0.9985 and 0.9994 respectively) in the proposed concentration range 1–5 µg/ml for RIF and 2–10 µg/ml for OFX. Homoscedasticity of variance was confirmed by Bartlett's test and the response of peak area for both drugs showed homogenous variance that was exemplified by the χ2 value less than the tabulated value (Table ). Thus, from the obtained results, there was no further need of weighting and transformation approach. Figure shows overlay HPLC chromatogram for linearity of RIF and OFX at 230 nm.
Figure 3. Overlay HPLC chromatogram for linearity of RIF and OFX at 230 nm.
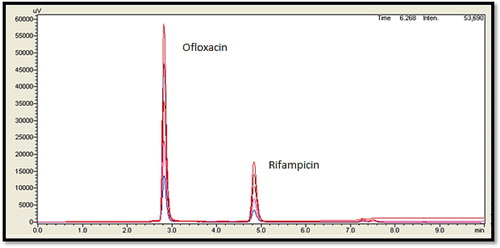
Table 2. Analytical validation parameters for RIF and OFX by HPLC method.
3.3.2. Sensitivity
LOD for RIF and OFX was found to be 0.0921 and 0.0914 µg/ml while LOQ was found to be 0.2790 and 0.2771 µg/ml respectively indicating the sensitivity of method (Table ).
3.3.3. Precision
The experiment was repeated three times in a day (Intra-day precision) and the average %RSD values of the results were calculated. Similarly, the experiment was repeated on three different days (Inter-day precision) and the average % RSD values for peak area of RIF and OFX was calculated. Results of intra-day and inter-day precision expressed in terms of %RSD less than 2 confirm precision of the method (Table ).
3.3.4. Accuracy
The mean percentage recovery at three levels, 50%, 100% and 150% after spiking with standard were in the range of 99.37–100.80% for RIF and 98.14–101.32% for OFX which were within acceptable ranges of 100 ± 2% (Table ). Good agreements between actual and determined values were found that confirm the accuracy of the method. The % RSD less than 2 for both drugs suggest suitability and applicability of the method for routine drug analysis.
3.3.5. Robustness
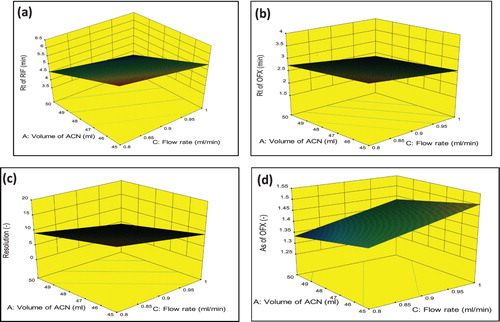
As defined by the ICH, the robustness of an analytical procedure refers to its capability to remain unaffected by small and deliberate variations in method [Citation33]. In the present study, four independent factors, i.e. acetonitrile volume in mobile phase composition (A), buffer concentration (B), flow rate (C) and wavelength (D) were selected based on the criticality of factors that was observed during trial runs, chromatographic intuition, and experience gained from previous optimization studies. The experiments were carried out based on the experimental domain, and the qualitative responses studied were the retention factor of RIF (Response 1), retention factor of OFX (Response 2), resolution of OFX (Response 3) and asymmetric factor of OFX (Response 4). Graphical interpretation in form of response surfaces and perturbation plots showed the correlation of the effect of the factors on the retention factor of each drug. Perturbation plots reveal the change in response from its nominal value with all other factors held constant at a reference point, and steepest slope or curvature indicates sensitiveness to specific factors. The Pareto chart is useful for checking the significance of factors, where effects above the Bonferroni Limit are almost certainly significant; effects above the t-value limit are possibly significant and effects below the t-value limit are not likely to be significant. The Pareto chart reveals that each selected had important effects on selected responses in decreasing order: For response 1, A > C > B > AB > D; for response 2, C > A > B = AB > D = AC = AD; for Response 3, A > C > B > AD > AC > D as well as for response 4, C > AB > A = D > B as shown in Figure . Perturbation plots indicated that small variation in volume of Acetonitrile and flow rate had significant effect on each response as shown in Figure . The 3D response surface plots based on the equation were generated as a function of the significant variables while the third variable was held constant at a specified level, usually the proposed optimum. From the three-dimensional response surface plots (Figure ), it is revealed that an increase in volume of acetonitrile content of mobile phase and flow rate produced an increase in Rt of RIF, Rt of OFX, As of OFX and decrease in resolution of both drugs.
Figure 4. Pareto charts showing the effect of factors and interaction on responses (a) Response 1: Rt of RIF (b) Response 2: Rt of OFX (c) Response 3: Resolution of OFX (d) Response 4: Assymetry factor of OFX.
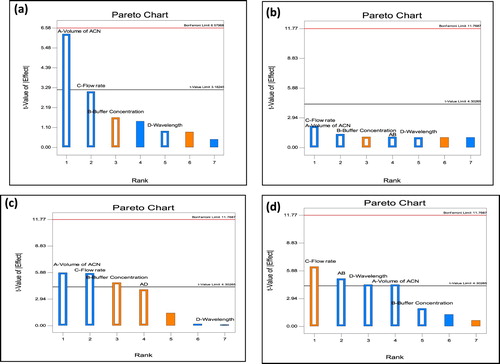
Figure 5. Perturbation plot showing effect of factors on Responses.
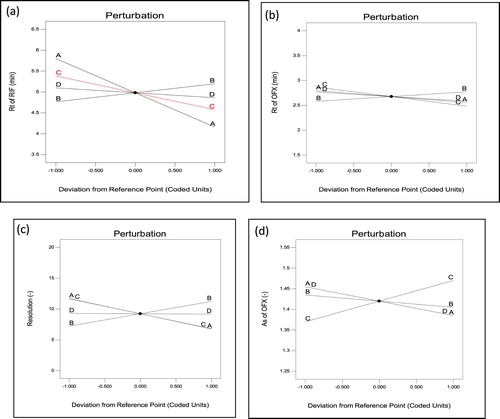
Figure 6. Three-dimensional response surface plot-showing effect of Volume of acetonitrile and flow rate on (a) Response 1 (b) Response 2 (c) Response 3 and (d) Response 4.
The model was validated by analysis of variance (ANOVA) using Design Expert software (Table ). The equation in terms of coded or actual factors can be used to make predictions regarding the response for given levels of each factor. The coded equation is useful for identifying the relative impact of the factors by comparing the factor coefficients. Model p value > 0.05 indicates that factors had nonsignificant effect on response resulting in a robust method. The low standard deviation [% coefficient of variance (CV)] and adequate precision, indicates a good relationship between the experimental data and those of the fitted models. Here positive sign indicates synergistic effect, while a negative sign indicates antagonistic effect in polynomial equation. In nutshell, amongst all four factors, volume of acetonitrile in mobile phase and flow rate appeared to have a possibly significant effect on retention factor of both drugs and asymmetry factor of ofloxacin, and therefore it was important to be carefully controlled.
Table 3. Statistical Parameters from ANOVA.
3.4. Analysis of synthetic mixture
The concentration of RIF and OFX was analyzed in synthetic mixture using proposed HPLC method in triplicate. The percent assay were found within the range of 100.258–103.19% with %RSD less than 2 reveals lack of interference from PLGA 75:25 and the proposed method can be successfully applied to analysis of formulation containing RIF and OFX. The % assay values are tabulated in Table .
Table 4. Assay of Synthetic mixture.
4. Conclusion
A simple and rapid HPLC method useful for the simultaneous determination of Rifampicin and ofloxacin was rationally developed. The mobile phase composition and chromatographic conditions were optimized by observing conditions producing best peak parameters. The proposed method was thoroughly validated, demonstrating to be sensitive, precise, linear in the studied concentrations range, accurate and robust in determining RIF and OFX in synthetic mixture. LOQ values for both the drugs confirmed method's ability to quantify minor amount of drugs. The application of FFD on robustness was to study simultaneous variation of effects on responses. Taking into account the responses, buffer concentration and wavelength was robust, with the exception of acetonitrile content in mobile phase and flow rate. The only significant factors affecting robustness study were acetonitrile content of mobile phase and flow rate and hence need to be controlled. It is concluded that the use of experimental design and response surface methodology is a flexible procedure, able to reduce the number of the needed experiments for the robustness study of HPLC method. The proposed HPLC method would be of use in routine quality control and combined dosage form analysis.
Disclosure statement
No potential conflict of interest was reported by the authors.
ORCID
Purvi Shah http://orcid.org/0000-0003-3138-6244
Tosha Pandya http://orcid.org/0000-0002-4344-3130
Mukesh Gohel http://orcid.org/0000-0001-7310-129X
Vaishali Thakkar http://orcid.org/0000-0001-6332-7703
Additional information
Funding
References
- World Health Organization. WHO global tuberculosis report. Geneva: WHO; 2016.
- Hall RG, Leff RD, Gumbo T. Treatment of active pulmonary tuberculosis in adults: current standards and recent advances. Pharmacother. 2009;29:1468–1481. doi: 10.1592/phco.29.12.1468
- O’Neil MJ, editor. The merck index an encyclopedia of chemicals, drugs, and biologicals. 13th ed. Whitehouse Station (NJ): Merck and Co., Inc.; 2001. p. 1474.
- Maggi N, Pasqualucci CR, Ballota R, et al. Rifampicin: a new orally active rifamycin. Chemother. 1966;11:285–292. doi: 10.1159/000220462
- Rees RJW, Pearson JMH, Waters MFR. Experimental and clinical studies on rifampicin in treatment of leprosy. Br Med J. 1970;1:89–92. doi: 10.1136/bmj.1.5688.89
- Binda G, Domenichini E, Gottardi A. Rifampicin, a general review. Arzneim Forsch. 1971;21:1907–1977.
- Pähkla R, Lambert J, Ansko P, et al. Comparative bioavailability of three different preparations of rifampicin. J Clin Pharm Ther. 1999;24:219–225. doi: 10.1046/j.1365-2710.1999.00223.x
- Tsankov N, Angelova I. Rifampin in dermatology. Clin Dermatol. 2003;21:50–55. doi: 10.1016/S0738-081X(02)00328-0
- Rainbow J, Cebelinski E, Bartkus J, et al. Rifampin-resistant meningococcal disease. Emerg Infect Dis. 2005;11:977–979. doi: 10.3201/eid1106.050143
- Ginsburg AS, Grosset JH, Bishai WR. Fluoroquinolones, tuberculosis, and resistance. Lancet Infect Dis. 2003;3:432–442. doi: 10.1016/S1473-3099(03)00671-6
- Simpson KL, Markham A. Ofloxacin otic solution: a review of its use in the management of ear infections. Drugs. 1999;58:509–531. doi: 10.2165/00003495-199958030-00019
- Jurado ER, Tudó G, Bellacasac JP, et al. In vitro effect of three-drug combinations of antituberculous agents against multidrug-resistant mycobacterium tuberculosis isolates. Int J Antimicrob Agents. 2013;41:278–280. doi: 10.1016/j.ijantimicag.2012.11.011
- Jurado ER, Tudó G, Martinez JA, et al. Synergistic effect of two combinations of antituberculous drugs against mycobacterium tuberculosis. Tuberc. 2012;92:260–263. doi: 10.1016/j.tube.2012.01.005
- Dhal C, Ahmad FJ, Chauhan A, et al. Quality by design approach for simultaneous estimation of doxycycline hyclate and curcumin by RP-HPLC method. Indian J Pharm Sci. 2015;77:723–728. doi: 10.4103/0250-474X.174992
- Jain P, Pathak VM. Development and validation of UV-visible spectrophotometric method for estimation of rifapentine in bulk and dosage form. Der Pharma Chemica. 2013;5:251–255.
- Tella ED, Sunitha S, Garikipati DK, et al. Assay of rifampicin in bulk and its dosage forms by visible spectrophotometry using chloranilic acid. IJCEE. 2012;3:64–67.
- Sriram ST, Prasanthi B, Tata S, et al. Development and validation of high performance liquid chromatographic method for the determination of rifampicin in human plasma. Int J Pharm Pharm Sci. 2012;4:362–367.
- Liua J, Suna J, Zhanga W, et al. HPLC determination of rifampicin and related compounds in pharmaceuticals using monolithic column. J Pharm Biomed Anal. 2008;46:405–409. doi: 10.1016/j.jpba.2007.10.025
- Ali J, Ali N, Sultana Y, et al. Development and validation of a stability- indicating HPTLC method for analysis of antitubercular drugs. Acta Chromatographica. 2007;18:168.
- Kapuriya KG, Parmar PM, Topiya HR, et al. Method development and validation of rifampicine and piperine in their combined dosage form. Int Bull Drug Res. 2012;1:71–80.
- Bhusari SS, Bhat V, Koul M, et al. Development and validation of a RP-HPLC method for the simultaneous determination of rifampicin and a flavonoid glycoside – a novel bioavailability enhancer of rifampicin. Trop J Pharm Res. 2009;8:531–537.
- Yan H, Zhou Y, Xie Q, et al. Simultaneous analysis of isoniazid and rifampicin by high performance liquid chromatography with gradient elution and wall-jet/thin-layer electrochemical detection. Anal Methods. 2014;6:1530–1537. doi: 10.1039/c3ay41794h
- Wankhede SB, Prakash A, Chitlange SS. Simultaneous reverse phase Hplc estimation of ofloxacin and satranidazole in tablet dosage form. Int J PharmTech Res. 2009;1:1136–1138.
- Sireesha KR, Prakash K. HPLC-UV method for simultaneous determination of ofloxacin and dexamethasone sodium phosphate. Int J Pharm Pharm Sci. 2012;4:415–418.
- Deekonda P, Reddy MS. Method development and validation for the quantitative estimation of cefixime and ofloxacin in pharmaceutical preparation by RP- HPLC. Der Pharma Chemica. 2014;6:31–37.
- Hallem RM, Salem MY, Fatahallah FA, et al. Quality in the pharmaceutical industry – a literature review. Saudi Pharm J. 2015;23:463–469. doi: 10.1016/j.jsps.2013.11.004
- Srinubabu G, Raju CAI, Sarath N, et al. Development and validation of a HPLC method for the determination of voriconazole in pharmaceutical formulation using an experimental design. Talanta. 2007;71:1424–1429. doi: 10.1016/j.talanta.2006.04.042
- Patel KG, Shah PM, Shah PA, et al. Validated high-performance thin-layer chromatographic (HPTLC) method for simultaneous determination of nadifloxacin, mometasone furoate, and miconazole nitrate cream using fractional factorial design. J Food Drug Anal. 2016;24:610–619. doi: 10.1016/j.jfda.2016.02.011
- International Conference on Harmonization. ICH Q2 (R1): validation of analytical procedures: text and methodology, ICH Secretariat, Geneva, 2005.
- United States Pharmacopeia 27, national formulary 22, vol.2, The United States Pharmacopoeial Convention, Rockville, 2003. p. 2281.
- Zar JH. Biostatistical analysis. 5th ed Upper saddle River (NJ): Pearson Educational Publications; 2010.
- Kleinschmidt G. Method validation in pharmaceutical analysis. In: Ermer J, Miller JHM, editor. A guide to best practice. Weinheim: Wiley-VCH Verlag GmbH and Co. KGaA; 2005. p.70.
- Annapurna MM, Mohapatro C, Narendra A. Stability-indicating liquid chromatographic method for the determination of Letrozole in pharmaceutical formulations. J Pharm Anal. 2012;2:298–305. doi: 10.1016/j.jpha.2012.01.010