
 ?Mathematical formulae have been encoded as MathML and are displayed in this HTML version using MathJax in order to improve their display. Uncheck the box to turn MathJax off. This feature requires Javascript. Click on a formula to zoom.
ABSTRACT
The consumption of the Bangui unsafe water is at the origin of many diseases like bilharzias, amoebas, typhoid and hepatitis E. This work aims at improving sanitary conditions of water in the capital and other cities of the Central African Republic. For this reason, a composite filter, based on clay and activated carbon resulting from the nut hulls of palm, is developed in the framework of this work in order to be widely diffused to needy populations of the town of Bangui and neighbourhood to reduce the rate of diseases caused by unsafe water. The adopted method consists in doing samplings of clay and nut hull of palm followed by a physical treatment to obtain clay powders, and then in treating physicochemically to obtain active carbon powders owing to chemical and thermal activation process. The obtained results are very promising insofar as for well water taken with a turbidity of 95 NTU has a turbidity of 3.5 NTU after filtration. The suspended matter of 144 mg/L is reduced to 2 mg/L, faecal coliforms of ≫300 returned to >300 with clay’s porosity of 37.5%. The adsorption isotherm with characteristics of the coal of nut hull of palm shows a value of n = 0.69 and Kf = 0.94. Then numerical results of temperatures on the outer and inner walls of the composite filter are coherent with theoretical results.
Nomenclature
| m | = | Mass of material (kg) |
| Cp | = | Heating capacity of water (J/kg) |
| Tc | = | Temperature of the sky (K) |
| Ts | = | Temperature of the ground (K) |
| Ta | = | Ambient temperature (K) |
| Tai | = | Temperature of air in the prototype (K) |
| S | = | Surface cylinder (m2) |
| Tp1ext | = | Temperature of the outer side of wall 1 (K) |
| Tp2ext | = | Temperature of the outer side of wall 2 (K) |
| Tp3ext | = | Temperature of the outer side of wall 3 (K) |
| Tp1int | = | Temperature of the inner side of wall 1 (K) |
| Tp1int | = | Temperature of inner side of wall 1 (K) |
| Tp2int | = | Temperature of the inner side of wall 2 (K) |
| Tp3int | = | Temperature of the inner side of wall 3 (K) |
| Qo | = | Maximum capacity of adsorption (mol/g) |
| η | = | Dynamic viscosity of the fluid (kg/ms) |
| k | = | Permeability of the medium (m2) |
| L | = | Length of the material (cm) |
| = | Density of water (kg/m3) | |
| RH | = | Hydraulic resistance (Pa/mLh−1) |
| Qv | = | Volume throughput (mL/H) |
| D | = | Coefficient of diffusion (m2/s) |
| Qe | = | Quantity of acid absorptive (mol/g) |
| Ce | = | Concentration with balance (mol/L) |
| KL | = | Constant of Langmuir |
| MES | = | Suspended matter |
| NTU | = | Nephelometry Turbidity Unit |
| PH | = | Hydrogen Potential |
| Pt-Co | = | Platinum-Cobalt |
| Kf | = | Coefficient of Freundlich |
| R | = | Retention Rate (%) |
| = | Porosity (%) | |
| v | = | Speed of the filter (m/s) |
1. Introduction
The separation process with membrane has been known since sometimes ago, but its development is known only recently [Citation1]. Since 1970, this technique has been used mainly in milk industries, drinks and water treatment [Citation2]. This technique, which is a selective separator of particle, makes it possible to purify water without the addition of chemical products while preserving its natural mineral properties [Citation3]. This process consumes relatively little energy and is selective [Citation4]. When a membrane’s filtration is carried out, one obtains two types of particles [Citation5]. The first ones are those with higher diameters than those of the pores and are retained by the membrane. The second ones are those with lower diameters passing through the membrane.
These membranes are usually made up of ceramic materials for decades, processes with membrane are used in the treatment of drinking water [Citation6]. This technique uses a gradient of pressure to make pass water through the pores of the membranes [Citation7]. Recent studies showed that clay was used in the development of the macroporous supports intended for the manufacture of these membranes [Citation8]. Moreover, it is recognised that in the treatment of drinking water, the active carbon is often used for the improvement of taste and for the elimination of certain undesirable substances [Citation9].
Even though the access to drinking water and the cleansing has been a human right since 2010, around 3.5 billion of human beings are bound to drink contaminated water detrimental to their health. Around 2.4 billion people (40% of the world’s population) always have latrines which are in the vicinity of wells. So 2.6 million people die each year due to diseases related to unsafe water, which makes unhealthy water one of the prime causes of mortality in the world [Citation10].
Considering these constraints, the aim of this paper is to design a composite filter based on the combination of clay and active carbon in order to reduce the rate of water-related diseases. So, the plan is to do the sampling of clay and nut hull of palm, then to distribute water filters to populations with limited access to drinking water.
Firstly, after a presentation of material and methods used, this paper will focus on the experimental results of the 14 physicochemical and bacteriological parameters which characterize the efficacy of a filter. Secondly, numerical results that predict the variation of temperatures on the walls of composite filter are presented.
2. Material and methods
2.1. Experimental devices
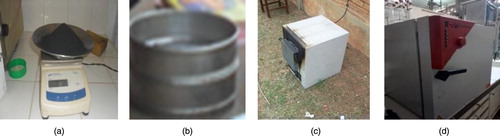
To carry out the experimental study, several devices and apparatus, such as electric balance (KM No-2401), were used to weigh samples and products. Thus, 250 and 500 g were selected in order to prepare the composite material (Figure (a)). Normative sieves (ISO 3310-1) were used to determine the granulometry of materials (Figure (b)). The selected values were 0.2, 0.4 and 0.6 mm. A furnace (THERM-EURO) was used to carbonize the nut coal of palm and cook composite material (Figure (c)); temperatures were about 600–900°C during 1 h. A traditional glassmaking was used to collect materials and to prepare the solution. A drying oven (BINDER) was used to dry samples (Figure (d)) during 24 h at 150°C.
Figure 1. (a) Electric balance KM N°2401, (b) Normative sieve ISO 3310-1, (c) Furnace THERM-EURO, (d) Drying BINDER.
2.2. Methods
2.2.1. Mathematical modelling
During the drying of composite material, three modes of heat transfer are used: conduction, convection and radiation [Citation4]. Mathematical expressions of these modes of heat transfers enabled to define equations of energy balance through each wall of the filter (Figure ).
Figure 2. Illustration of heat transfer through walls of the filter.
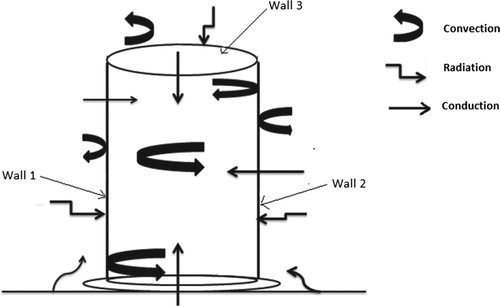
From the outer medium to the inner medium of the filter, mathematical modelling of different modes of heat transfers is permitted to write several energy balances on borders of the filter and is mentioned as follows:
Energy balance on the outer side of wall 1
(1)
Energy balance on the inner side of wall 1
Energy balance on the outer side of wall 2
Energy balance on the inner side of wall 2
Energy balance on the outer side of wall 3
Energy balance on the inner side of wall 3
2.2.2. Discretization of modelling equations
In this part, the above equations are discretized in order to determine the value of temperature on the outer and inner side of walls 1, 2 and 3. The discretisation is performed using the iterative method.
where
,
and
are temperatures of the outer side of wall 1, 2 and 3, respectively.
,
and
are temperatures of the inner side of wall 1, 2 and 3, respectively. a, b, bb, c, d and e are constants coefficients. All these unknown terms will be calculated using a computer code written in FORTRAN language named Force 2.0.
2.2.3. Numerical methods
The numerical method enabled evaluating temperatures of both sides of each wall of the filter because the experimental determination was not possible due to the lack of reliable equipment. In order to simplify calculations, the assumption to consider certain parameters as constants was made as follows: the flow is in one-way; conditions at borders are negligible; the filter is regarded as a plane wall, the outer temperature is ambient, radiations in material are not taken into account.
3. Investigation results
The first part of the obtained results is focused on experimental results including the characterization of the active carbon in order to set up three types of filters with different porosity (38.42% for filter 1), (32.35% for filter 2) and (40.42% for filter 3). Then, results of filtration for the study of flow through these three porous environments are exposed with the use of three types of water: tap water, well water and surface water.
3.1. Set-up of filter
In order to obtain the characteristic parameters of Freundlich and Langmuir Isotherm enabling the determination of the absorptivity of the active carbon, phosphoric acid is used in various mass of coal to activate it. Table presents various values of mass and volume which enabled to determine two coefficients of Freundlich. These coefficients, characterising the absorptivity of coal, are represented by symbols Kf and n.
Table 1. Isotherm of Freundlich and Langmuir.
The report/ratio of on
given in Table makes it possible to obtain n = 0.69. By balancing the equations of Freundlich and Langmuir [Citation11], one obtains the value of Kf = 0.94. Since n and Kf are lower than 1, it can be thus concluded that the active carbon putting in place is a good absorbent.
3.2. Filtration process
These results allow the determination of the physicochemical parameters before filtration and the bacteriological parameters of the filtrate. During this phase, it is initially a question of characterizing the filter, then to measure parameters of filtration which make it possible to make sure of the efficacy of the filter and its performance on the filtration of tap water, well water and surface water. During filtration, 14 physicochemical and bacteriological parameters were measured on tap water, well water and surface water in order to evaluate the effectiveness of the prototype manufactured. These parameters are as follows: porosity, throughput volume, hydraulic resistance, permeability of the medium, coefficient of diffusion, capacity of adsorption, rate of retention of the medium, turbidity, suspended matter, colour, faecal coliforms, faecal streptococcus and Clostridium perfringens.
After having designed the composite material, one passes to the assembly of the filter which is composed of a seal of 5L, which represents the room of filtration in which the sample of water is poured and the filtered water is collected in the second seal below the filter.
3.3. Results on physicochemical and bacteriological parameters
Parameters measured in the tap water, well water and surface water before and after filtration are given in Table 2. The work starts with filtration tests of tap water using each of the three designed filters in order to study their performances on physical parameters such as porosity, hydraulic resistance and filtration flow rate. Table presents values of porosity, flow rate and hydraulic resistance of filter 1 when using tap water. It reveals that while the porosity is 38.42%, the flow rate of filtration is within 17 and 40 ml/h.
Table 2. Results of filtration tests of tap water on filter 1.
Table summarizes the physical parameters measured during the test of the tap water when the filtration is performed in filter 2. Values of flow rate increase gradually by 25–60 ml/h. This considerable increase goes on with a gap of 35 ml/h. But, the hydraulic resistance decreases slowly from 1300.3 to 223 Pa.ml/h.
Table 3. Results of filtration tests of tap water on filter 2.
Results of filter 3, presented in Table , show better values in the two key parameters of a porous flow: good porosity (40.42%) and good flow rate (from 32 to 62 ml/h).
Table 4. Results of filtration tests of tap water on filter 3.
By looking at the above results pointing up filtrations tests of tap water, one notes initially a good performance of filter 3 which has a porosity of 40.42% with a better flow varying from 24 to 60 ml/h compared to filter 1 and filter 2. These tests reveal therefore the main characteristics of porous environment which are summarized by two parameters of a filtration knowing as porosity and permeability of the medium.
After testing the quality of filters in tap water, the quality of filter was tested in well water and surface water. Table presents results of the physicochemical parameters of filter 1 while carrying out filtration of well water with filter 1.
Table 5. Results of physicochemical parameters of well water on filter 1.
The obtained porosity (38.42%) is in conformity with the literature, follow-up by the permeability of the medium represents parameters characterizing the flow in porous environment. The value of the coefficient of diffusion (D = 1.04 × 10⁻⁶ m2/s) proves that there is diffusion in composite material.
After having evaluated the physicochemical parameters, Table gives values of the bacteriological parameters of well water measured before and after the filtration process. It can be observed that turbidity of well water decreases enormously from 75.2 to 3.2 NTU; this fall of turbidity testifies the effectiveness to the composite filter. Then the fall of the quantity of suspended matter proves the characteristics of the capacity of adsorption of the active carbon of nut hull of palm (Figure ).
Figure 3. Picture of the present composite filter.
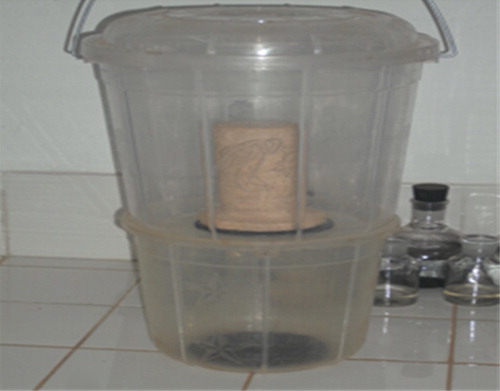
Table 6. Results of bacteriological parameters of well water on filter 1.
Now it will be about measurements of the parameters of surface water used by populations. By using filter 3, all results are consolidated in Table which presents results of measurements of the physicochemical parameters. One can note a difference on the level of porosity (40.42%), followed by the flow rate (Qv = 30 mL/h) of filtration of this filter. This difference is due to the properties of composite materials.
Table 7. Results of physicochemical parameters of surface water on filter 3.
Concerning the bacteriological parameters of surface water, Table presents the measured values of the bacteriological parameters obtained with filter 3. In this table, one can note a great difference (563 Pt.-Co) between the colour of surface water before and after filtration. This difference is due to the characteristic of the capacity of the active carbon because the active carbon has a great capacity to change the colour and taste of water. Then one can note also a reduction in the numbers of coliforms.
Figure presents the curve of turbidity according to the time of filtration. This curve enables us to analyse the stay of water during an interval of time in the filter. This curve (Figure ) presents turbidity in the Y-coordinate and time in X-coordinate. A rapid decrease starting from the value of turbidity 84 NTU during 1 h of filtration is noted. This value of turbidity decreases and it is stabilized at 5 NTU, which represents the value of the standard value recommended by the World Health Organization (WHO). That characterises the effectiveness of our filter.
Figure 4. Curve of turbidity according to the time.
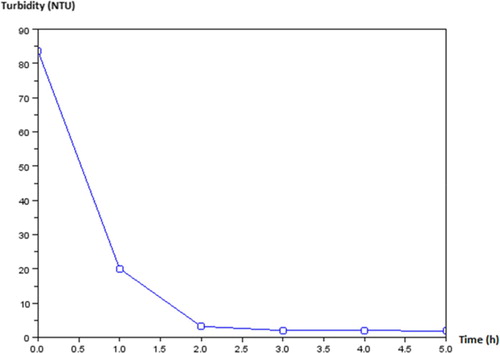
Table 8. Results of bacteriological parameters of surface water on filter 3.
Thereafter, Figure presents a comparative study of hydraulic resistances according to the flow rate of tap water of tap, well water and surface water. Analysis of this curve enables us to find out the characteristic properties of the three types of water used by population of Bangui: tap water, well water and surface water.
Figure 5. Comparative curves of hydraulic resistance with flow rate of water.
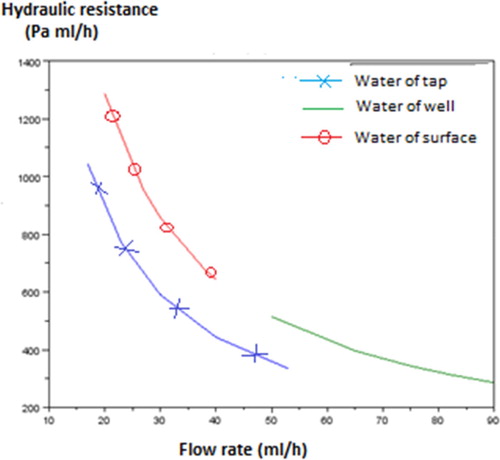
This curve has in Y-coordinate the hydraulic resistance (Rh) and in X-coordinate the flow rate (Qv). It firstly reveals the characteristic of the blue colour of tap water, this water is not turbid that is why this curve is lower than curves of well water and surface water. The green colour characterises the nature of water of well which is charged out of suspended matter. But, the red colour shows the characteristics of surface water which is turbid and contains a great quantity of suspended matter, that is why it has a great hydraulic resistance (1300 Pa/mL/h) and a low flow rate (40 mL/h). If there is a lot of suspended matter, there will be the phenomenon of filling, which slows down the water flow. In comparison with results of the experimental phase, the value of the efficiency of filtration is 98.60% which is in accordance with results of the filter of Anne Prost and Matt Simpson [Citation11].
3.4. Numerical results
This second part is to determine numerically various temperatures of sides of each wall in the absence of water (vacuum test). For that, the study will be based on assumptions mentioned before in order to be able to solve numerically various equations of discretisation by seeking initially values of coefficients a, b, bb, c, d and e which make it possible to evaluate temperatures of the outer and inner side of wall 1 (Tp1ext, Tp1int), wall 2 (Tp2ext, Tp2int) and wall 3 (Tp3ext, Tp3int) as presented in Figure . The numerical method used for the discretization of equations is the explicit scheme.
Figure 6. Plan view of the composite filter with its walls.
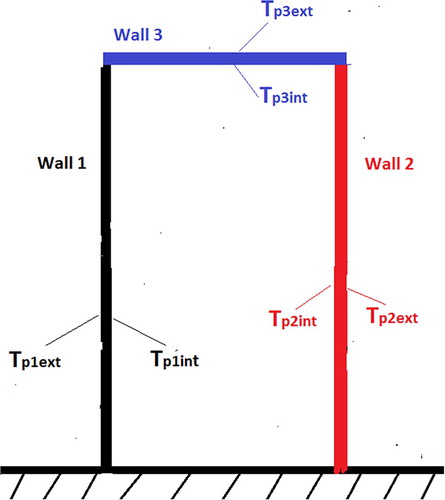
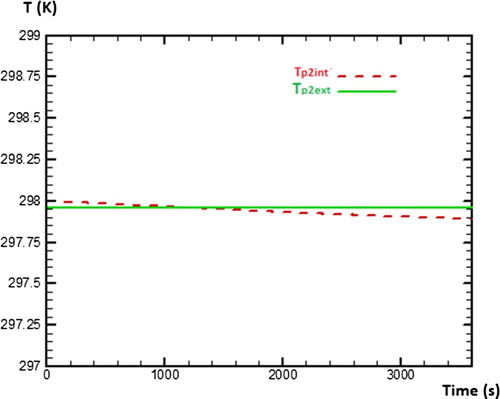
Figure presents the behaviour of temperature on both sides of wall 1 during 3600 s (1 h) of numerical calculation. One can note that starting from time t = 1000 s, the temperature of the inner side of wall 1 decreases gradually, while the temperature of outer side of wall 1 stays constant during the simulation. Concerning the wall 2, Figure presents the behaviour of temperature on its both sides during 3600 s of numerical calculation. It can be observed that behaviours of temperatures on both sides of wall 2 are similar to those of wall 1. That testifies that walls 1 and wall 2 have the same physical phenomena concerning the heat transfers.
Figure 7. Behaviour of temperature on the outer and inner side of wall 1.
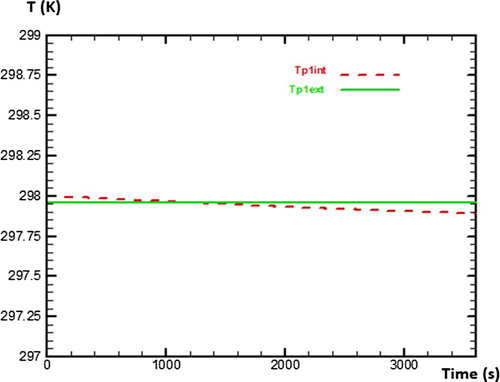
Figure 8. Behaviour of temperature on the outer and inner side of wall 2.
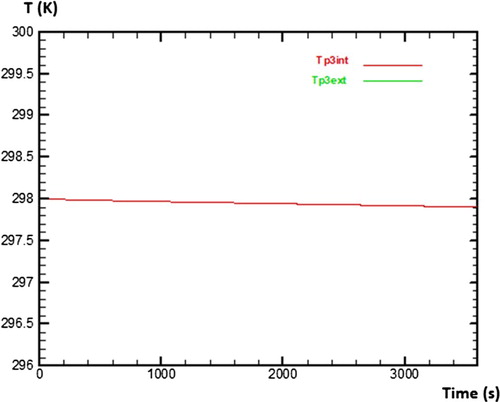
As regards the wall 3, Figure presents the behaviour of temperature on its both sides during 3600 s too. It is noted that temperature of inner side and temperature of outer side of wall 3 are superposed. That means that the physical phenomena are different compared to the one observed on walls 1 and 2.
Figure 9. Behaviour of temperature on the outer and inner side of wall 3.
4. Discussion of results
Porosity: The obtained values of porosity (32.61% and 38.42%) are in conformity with those of the literature. These values illustrate the presence of vacuum inside the material, this latter is therefore released pores which facilitate the water run-off.
Permeability: Permeability of the medium can be regarded as a significant surface usable for the flow; it depends on the geometry of the porous network. The obtained values 336.433 and 5643.3 m2 show the usable surface for the flow.
Hydraulic resistance: It is a physical size characterizing a pipe and enabling to calculate the pressure loss. The obtained values 1811.184 and 443 Pa mL/h are in conformity with those of the literature.
Coefficient of diffusion: This parameter is a property of the material compared to another, values
Isotherm of Freundlich and Langmuir: This curve enables us to determine the capacity of adsorption of the active carbon. On the basis of equations of Freundlich and Langmuir, it allows us to appreciate the effectiveness of the active carbon compared to the value of n and Kf. In this study, values indicate that n = 0.68 being lower than 1, Kf = 0.94 and Qe = 5.58 × 10⁻³ mol/L. The activated nut coal of palm is a good adsorber for the acetic acid and for the organic pollutants more or less similar to the acid which could be found in water.
Turbidity: This value makes it possible to appreciate the effectiveness of retention of suspended matter of a filter. The obtained values 2 and 3 NTU being lower than the limit value of drinking water which is 5 NTU according to WHO, these values testify that the suspended matter causing the turbidity, is retained by the filter.
5. Conclusion and prospects
With regard to the obtained results and according to the point of view of properties of membrane microfiltration, based on clay and active carbon, it is possible to attest that clay and active carbon of the town of Bangui can reduce the rate of water-related diseases. In fact, it was a question of using numerical and theoretical calculation in order to evaluate temperatures on walls of the composite filter the design of which is based on clay and active carbon of nut hull of palm. Thus, it comes out from this study that the effectiveness of a composite filter depends on the porosity of material, the adsorbent capacity of the active carbon, the permeability of the medium and the retention output of the filter. Numerical calculation helped us to bring out profiles of temperature of the filter which depends mainly on the thickness of material (0.01 cm).
The study of the behaviour of filter will be focused according to the time of filtration, to propose a model of numerical predictions taking into account all those factors mentioned rather and to carry out a classification of these various filters following standards of the WHO about purification of water.
Acknowledgments
The authors thank all the staff of Laboratory of Combustion and Green Technology.
Disclosure statement
No potential conflict of interest was reported by the authors.
ORCID
Saint-Cyr Lengaye http://orcid.org/0000-0003-1251-5370
Additional information
Funding
References
- John Desmod et Cains. Filtration sur membrane. Article Relative à la Technique Membranaire. 1999; 1–8:20–30.
- Lenoble V. Elimination de l’Arsenic pour la production d’eau potable :oxydation chimique et adsorption sur des substrats solides innovants. Université de Limoges, 2003. France, pp.198.
- Nguimalet C.R., Balikouzou-Hinna D.A., Rasoanantoandro Gothard-Bassebe M.C., et al. Gestion de la qualité de l’eau, conflits et risques dans la ville de Bangui, Vol. 1–12. Université de Bangui Laboratoire Lavoisier Hydro Sciences; p 325–334, 2005.
- Songuélé J., Ali A., , Mar-Diop. C., et al. Possibilité d’installation de petites station de traitement d’eau potable par microfiltration tangentielle. Tribune de L’eau. 1994;47(568):3–9.
- Volpini DG. Optimisation de la préparation d’eau potable avec les membranes poreuses en présences des divers adjuvants [Thèse] USTL, Montpellier; 1994.
- Disa-Disa P., Culot M., Lobo J., et al. Traitement des eaux de consommation par filtration lente sur sable à plusieurs étapes. Vol. 27, n°3, Université de Québec –INRS-Eau, Terre et environnement; 2014.
- Papineau I. Influence des variations de qualité d’eau brute et du vieillissement des matériaux filtrants sur la performance de la filtration granulaire. Université de Montréal; 2013.
- Jackson GW, James DF. The permeability of fibrous porous media. The Canadian Journal of Chemical Engineering . 1986;64:374. doi: 10.1002/cjce.5450640302
- Le Coq L. Mise en œuvre et modélisation de medias fibreux pour la filtration d’huile [Thèse de doctorat].l’Institut National Polytechnique de Grenoble; 1986. p. 74–80.
- Payatakes AC. A new model for granular porous media: application to filtration through packed beds [Ph. D]. New York: Syracuse University; 1973.
- Pomerol C. Utilisation d’argile et le charbon actif. Encyclopædia Universalis. 2000. P. 566–599.