
 ?Mathematical formulae have been encoded as MathML and are displayed in this HTML version using MathJax in order to improve their display. Uncheck the box to turn MathJax off. This feature requires Javascript. Click on a formula to zoom.
ABSTRACT
Nanostructures of iron oxide and doped iron oxide with cobalt (Co), nickel (Ni) and zinc (Zn) have been prepared by wet chemical methods using sodium dodecyl sulphate (SDS) as capping agent. X-ray diffraction (XRD) and high resolution transmission electron microscopy (HRTEM) results showed that the nanostructures were crystalline with average crystallite size around 20 nm. The scanning electron microscopy (SEM) and transmission electron microscopy (TEM) images confirmed the granular shape of the nanostructures with ultra small size. The doping was confirmed in the XRD patterns and was well supported by Fourier transform infrared spectroscopy (FTIR). Band gap for iron oxide nanoparticles was found to be 2.2 eV and on doping the band gap found to be increased up to 2.5 eV. Ultra violet-visible (UV–Vis) measurements and blue shift of the optical band gap compliments the ultra small size of nanostructures as suggested by XRD, SEM and TEM studies. Interestingly, few of the compounds showed promising antifungal activity and might be used for antifungal treatment against fungal infection in future.
1. Introduction
In chemical sciences, synthesis of transition metal and metal oxide nanoparticles is a developing research field. As the size of the particles got reduced, the bulk properties of the particles disappear and novel properties appear following the quantum confinement effect. Consequently the properties of nanomaterial differ from that of its bulk counterpart. With decrease in size, the high surface area to volume ratio get improved which leads to superior properties such as enhanced catalytic activity [Citation1,Citation2]. Metal nanoparticles are widely prepared by researchers in the last decade. Among various metal nanoparticles, iron nanoparticles have attracted considerable attention in modern technologies [Citation3]. Major cause for focused research on iron nanoparticles is due to their optical, catalytic, mechanical and electrical properties [Citation4,Citation5].
In comparison to metal nanoparticles, metal oxide nanoparticles are more promising materials for both fundamental and practical reasons. The oxides of transition metals have applications in many areas including waste water treatment, solar energy transformation, dye degradation, electronics and catalysis [Citation6,Citation7]. Among these oxide nanoparticles, iron oxide nanoparticles are of particular interest for their non toxicity, inexpensiveness, abundance, stability in aqueous environments and narrow band gap of 2.0–2.2 eV. This narrow band gap of iron oxide makes it suitable for photoconductive and photo thermal applications. In addition to this, the nano – iron oxide has been used in drug delivery, biosensors, energy devices, printed electronics, photocatalysis and smart materials [Citation8–10].
Doping of transition metal elements, modifies the electrical, optical and to some extent structural properties of nanomaterials [Citation11]. Choice of dopent and method of doping determines the extent of modification in properties. In general, ions similar in size to the parent ion give effective improvement in properties without deflecting the structural properties to much extent. Similar modifications have been reported for iron oxide nanomaterials when doped by other transition metals [Citation12–15].
Here, we report the synthesis, structure, optical properties and antimicrobial activity of pure iron oxide nanomaterials and iron oxide nanomaterials doped with Zn, Ni and Co. These nanomaterials have already been tested for their antibiotic activity against Escherichia coli and Staphylococcus aureus and we have tested antifungal activity of these nanomaterials against Candida albicans, non-albicans and other fungal strain.
2. Experimental
2.1. Materials
All Chemicals used in this work were of analytical grade and were used without any further purification. Iron nitrate (Fe(NO3)2), SDS (CH3 (CH2)11OSO3Na), nickel nitrate (Ni(NO3)2), cobalt nitrate (Co(NO3)2), zinc nitrate (Zn(NO3)2), ammonia solution were purchased from SRL private limited. Double distilled water was used to prepare all solutions [Citation16,Citation17].
2.2. Preparation of bare and doped iron oxide nanoparticles
Bare iron oxide and Ni, Co, Zn doped iron oxide nanostructures were prepared by co-precipitation method using SDS as capping agent. Separate solutions of capping agent and ferric nitrate were prepared in double distilled water. Ferric nitrate (0.1 mol/L) was added in capping agent solution (0.1 mol/L) drop wise with constant shaking at basic pH maintained by adding ammonia solution (3–4 ml). The suspension was kept under stirring for 2 hrs and then was centrifuged to separate out the solid product. After proper washing the product was dried under oven, followed by calcinations at 573 K for 3 hrs to obtain a fine powder of iron oxide.
For the synthesis of Ni, Co, Zn doped iron oxide nanoparticles, ferric nitrate was used as a precursor and Ni, Zn, Co nitrates were used as a dopant. The preparation was carried out, with (0.1 mol/L) ferric nitrate, (0.1 mol/L) dopant (nickel nitrate, cobalt nitrate, zinc nitrate) and ammonia solution added as a precipitating agent. The suspension was stirred for 2 hrs at room temperature. This dried sample was grinded and calcinated at 573 K for 2 hrs to obtain a fine powder. This black powder was processed in a similar fashion as done for pure iron oxide synthesis. The obtained residue was labelled as doped iron nanoparticles.
2.3. Characterizations
The nanoparticles were characterized with the help of XRD, TEM, FTIR, UV-visible spectrophotometer. The XRD measurements were carried out using RIGAKU Corporation, (Smartlab) 9 KW by using X-ray diffraction pattern recorded using Cu Kα radiation. The scan range was from 10° to 70° (or 80°) 2θ at a rate of 3°. The size and the morphology of the iron oxide and doped iron oxide were characterized by FESEM (Nova Nano SEM) from Icon analytical and transmission electron microscopy (TEM) (Icon analytical) at a voltage of 200 KV. The infrared spectra (FTIR) were recorded in the range of 400–4000 cm−1 by using FTIR K 800 AA carry 660 FTIR from (AGILENT technology). It was used to identify the functional group, purity, symmetry and nature of chemical bond present in the synthesized material. UV-Vis spectroscopy (Shimsdzu UV-1800) was applied to find the concentration of the absorber in a resolution. The UV-Vis absorption spectra of all the samples were obtained and scanning range for the samples was 190–800 nm [Citation18]. Crystallite size (D) of synthesized nanoparticles was determined using Scherrer’s equation
λ is wavelength, K is constant and β is the full width at half maximum (FWHM) and θ is the Bragg’s angle of diffraction. Bragg’s diffraction law relation was applied to calculate- d spacing by mentioned equation [Citation19,Citation20].
2.4. Optical band gap studies
The optical band gap calculations were performed by recording UV-visible spectrum of nanomaterial suspensions. Tauc relation was then applied to calculate band gaps using recorded UV-Vis spectrum. According to the Tauc relation, the absorption coefficient (α) is given by
where B is constant having different values for different transitions,
is the band gap energy, hυ is the energy of a photon and m is an exponent with values 1/2, 3/2, 2 and 3 depending upon the electronic transition. For current study, the linear portion of the plot between (αhυ)2 versus hυ taking n = 2 (for allowed direct transition band gap) where n = 1/m, was extrapolated to obtain the optical band gap [Citation21,Citation22].
2.5. Antimicrobial activity
The fungal strains used in the present study were procured from National Culture Collection of Pathogenic Fungi (NCCPF), Post- Graduate Institute of Medical Education and Research (PGIMER), Chandigarh and Microbial Culture Collection Centre (MTCC), Institute of Microbial Technology (IMTECH), Chandigarh, India. The fungal strains were cultured in yeast extract-peptone-dextrose [YEPD broth and YEPD agar, (HiMedia, India)] and Roswell Park Memorial Institute (RPMI) 1640 media (HiMedia, India). The in vitro antifungal assays were performed in RPMI 1640 medium containing 96 well microtiter plate by broth microdilution methods according to Clinical Laboratory Standard Institute (CLSI) guideline. Log phase fungal strains (104 cells) were inoculated in RPMI 1640 medium and appropriate amount of nanomaterial solutions were added to the wells of a 96-well microtiter plate (Tarson, India) and serially diluted two fold [Citation23–27]. Further, the microtiter plates containing fungal cells were incubated at 303 K for 48 hrs. The visual density was determined for analysing growth inhibition. The experiments were performed in triplicate and amphotericin B, a well known standard antifungal drug was used as positive control.
3. Results and discussion
3.1. Fourier transform infrared spectroscopy (FTIR)
The FTIR spectra are recorded in the range of 4000–400 cm−1. Figure shows FTIR spectra of Iron oxide nanoparticles. Major peaks were observed at 3353, 1603, 1369, 692, 626, 547 cm−1. A broad band at 3353 cm−1 corresponds to stretching mode of -OH group. Band near 1603 cm−1 is assigned to H-O-H bending vibration of water present in the moisture absorbed from the atmosphere. Bands around 1369 cm−1 may be due to ions. The peak at around 547 cm−1 is the characteristic absorption of Fe-O stretching suggesting the formation of Fe-O bond in the prepared nanomaterials.
Figure 1. FTIR of bare and doped iron oxide nanoparticles (A) Iron oxide, (B) Zn doped iron oxide, (C) Ni Doped iron oxide, (D) Co doped iron oxide.
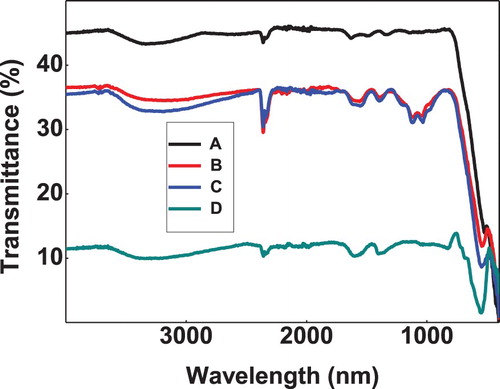
Figure , also shows the FTIR spectra of doped iron oxide nanoparticles. Similar peaks were observed in all curves with a small shift in the Fe-O peak to 543 cm−1. The intensity of Fe-O peak was also decreased on doping. This slight shift in band confirms doping in the nanomaterials whereas decreased intensity suggests that doping is low and it perturbs the Fe-O structure skeleton to a small extent. This decrease can easily be explained on the basis of Hook’s law which states that the vibration frequency is indirectly proportional to reduce mass. Specifically, as the condensed mass increase the vibrational frequency shifts to lower value.
3.2. Scanning electron microscopy (SEM)
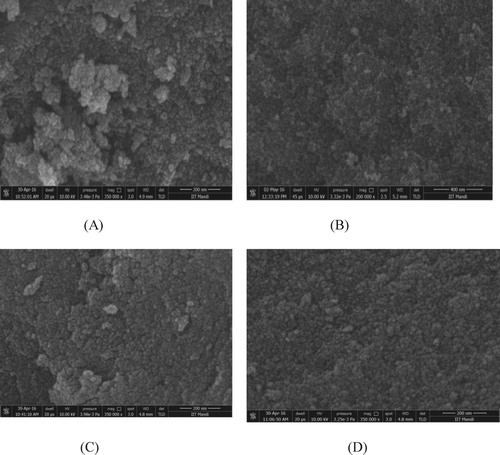
The spherical grains of iron oxide with the size of few nanometers are clearly visible in Figure (a) suggesting a successful synthesis of ultra small iron oxide nanostructures. Figure (b, c, d) shows the SEM images of doped iron oxide nanoparticles in which the smaller nanoparticles are visible and are less agglomerated due to increase in density and reduction in grain size with doping.
Figure 2. SEM images of iron oxide and doped iron oxide nanoparticles (A) Iron oxide, (B) Co doped iron oxide, (C) Ni doped iron oxide, (D) Zn doped iron oxide.
3.3. Transmission electron microscopy (TEM)
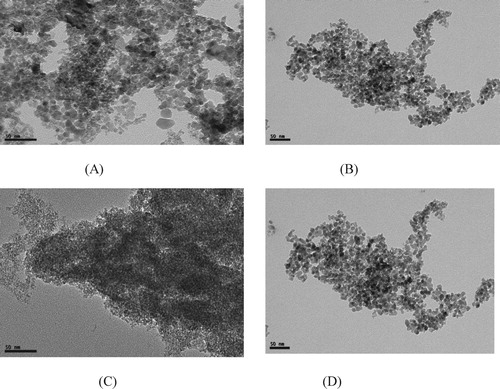
The TEM images of iron oxide and doped iron nanoparticles at different magnifications are shown in Figure . The TEM results are also in accordance with SEM results and indicate that nanoparticles are approximately spherical with the particle size in the range of 5–20 nm.
Figure 3. TEM images of iron oxide and doped iron oxide nanoparticles (A) Iron oxide, (B) Co doped iron oxide, (C) Ni doped iron oxide, (D) Zn doped iron oxide.
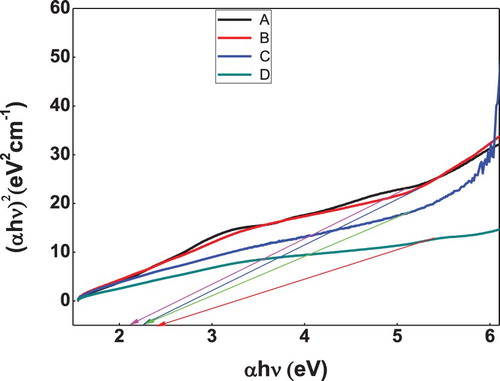
3.4. UV-Vis spectral analysis
UV-Vis spectral analysis has been done for the prepared samples of bare, zinc, nickel and cobalt doped iron oxide nanoparticles. Figure shows the UV-Visible absorption spectra of iron oxide and doped iron oxide nanoparticles. The spectra reveal a characteristic absorption peak of iron oxide at a wavelength of 390 nm which is almost near to the characteristic wavelength of iron oxide nanoparticles [Citation28]. Band gap for iron oxide nanoparticles was found to be 2.2 eV. However, doped iron nanoparticles showed absorption edge at 250, 240, 230 nm (Figure ) and bandgap calculated was found to be 2.3, 2.4 and 2.5 eV which is in agreement with literature values [Citation29].
Figure 4. UV- Visible spectra of bare iron oxide and doped iron oxide nanoparticles (A) Iron oxide, (B) Ni doped iron oxide, (C) Zn doped iron oxide, (D) Co doped iron oxide.
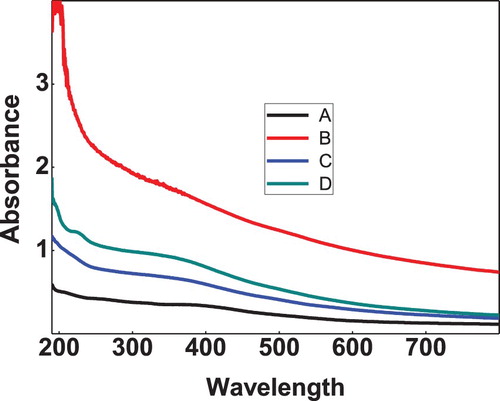
Figure 5. Band gap calculations for bare iron oxide and doped iron oxide nanoparticles (A) Iron oxide, (B) Ni doped iron oxide, (C) Zn doped iron oxide, (D) Co doped iron oxide.
3.5. X-Ray diffraction
The peaks in the X-ray diffraction pattern (Figure ) shows multicrystalline nature of iron oxide and doped iron oxide nano particles. The various peaks of iron oxide at 35.8, 41.6, 55.2, 63.14 and 71.2 are in correspondence to iron oxide JCPDS card (19-0629) [Citation30]. The average crystallite size for iron oxide nanoparticle was found in the range of 5–20 nm.
Figure 6. XRD pattern for bare iron oxide nanoparticles and doped iron oxide nanoparticles (A) Iron oxide, (B) Ni doped iron oxide, (C) Zn doped iron oxide, (D) Co doped iron oxide.
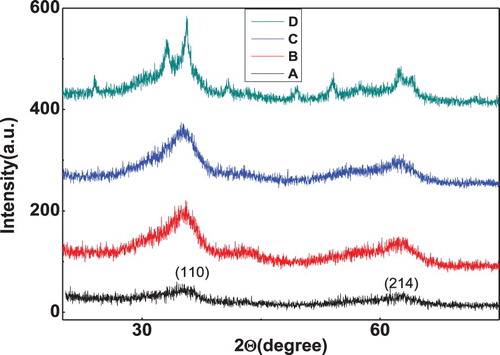
Figure also represents the XRD pattern of iron oxide nanoparticles doped with Co, Ni and Zn. There is a minor shift in the 2θ values after doping with no additional peak suggesting substitution of Fe ions by dopant ions as the dopent ions were of the size of Fe ions.
3.6. Determination of antifungal activity
Anti-fungal activity of the nanomaterials has been determined against seven fungal strains, including C. albicans (NCCPF 40034), non-albicans species of Candida (C. krusei (NCCPF 440002), C. glabrata (MTCC 3019), C. tropicalis (NCCPF 420007), C. parapsilosis (NCCPF 450002)) and other fungus, C. neoformans (NCCPF 250316). The minimum inhibitory concentration (MIC) is defined as the concentration which inhibits the growth of cells by 100%. As shown in Table , iron oxide showed MIC ranging from 312.5 μM–156.25 μM and doped iron oxide showed MIC >625 μM against the tested fungal strains.
Table 1. MIC value (μM) against various Candida albicans, non-albicans and other fungi.
It is notable that Candida spp. cause major opportunistic infection in immunocompromised patients including burn, AIDS, cancer and organ transplant patients. Very high mortality rates of up to 60% have been observed in such cases due to these fungal organisms. To treat these infections, there are only four major classes of clinically approved antifungal drugs available in the market till date. Moreover, in the past decade, the fungal resistance to these antifungal drugs has increased globally and several harmful side effects to the host have also been observed. The studied nanoparticles have been found more effective against fungal infection with very less toxic effects [Citation31]. These nanoparticles are cost-effective with broader activity spectrum against fungal infection, so there is very less chance of fungal resistance. Thus, iron oxide and doped iron oxide nanoparticles presented in this study can be harnessed in the production of broad-spectrum antifungal agents.
4. Conclusions
Iron oxide and doped iron oxides nanoparticles have been successfully synthesized by coprecipitation method. The XRD result confirmed that the prepared samples are crystalline with size in nanoscale, which is further confirmed by TEM and SEM analysis. Synthesizes doped nanoparticles were observed to have lower Fe-O stretching as well as lower band gap in comparison to bare iron oxide nanoparticles confirming the photocatalytic potential of these nanomaterials. The antifungal experiments show that these nanoparticles exhibit good inhibition against various fungal strains, including C. albicans, non-albicans and other fungi and thus are the promising candidate for future antifungal agents.
Disclosure statement
No potential conflict of interest was reported by the authors.
ORCID
Atul http://orcid.org/0000-0001-5343-3801
Manish Kumar http://orcid.org/0000-0002-1942-3463
Indresh Kumar Maurya http://orcid.org/0000-0002-2377-3693
Alpana Thakur http://orcid.org/0000-0003-1666-1033
Sunil Kumar http://orcid.org/0000-0002-2242-255X
References
- Sharma P, Kumar R, Chauhan S, et al. Facile growth and characterization of α-Fe2O3 nanoparticles for photocatalytic degradation of methyl orange. J Nanosci Nanotechnol. 2014;14:6153–6157.
- Wang Y, Yu M, Yang K, et al. Simple synthesis of luminescent CdSe quantum dots from ascorbic acid and selenium dioxide. Luminescence. 2015;30:1375–1379.
- Giuli G, Trapananti A, Mueller F, et al. Insights into the effect of iron and cobalt doping on the structure of nanosized ZnO. Inorg Chem. 2015;54:9393–9300.
- Ambika S, Devasena M, Nambi M. Synthesis, characterization and performance of high energy ball milled meso-scale zero valent iron in Fenton reaction. J Environ Manage. 2016;18:1847–1855.
- Ali A, Zafar H, Zia M, et al. Synthesis, characterization, applications, and challenges of iron oxide nanoparticles. Nanotechnol Sci Appl. 2016;19:49–67.
- Kumar S, Thakur A, Rangra VS, et al. Synthesis and use of Low-band-Gap ZnO nanoparticles for water treatment. Arab J Sci Eng. 2016;41:2393–2398.
- Li S, Lin MM, Toprak MS, et al. Nanocomposites of polymer and inorganic nanoparticles for optical and magnetic applications. Nano Rev. 2010;5:1–10.
- Han J, Wang L, Wong SS. Morphology and dopant-dependent optical characteristics of novel composite 1D and 3D-based heterostructures of CdSe nanocrystals and LaPO4:Re (Re=Eu, Ce, Tb) metal phosphate nanowires. RSC Adv. 2014;4:34963–34980.
- Feng TY, Jun HS, Shen YS, et al. Monoxide magnetic semiconductors: materials, properties, and devices. Chin. Phys. B. 2013;22(088505):1–19.
- Wu W, Taekyung ZW, Jiang C, et al. Recent progress on magnetic iron oxide nanoparticles: synthesis, surface functional strategies and biomedical applications. Sci. Technol. Adv. Mater. 2015;16(023501):1–43.
- Caia L, Hua Z, Brantonb P, et al. The effect of doping transition metal oxides on copper manganese oxides for the catalytic oxidation of CO. Chinese J Catal. 2014;35:159–167.
- Tedstone AA, Lewis DJ, O’Brien P. Synthesis, properties, and applications of transition metal-doped Layered transition metal Dichalcogenides. Chem. Mater. 2016;28:1965–1974.
- Sivakumar S, Anusuya D, Khatiwada CP, et al. Characterizations of diverse mole of pure and Ni-doped α-Fe2O3 synthesized nanoparticles through chemical precipitation route. Spectrochim Acta A Mol Biomol Spectrosc. 2014;128:69–75.
- Wu L, Shena B, Sun S. Synthesis and assembly of barium-doped iron oxide nanoparticles and nanomagnets. Nanoscale. 2015;7:16165–16169.
- Kim DK, Mikhaylova M, Zhang Y, et al. Protective coating of superparamagnetic iron oxide nanoparticles. Chem. Mater. 2003;15:1617–1627.
- Kant S, Kumar S. Effects of alkaline earth metal ions on thermodynamic and ultrasonic properties of ascorbic acid. J Chem Eng Data. 2013;58:1294–1300.
- Kant S, Kumar A, Kumar S. Molar volume, viscosity and conductance studies of some alkali metal chlorides in aqueous ascorbic acid. J Mol Liq. 2009;150:39–42.
- Chavan SM, Babrekar MK, More SS, et al. Structural and optical properties of nanocrystalline Ni–Zn ferrite thin films. J Alloys Compd. 2010;507:21–25.
- Liu H, Cheng X, Liu H, et al. Structural, optical and magnetic properties of Cu and V Co-dopedZnO nanoparticles. Physica E. 2013;47:1–5.
- Chattopadhyay S, Dash SK, Ghosh T, et al. Surface modification of cobalt oxide nanoparticles usingphosphonomethyl iminodiacetic acid followed by folic acid:a biocompatible vehicle for targeted anticancer drug delivery. Cancer Nano. 2013;4:103–116.
- Kumar S, Patial S, Thakur A, et al. Water treatment using photocatalytic and antimicrobial activities of tin oxide nanoparticles. Indian J. Chem. Technol. 2017;24:435–440.
- Momeni MM, ghayeb Y. Synthesis and characterization of iron-dopedtitania nanohoneycomb and nanoporous semiconductors by electrochemical anodizing method as good visible light active photocatalysts. J Mater Sci-Mater El. 2015;26:5509–5517.
- Gorden F, Bursary K. Antibacterial, antifungal and cytotoxicity studies. J Mol Struct 2011;999:29–38.
- Baskar G, Chandhuru J, Fahad KS, et al. Mycological synthesis, characterization and antifungal activity of zinc oxide nanoparticles. Asian J. Pharm. Tech. 2013;3:142–146.
- Kim DH, Lee DG, Kim KL, et al. Internalization of tenecin-3 by a fungal cellular process is essential for its fungicidal effect on Candida albicans. Eur J Biochem. 2001;268:4449–4458.
- Kim DH, Lee YT, Lee YJ, et al. Bacterial expression of tenecin-3, an insect antifungal protein isolated from Tenebrio molitor, and its efficient purification. Mol Cells. 1998;8:786–789.
- Lee DG, Kim PI, Park Y, et al. Design of novel peptide analogs with potent fungicidal activity, based on PMAP-23 antimicrobial peptide isolated from porcine myeloid. Biochem Biophys Res Commun. 2002;293:231–238.
- Rahman O, Mohapatra SC, Ahmad AS. Fe3O4 inverse spinal super paramagnetic nanoparticles. Mater Chem Phys. 2012;132:196–202.
- Eman A, Abeer S, Mohamad A. Microwave-Hydrothermal synthesis of ferric oxide doped with cobalt. Adv Nanopart. 2015;4:53–60.
- Macías-Martínez B I, Cortés-Hernández DA, Zugasti-Cruz A, et al. Heating ability and hemolysis test of magnetite nanoparticles obtained by asimple co-precipitation method. J. Appl. Res. Technol. 2016;14:239–244.
- Valdiglesias V, Kilic G, Costa C, et al. Effects of iron oxide nanoparticles: Cytotoxicity, Genotoxicity, Developmental toxicity. Environ Mol Mutagen. 2015;56:125–148.