
ABSTRACT
Karyotype characters, mitotic metaphase chromosomes, and haploid ideograms of six species of Plantago L. species. Analysis of somatic metaphases showed that the chromosome numbers of these species were 2n = 8 for P. ovata, 2n = 10 for P. albicans, P. amplexicaulis, P. ciliata and P. psammophilia, and 2n = 12 for P. lanceolata. The karyotype formulae were nsm (+), nsm (–) and nm. According to TF% and Syi index, and according to A and A1, P. ciliata may be considered the most symmetrical and P. lanceolata may be had the most asymmetrical karyotype. There are 63 total bands and 11unique bands resulting from RAPD; 23 total bands and 3unique bands resulting from both ISSR and 23 total bands in addition to 2 unique bands generated from SCoT markers. Perceptual mapping (Bilpot) and cluster analysis based on cytological and molecular attributes gave the same results that distinguished the studied taxa into two main groups; P. ovata and the other taxa also classified into two subgroups.
1. Introduction
Genetic variation considers as one of the important three levels of biodiversity that International Union for Conservation of Nature (IUCN) has recommended for conservation [Citation1]. Genetic diversity is the basis for survival and adaptation that makes it possible to continue and advance the adaptive processes [Citation2].
The genus Plantago L. is the most prevalent from three genera of family Plantaginaceae. Plantago comprises about 483 species [Citation3]. Genus Plantago is small, annual and perennial herb of warm temperate, sandy provinces and is widely allocated. It grows in almost every type of habitat including deserts, sea cliffs, woodlands, disturbed areas and tropical mountains [Citation4].
Plantago has been used as a traditional medicinal plant to cure numerous diseases from cold to hepatitis. It also used as anti-inflammatory, antiviral, analgesic, antioxidant, anti-carcinogenic, and antitumor [Citation5,Citation6].
The basic chromosome numbers of Plantago was x = 4, 5 and 6 [Citation7]. Badr and El-Kholy [Citation8] studied Plantago chromosomes in the Egyptian flora and the basic chromosome number x = 6 is the most common among the species Plantago. Chromosome number and chromosome morphology are used in plant taxonomy and also important to elucidate the origin and phylogenetic relationships of plants [Citation9]. Karyological data can show variation in chromosome morphology and chromosome size [Citation10]. Soliman et al. [Citation11] carried out the chromosome number and karyotype analysis on three species of Plantago with chromosome number 2n = 12 and karyotype analysis showed differences in chromosome morphology.
Molecular markers are very important tool to detect variation and differences among and within species [Citation12]. The concept of molecular marker is an ideal approach for genetic diversity because they are neutral to environment influence and reveal differences at the whole genome level [Citation13].
Random amplified polymorphism DNA (RAPD) provides a quick and efficient screen for DNA sequence based polymorphism at a very large number of loci [Citation14]. Inter simple sequence repeats (ISSRs) were used to study the evolution of genetic relationship among species. Start codon targeted polymorphism (SCoT) analysis is based on the short conserved region in plant genes are surrounded by the initiation or ATG translation start codon that characterized in different studies and used in the analysis of genetic relationship in different species [Citation15].
The aim of this study is to assess the classification of some Plantago taxa based on morphological, cytological and molecular characters and study its impact on conservation strategies of gene banks.
2. Materials and methods
2.1. Plant material
The six species of Plantago L. were selected and collected from Arar in the Northern border region of KSA and identified according Boulous [Citation16] by Prof. Dr. Ahmed Kamal El-Din Osman. Names of species and their codes with GPS were listed in Table .
Table 1. List of investigated taxa and their codes.
2.2. Cytological and karyotype analysis
The cytological investigation followed Chattopadhyay and Sharma [Citation17]. The nomenclature system for chromosome type was determined as described by Abraham and Prasad [Citation18]. Karyotype analysis was carried out using Micro measure computer program [Citation19]. The mean measurements of three cells for each species were used to construct the karyotype.
2.3. DNA extraction
Total DNA was extracted from 100 mg of leaf tissue DNeasy plant Mini Kit (QIAGEN) according to the manufacturer’s instructions. The DNA amplifications were performed in an automated thermal cycle (model Techno 512) programmed for one cycle at 94°C for 4 min followed by 45 cycles of 1 min at 94°C, 1 min at 57°C, and 2 min at 72°C. the reaction was finally stored at 72°C for 10 min.
2.3.1. Random amplified polymorphic DNA (RAPD)
RAPD reactions were performed according to Williams et al. [Citation20]. Six primers were used to differentiate between the selected species of Plantago. The sequence of these primers was given in Table .
Table 2. List of RAPD, ISSR and SCoT primers and the sequences used in this study, number of total bands, polymorphic bands and percentage of polymorphism of each primer generated.
2.3.2. Inter – simple sequence repeats DNA (ISSR)
The composition of five primers was tested to amplify the isolated DNA listed in Table .
2.3.3. Start codon targeted polymorphism (SCoT)
Six primers sequences employed in the present study to generate the Start Codon Targeted (SCoT) as designed by Collard and Mackill [Citation21] are listed in Table .
2.4. Data analysis
All gels were photographed and analysed using Bio-Rad video documentation system, Model Gel Doc 2000. Data analysis was performed using SYSTAT version 7.0 program Wilkinson [Citation22].
3. Results and discussion
3.1. Morphological characteristics
Numerical taxonomic analysis of the studied species of Plantago was carried out using 14 morphological characteristics. The morphological features emerge from six species were differ. The comparison of morphological characteristics allowed to highlight differences among species Table .
Table 3. The morphological characters of the studied Plantago species.
3.2. Karyotype analysis
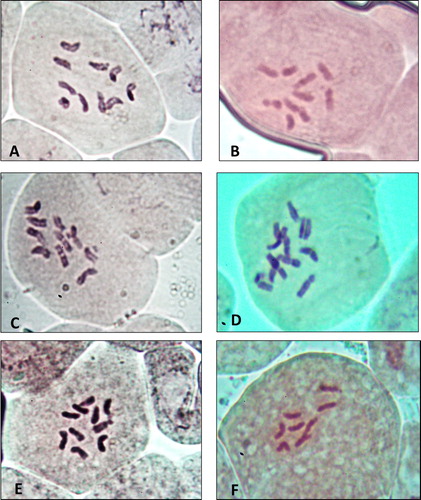
Chromosome numbers and karyotype of the studied species were illustrated in Table . Chromosome number of the investigated species was varied from 2n = 8 in Plantago ovata, to 2n = 10 in both of P. albicans, P. amplexicaulis subspecies bauphula, P. ciliata and P. psammophilia and 2n = 12 in P. lanceolata as shown in Figure .
Table 4. Karyotype parameters of somatic chromosomes of genus Plantago in KS.
Figure 1. Chromosomes of six species of Plantago in KSA(X = 1000). A: P. albicans. B: P. ciliata. C: P. amplexicaulis. D: P. lanceolata. E: P. psammophilia. F: P. ovata.
Diploid chromosome length (DCL) was varied from 308.242 µ in P. ovata to 459.944 µ in P. amplexicaulis. Mean chromosome length (MCL) was changed from 72.179 µ in P. lanceolata to 91.989 µ in P. amplexicaulis. Mean arm ratio (MAR) was varied from 1.603 in P. ciliata to 2.189 in P. lanceolata. Mean centromeric index (MCI) also verified from 0.330 in P. albicans to 0.390 in P. ciliata.
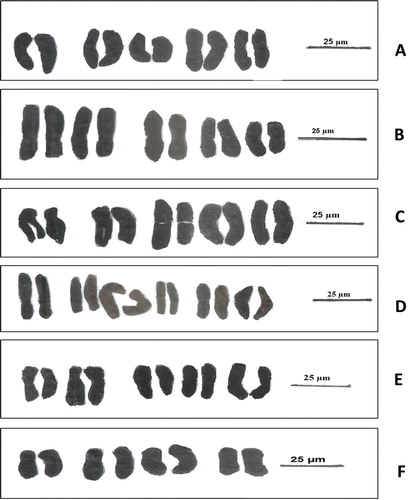
From chromosome measurements, karyogram illustrated karyotype formulae in all six species of Plantago (Figure ) as: nearly submetacentric – (nsm –) and near metacentric (nm) chromosomes. While, nearly submetacentric + (nsm +) was found in all studied species except P. ciliata and P. psammophilia.
Figure 2. Karyogram of the selected species of Plantago (Bar = 25 µm). A: P. albicans. B: P. ciliata. C: P. amplexicaulis. D: P. lanceolata. E: P. psammophilia. F: P. ovata.
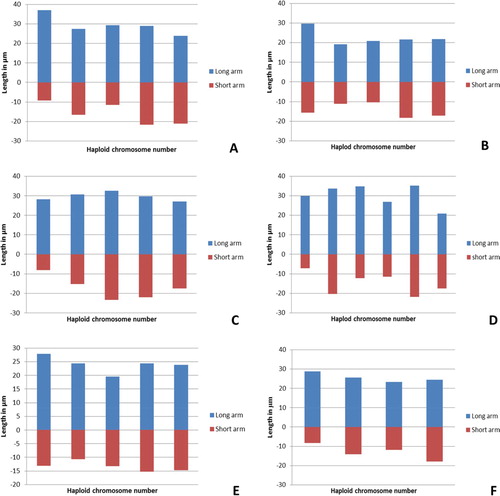
A number of concepts were introduced to determine the karyotype asymmetry and symmetry classification, intra chromosomal asymmetry index (A1) and inter chromosomal asymmetry index (A2). The total form percent (TF %), the resemblance between chromosomes (Rec) and symmetric index (Syi). The highest value of TF% 42.795 was present in P. ciliata and the lowest value 34.825 was in P. lanceolata. The lowest value of Rec 80.1 was found in P. lanceolata, while the highest 91.1 in P. ovata. The highest value of Syi index 64.625 was found in P. ciliata, where the lowest was 51.274 in P. lanceolata. The highest values of A1 (0.486), A2 (0.183) and A (0.343) were present in P. lanceolata. TF % and Syi index had the lowest value in P. ovata, where the P. lanceolata had the highest values of A1, A2 and A. Ideograms of haploid complement of Plantago species was illustrated in Figure .
Figure 3. Ideogram representation of the haploid chromosome length of six species of Plantago. A: P. albicans. B: P. ciliata. C: P. amplexicaulis. D: P. lanceolata. E: P. psammophilia. F: P. ovata.
3.3. Molecular studies
Random amplified polymorphism DNA (RAPD) fingerprinting using seven primers (OP-A7, OP-A12, OP-B2, OP-B11, OP-C4, OP-C9 and OP-D1); while the five primers used in ISSR analysis were (44A, 44B, HB-9, HB-11 and HB-13) as well as 5 primers used in SCoT analysis were (SCoT 1, SCoT 2, SCoT3, SCoT4 and SCoT 6). The results of these primers used in RAPD, ISSR and SCoT were observed in Tables and and the product profiles gels of these markers were illustrated in Figures .
Table 5. Bands characteristics produced by molecular markers (RAPD, ISSR & SCoT) in different Plantago species.
Figure 4. The amplification profile of seven RAPD primers for six studied taxa of Plantago species in KSA. 1: P. albicans. 2: P. ciliata. 3: P. amplexicaulis. 4: P. lanceolata. 5: P. psammophilia. 6: P. ovata.
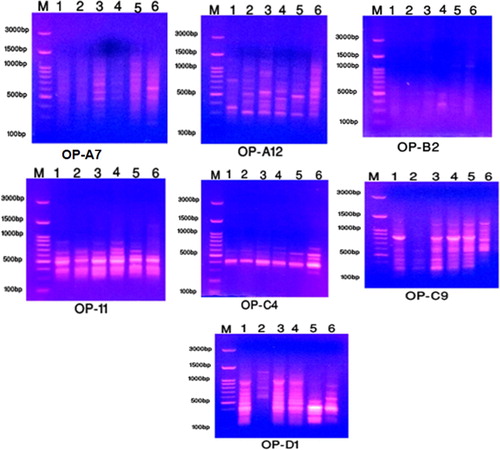
Figure 5. The amplification profile of five ISSR primers for six studied taxa of Plantago species in KSA. 1: P. albicans. 2: P. ciliata. 3: P. amplexicaulis. 4: P. lanceolata. 5: P. psammophilia. 6: P. ovata.
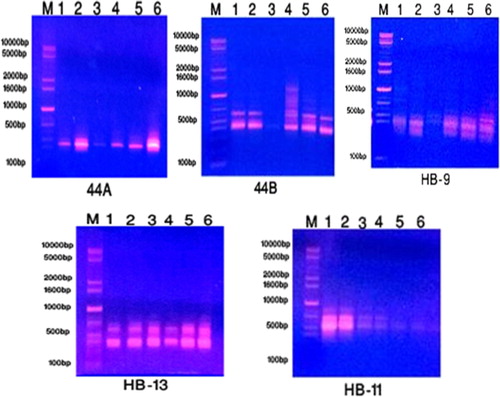
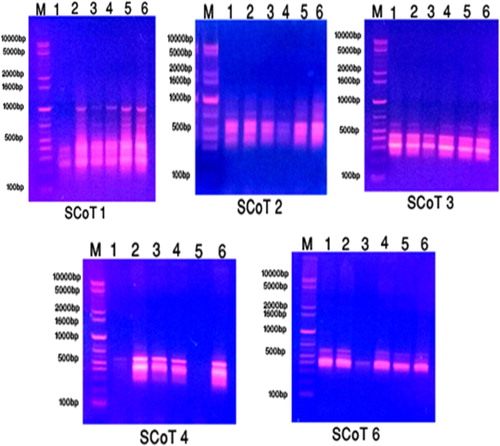
Figure 6. The amplification profile of five SCoT primers for six studied taxa of Plantago species in KSA. 1: P. albicans. 2: P. ciliata. 3: P. amplexicaulis. 4: P. lanceolata. 5: P. psammophilia. 6: P. ovata.
Among the studied species of Plantago, a total of 63 bands were amplified using seven primers of RAPD marker with molecular weight varied from 280–1460 bp with 15 monomorphic bands and 48 polymorphic bands as shown in Table . Regarding primer OP-A7 of RAPD, bands of molecular weight 1185 and 1260 bp were present only in P. psammophilia as characteristic bands. Primer OP-A12, two unique bands with molecular weight 900 and 920 bp were found only in P. amplexicaulis. In OP-B2 primer, band with molecular weight 940 bp was recorded only in P. amplexicaulis distinguished for that species.
Primer OP-B11, molecular weight 800 bp was presented in P. psammophilia as unique band. Band with molecular weight 1460 bp was observed only in P. ovata. Primer OP-C4, unique band with molecular weight 330 bp was characteristic for P. ovata. Primer OP-C9, two unique bands with molecular weight 730 and 860 bp recorded only in P. ovata. Regarding, OP-D1 primer unique band with molecular weight 825 bp was observed in P. ovata.
ISSR marker generating a product with 23 total bands with range size from 270 to 1340 bp congaing 10 monomorphic bands and 13 polymorphic bands from which 3 bands were unique. Regarding to primer 44B of ISSR, band with molecular weight 1340 bp was found in P. lanceolata. Primer HB-9, bands with molecular weight 1130 and 1335 bp were scored in P. albicans and P. ciliata, respectively.
On the other hand, SCoT molecular marker produced 23 total bands with range size from 265–1170 bp. Out 15 bands were polymorphic and 8 bands were monomorphic. Regarding to primer SCoT 2, band with molecular weight 1170 bp was observed in P. ovata. Primer SCoT 6, band with molecular weight 580 bp was recorded in P. ciliata.
Polymorphism resulting from RAPD reactions Table , the highest percentage of polymorphism was 100% inOP-B2 and OP-D1, whereas the lowest 42.86% in OP-C4 with an average of 74.56% as shown in Table . The percentage of polymorphism generated from ISSR reaction being the highest 80% in HB-13 and the lowest 20% in HB-11 with an average of 56.67% (Table ). Finally, the polymorphism percentage generated from SCoT reaction was highest 100% generated from SCoT 3&4 and 33.33% as lowest percentage generated from SCoT 2 with an average 71.43% as presented in Tables and .
3.4. Data analysis
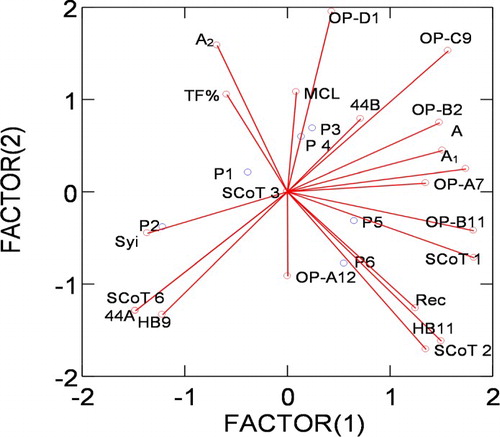
To get linkage between the studied species, cytological and molecular attributes were standardized and compute coordinates for plotting Biplot mapping by using perceptual mapping (PERMAP). Biplot showed that the importance of Syi index, 44A, HB9 and SCoT 6 to distinguish P. ciliata from the other taxa in a separate group. Rec, HB11 and SCoT 2 had the power to separate P. ovata. A2, OP-D1, and SCoT1 had the importance highly value to separate the other four taxa Figure .
Figure 7. Percptual mapping (Biplot) of the studied species of Plantago L. based on cytological parameters and molecular attributes. P 1: P. albicans. P2: P. ciliata. P 3: P. amplexicaulis. P4: P. lanceolata. P5: P. psammophilia. P6: P. ovata.
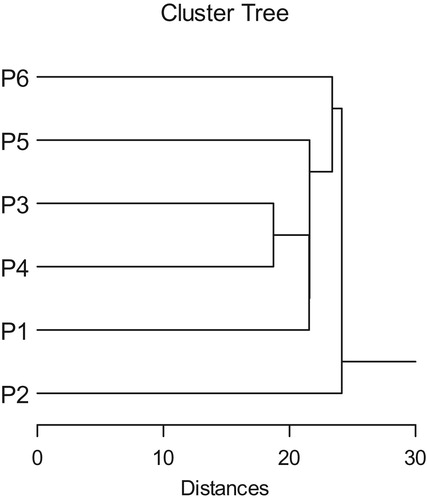
Cluster analysis based on cytological and molecular attributes gave two groups at 24.142. First group contained P. ciliata. On the other hand the second group also divided into two subgroups at 23.387. The first subgroup contained P. ovata and the second subgroup contained P. amplexicaulis and P. lanceolata, P. psammophilia and P. albicans Figure .
Figure 8. Cluster phenogram showing the relationships between the studied taxa of Plantago using Euclidean coefficient and single linkage method. P 1: P. albicans. P2: P. ciliata. P 3: P. amplexicaulis. P4: P. lanceolata. P5: P. psammophilia. P6: P. ovata.
Spearman correlation showed the highest similarity 0.876 between P. albicans and P. ciliata. The lowest similarity 0.439 was found between P. ciliata and P. psammophilia as shown in Table .
Table 6. Similarity indicies between the six studied species of Plantago L.
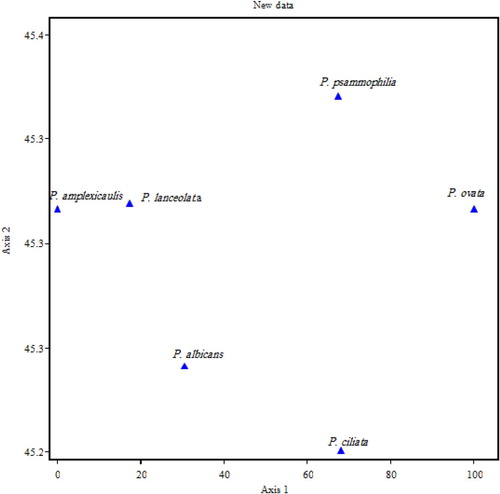
All morphological, cytological and molecular data were analysed resulting the phenogram from UPGMA clustering of similarity matrix is presented in Figure , two major groups were formed at (7.098) one of the major groups contained P. psammophilia and P. ovata and the second group also has two subgroups at 4.9, one subgroup consisted of P. ciliata and other subgroup contain the rest three species of Plantago and these results were in agreement with 2-dimensional scatter diagram Figure .
Figure 9. UPGAMA phenogram showing the relationships between the studied taxa of Plantago based on morphological, cytological parameters and molecular attributes.
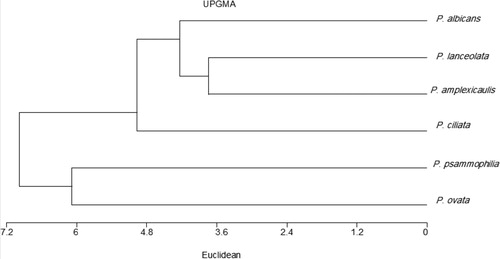
Figure 10. Scatter diagram of 6 species in the genus Plantago.
4. Discussion
The applications of cytological and molecular genetics techniques have a vital role in evolution and migration of species from their gene pool centres [Citation23]. Karyotype analysis is an essential method for studying chromosomes of plants that show the importance to study origin and classification [Citation24].
The chromosome numbers in six Plantago species were diploid. It showed a chromosome number 2n = 8 in P. ovata this count agree with McCullagh [Citation25]. Chromosome number 2n = 10 was found in P. albicans, P. amplexicaulis, P. ciliata and P. psammophilia. This result agrees with Janighorban [Citation26]; McCullagh [Citation25] and Badr [Citation27]. Plantago lanceolata has chromosome number 2n = 12 agree with the count of previous authors [Citation25,Citation28,Citation29].
TF% varied from 0 to 50 by Huziwara [Citation30]. The species of high A1 values more advanced than others [Citation31]. TF % and Syi-Rec values decrease with increasing asymmetry, while the As K%, the A1-A2 and the A values increase with increasing asymmetry [Citation11,Citation32].
In the present study, according to TF% and Syi index, P. ciliata may be had the most symmetrical karyotype. According to A and A1, P. ciliata may be considered the most symmetrical and P. lanceolata may be had the most asymmetrical karyotype (more advanced) than other studied species.
Genetic markers based on morphological traits, biochemical markers and molecular markers have been used to reveal plant variation [Citation33]. The combination of cytogenetic and molecular genetics is the latest efficient approach in defining species interrelationships and phylogeny [Citation34].
Molecular markers are widely used to evaluate both cultivated and wild species with different ploidy levels [Citation35] and [Citation36]. Seven primers of RAPD technique were used and produced 63 total bands with molecular weight ranged from 280–1460 bp. Among them 48 polymorphic bands and 11 unique bands; 5 unique bands characteristic for P. ovata, where 3 unique bands distinguished both of P. ciliata and P. psammophilia. These results clarified that the ability of RAPD analysis to differentiate among the investigated species of Plantago, in agreement with the study of Ahsyee et al. [Citation37] that confirmed the ability of RAPD for detection of genetic polymorphism among alfalfa populations.
Five primers of ISSR were used, generating 23 total bands ranging in molecular size between 270 and 1340 bp. Out of 13 polymorphic bands and 3 unique bands; P. albicans, P. ciliata and P. lanceolata had one unique band for each of them.
Five primers of SCoT were used giving 23 total bands, 15 polymorphic bands and 2 unique bands; one band distinguished P. ovata and one unique bands characterized for P. ciliata. The polymorphism determined by genetic markers is one of the valuable parameters for study species and understanding of their genetic differences [Citation38]. The level of polymorphism in this study revealed by ISSR (56.67%) was comparatively lesser than SCoT (71.43%) and RAPD (74.56%). From these results, RAPD fingerprinting was more efficient than ISSR and SCoT markers in this investigation. This result was comparative with Kaswan et al. [Citation39] that assessed the molecular polymorphism of RAPD markers 47.12% and 19.35% polymorphism of ISSR marker among different accessions of Plantago ovata.
The morphological and cytological parameters beside, molecular results of this study gave an important information that used in classification and relationship between the studied taxa of Plantago.
5. Conclusion
It could be concluded that the morphological, cytological parameters and molecular markers of the six species of Plantago in KSA could be considered as suitable parameters for the evolution of the genetic diversity among the studied species. These obtained data may play an important role in the management low cost strategies of gene banks for the conservation of these species. A comprehensive study covering all Plantago species in KSA will be necessary to construct best classification.
Disclosure statement
No potential conflict of interest was reported by the authors.
ORCID
Mohamed Abd El-Hameid Abdein http://orcid.org/0000-0001-8922-6089
Additional information
Funding
References
- McNeely JA, Miller KR, Reid WV, et al. Conserving the world’s biological diversity. Washington (DC): World Conservation Union, World Resources Institute, Conservation International, World Wildlife Fund–US, and the World Bank; 1990.
- Rao RV, Hodgkin T. Genetic diversity and conservation and utilization of plant genetic resources. Plant Cell Tissue Organ Cult. 2002;68:1–19. doi: 10.1023/A:1013359015812
- Tutel B, Kandemir I, Kus S, et al. Classification of Turkish Plantago L. species using numerical taxonomy. Turk J Bot. 2005;29:51–61.
- Primack RB. Reproductive effort in annual and perennial species of Plantago (Plantaginaceae). Am Nat. 1979;114(1):51–62. doi: 10.1086/283453
- Nyunt TM, Lwin KK, Aye TT, et al. Win, N.N: antihypertensive effect of Plantago major Linn. Whole plant (Ahkyawpaung-tahtaung) on mild to moderate hypertensive patients. Myanmar Health Sci Res J. 2007;19:97–102.
- Beara IN, Orcic DZ, Lesjak MM, et al. Liquid chromatography/tandem mass spectrometry study of anti-inflammatory activity of plantain (Plantago L. species). J Pharm Biomed Anal. 2010;52:701–706. doi: 10.1016/j.jpba.2010.02.014
- Sharma PK. Cytogenetic studies on some Himalayan species of the Genus Plantago L. PhD thesis, University of Jammu, Jammu; 1984.
- Badr A, El-Kholy MA. Chromosomal studies in the Egyptian flora II. Karyotype studies in the genus Plantago L. Cytologia. 1987;52:725–731. doi: 10.1508/cytologia.52.725
- Pavlova D, Tosheva A. Notes on karymorphology of Melilotus officinalis populations in Bulgaria. Caryologia. 2005;57:151–158. doi: 10.1080/00087114.2004.10589385
- Sharma A, Sen S. Chromosome botany. Enfield (NH): Science Publishers; 2002.
- Soliman MI, Hafez EE, Zaghlol MS, et al. Karyotype analysis and chromosome evolution in three species of genus Plantago L. in Egypt. Asian J Adv Basic Sci. 2016;4(2):8–19.
- Mondini L, Noorani A, Pagnotta MA. Assessing plant genetic diversity by molecular tools. Diversity. 2009;I:19–35. doi: 10.3390/d1010019
- Khurana-Kaul V, Kachhwaha S, Kothari SL. Characterization of genetic diversity in Jatropha curcas L. germplasm using RAPD and ISSR markers. Indian J Biotechnol. 2012;11:54–61.
- Kumari N, Thakur SK. Randomly amplified polymorphic DNA-abreif review. Am J Anim Vet Sci. 2014;9:6–13. doi: 10.3844/ajavsp.2014.6.13
- Amirmoradi B, Talebi R, Karami E. Comparison of genetic variation and differentiation among annual Cicer species using start codon targeted (Scot) polymorphism, DAMD-PCR, and ISSR markers. Plant Syst Evol. 2012;298:1679–1688. doi: 10.1007/s00606-012-0669-6
- Boulos L. Flora of Egypt. Volume III. Cairo: Al Hadara Publishing; 2002.
- Chattopadhyay D, Sharma AK. A new technique for orcein banding with acid treatment. Stain Technol. 1988;63(5):283–287. doi: 10.3109/10520298809107602
- Abraham Z, Parasad PN. A system of chromosome classification and nomenclature. Cytologia. 1983;48:95–101. doi: 10.1508/cytologia.48.95
- Reeves A. Micro measure: a new computer program for the collection and analysis of cytogenetic data. Genome. 2001;44:439–443. doi: 10.1139/g01-037
- Williams JGK, Kubelik AR, Livak KJ, et al. DNA polymorphisms amplified by arbitrary primers are useful as genetic markers. Nucleic Acids Res. 1990;18:6531–6535. doi: 10.1093/nar/18.22.6531
- Collard BCY, Maackill DJ. Start codon Targted (Scot) polymorphism: a simple novel DNA marker technique for generating gene – targeted markers in plants. Plant Mol Biol. 2009;27:86–93. doi: 10.1007/s11105-008-0060-5
- Wilkinson L. Systat 7.0. Chicago (IL): SPSS Inc; 1997.
- Fregonezi JN, Fernandez T, Torezan JM, et al. Karyotype differentiation of four Cestrum species (Solanaceae) based on the physical mapping of repetitive DNA. Genet Mol Biol. 2006;29:97–104. doi: 10.1590/S1415-47572006000100019
- Yang RW, Zhou YH, Zhand Y, et al. The genetic diversity among Leymus species based on random amplified microsatellite polymorphism (RAMP). Gent Resour Crop Evol. 2006;53:139–144. doi: 10.1007/s10722-004-1933-6
- McCullagh D. Chromosome and chromosome morphology in Plantaginaceae I. Gentica. 1934;16:1–44. doi: 10.1007/BF01837857
- Janighorban M. Plantago in Assadi, et al. Flora of Iran no.14: 1–53. Research Institute of Forests and Rangelands; 1995.
- Badr SF. Relationships of some Plantago species. Taeckholmia. 1999;19(1):27–36. doi: 10.21608/taec.1999.12635
- Matsuo K, Noguchi J. Karyotype analysis of several Plantago species in Japan with special reference to taxonomic status of Plantago japonica. J Phytogeogr Taxon. 1989;37(1):27–35.
- Briggs BD. Chromosomal studies on Plantago in Australia. Contrib N S W Nation Herb. 1973;4:399–405.
- Huziwara Y. Karyotype analysis in some genera of compositae. VIII. Further studies on the chromosome of Aster. Am J Bot. 1962;49:116–119. doi: 10.1002/j.1537-2197.1962.tb14916.x
- Zarco C. A new method for estimating karyotype asymmetry. Taxon. 1986;35:526–530. doi: 10.2307/1221906
- Zuo L, Yuan Q. The difference between the heterogeneity of the centromeirc index and intrachromosomal asymmetry. Plant Syst Evol J. 2011;297:141–145. doi: 10.1007/s00606-011-0528-x
- Paplauskiene V, Dabkeviciene G. Genetic variability determination using ISSR-PCR markers in red clover varieties. Biologija. 2008;54(2):56–65. doi: 10.2478/v10054-008-0011-y
- Haneen WK. Cytogenetics and species interrelationships. Taechholmia. 2008;28:49–61.
- Aliyev RT, Abbasov MA, Mammadov AC. Genetic identification of diploid and tetraploid wheat species with RAPD markers. Turk J Biol. 2007;31:173–180.
- Mizuno N, Yamasaki M, Matsuoka Y, et al. Population structure of wild wheat D-genome progenitor Aegilops tauschii Coss.: implications for intraspecific lineage diver-sification and evolution of common wheat. Mol Ecol. 2010;19:999–1013. doi: 10.1111/j.1365-294X.2010.04537.x
- Ahsyee SR, Al-Sloge O, Calic I, et al. Genetic diversity of alfalfa domesticated varietal populations from Libyan gene bank revealed by RAPD markers. Arch Biol Sci. 2013;65(2):595–602. doi: 10.2298/ABS1302595A
- Alvarez A, Fuentes JL, Puldon V, et al. Genetic diversity analysis of Cuban traditional rice (Oryza sativa L.) varieties, based on microsatellite markers. Genet Mol Biol. 2007;30(4):1109–1117. doi: 10.1590/S1415-47572007000600014
- Kaswan V, Joshi A, Maloo SR. Assessment of genetic diversity in Isabgol (Plantago ovata Forsk.) using random amplified polymorphic DNA (RAPD) and inter-simple sequence repeat (ISSR) markers for developing crop improvement strategies. Afr J Biotechnol. 2013;12(23):3622–3635.