
Abstract
A series of new glucocorticoid oxadiazines (4–6) were synthesized by reacting glucocorticoids (1–3) with thiosemicarbazide and its derivatives. The structural assignment of products is confirmed on the basis of IR, 1H NMR, 13C NMR, MS and analytical data. The synthesized compounds (4–6) obeyed the Lipinski’s “Rule of Five” analysis based on a computational prediction of molecular and pharmacokinetic properties. The interaction studies of compounds (4–6) with DNA were carried out by employing single-cell gel electrophoresis (comet assay), UV-vis and fluorescence spectroscopy. Compounds (4–6) were found capable of cellular DNA degradation breakage in isolated normal human lymphocytes. Viscometric and steady-state measurements further correlated with the comet assay studies. Hence, it could be suggested that the glucocorticoid compounds bearing a core oxadiazine scaffold would be a potent biological agent. Molecular docking studies further characterize the interaction of the synthesized compounds with DNA.
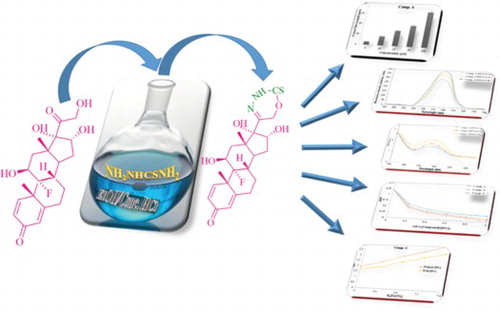
GRAPHICAL ABSTRACT
1. Introduction
Steroidal compounds have shown tremendous potential as putative curative agents for cancers and other diseases. It has been shown in recent studies that incorporation of heteroatoms (N/O/S) enhances the biological activities of steroid molecules [Citation1–5]. It was proved by various in vivo and in vitro assays which show significant antimicrobial, anti-inflammatory, hypotensive, hypocholesterolemic and diuretic activities [Citation6–15]. Similarly, such effects have been shown by the most commonly used systemic glucocorticoids such as hydrocortisone, prednisolone and triamcinolone. The glucocorticoids have good oral bioavailability and are eliminated mainly by hepatic metabolism and renal excretion of the metabolites [Citation16]. The beneficial effects of glucocorticoids in the treatment of chronic inflammatory diseases such as asthma, rheumatoid arthritis, inflammatory bowel disease and autoimmune disorders have been appreciated for over 50 years [Citation17–21]. A considerable research effort has been devoted to the structural modifications of some glucocorticoids, with a hope of increasing its potencies and bioavailability. Khan and Lee have reviewed the enormous literature with respect to the synthesis of derivatives of steroidal antedrugs [Citation22]. Despite enormous literature precedence, there are several unexplored opportunities for generating the heterocyclic compounds. In spite of significant advances in the field of the biological chemistry of glucocorticoids has been made, not many efforts have been made to obtain small heterocyclic fused ring products of the glucocorticoids moiety. It has been well established that the biological and hence therapeutic potential and consequent antedrug activities are drastically influenced by infusion of such a moiety.
2. Results and discussion
2.1. Chemistry
Highly functionalized molecules developed from simple building blocks has always fascinated the inquisitiveness of synthetic chemists. So, herein we report an expedient path for the synthesis of new derivatives (4–6) from a mixture of glucocorticoids (1–3) and thiosemicarbazide/4-phenylthiosemicarbazide/4-methyl-3-thiosemicarbazide/4-ethyl-3-thiosemicarbazide, (Table ) in EtOH using few of drops conc. HCl under reflux condition for 24 h. On completion of reaction, the products were obtained in better yields (75–80%) in case of 4-phenylthiosemicarbazide because it generates a better leaving group (anilinium ion) than all. The mechanism for the formation of compounds (4–6) involves the nucleophilic attack of the hydroxyl oxygen on the thionyl carbon of thiosemicarbazide,4-phenylthiosemicarbazide, 4-methyl-3-thiosemicarbazide and 4-ethyl-3-thiosemicarbazide making the ammonia,phenylamine, methylamine and ethylamine group to leave, which leads to the formation of six-membered heterocyclic moiety with a glucocorticoid skeleton as shown in . It has been confirmed by NMR studies that the major product will be the compounds (4–6) as it’s well known that simple ketones are more reactive than α, β-unsaturated ketones for the nucleophilic nature at carbonyl carbon. The structures of the products were established by means of their IR, 1H NMR, 13C NMR, MS and analytical data.
Scheme 1. Schematic reaction pathway of glucocorticoid derivatives (4–6).
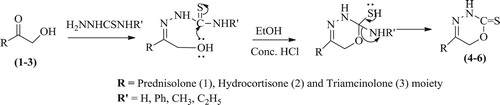
Table 1. Thiosemicarbazide derivatives and % yield.
The selected suggestive bands in IR spectra of targeted compounds (4–6) provide valuable information for determining their structures. In their IR spectra, the presence of absorption bands in the range 3427–3421 cm−1shows the presence of NH band. The absorption band in the region of 1651–1595 and 1061–1055 cm−1shows the presence of C = N and C–O, respectively. The absorption band at 1279–1249 cm−1 were ascribed to C = S, respectively, for the compounds (4–6). The absorption band at 980 cm−1 shows the presence of C-F in the compound (6). In 1HNMR study the downfield singlet at δ11.74-10.48 was ascribed to NH while in 13CNMR study, the signals at δ150.5–152.5 and δ155.5–156.2 confirm the presence of C = S and C = N groups, respectively, in the compounds (4–6). Finally the presence of distinct molecular ion peak [M+.] at m/z: 416, 418 and 450 in the MS spectra also proved the formation of the compounds (4–6), respectively. The strategy can also be applied to varied glucocorticoids which may allow further modifications on the substituted heterocyclic moiety.
3. Rule of Five and bioactivity score
For biological activity the Lipinski’s rule was used as a filter to choose the reasonable scaffolds [Citation2,Citation23–26]. The physicochemical parameters which include octanol partition coefficients (C log P), Mw, HBD, HBA and TPSA were calculated using ChemBioOffice2015. Molinspiration server (http://www.molinspiration.com/cgi-bin/properties) was used to calculate the bioactivity score. The Lipinski’s rule which is widely used as a filter for drug-like properties states that most molecules with good membrane permeability have log P ≤ 5, molecular weight ≤500, number of hydrogen bond acceptors ≤10, number of hydrogen bond donors ≤5. This rule is widely used as a filter for drug-like properties. As can be seen in (Table ) the synthesized compounds (4–6) showed no violation of Lipinski rules. The results displayed that all the compounds (4–6) having polar surface area less than 140 Å2. Moreover, the synthesized compounds (4–6) acquired rotatable bonds less than 10.
Table 2. Estimated physicochemical properties of oxadiazine derivative of glucocorticoids (4–6).
The observed results showed that the synthesized compounds obeyed the Lipinski’s “Rule of Five” analysis based on a computational prediction of molecular and pharmacokinetic properties [Citation27] and have good oral absorption. The exceptions to the Lipinski’s rule were recognized and involve anticancer drugs such as Doxorubicin [Citation28,Citation29]. The physicochemical properties of the synthesized compounds are sensible starting point for a drug discovery effort. The bioactivity scores of the synthesized compounds (4–6) were also calculated for six criteria, GPCR ligand activity, ion channel modulation, kinase inhibition activity, protease inhibitor, enzyme inhibitor and nuclear receptor ligand activity (Table ).
Table 3. Bioactivity scores of oxadiazine derivative of glucocorticoids (4–6).
As a general rule, for a synthesized compound to be active, larger is the bioactivity score, higher is the probability. For organic molecules if the bioactivity score is (>0.00), then the compound is active, but if it is between −0.50 and 0.00 then the compound is moderately active and if the compound (<−0.50), then the compound is inactive. The results are mentioned in (Table ), showed that some compounds are biologically active, some are moderately active and some are inactive molecules.
3.1. DNA breakage by compounds 4–6 in normal cellular lymphocytes as measured by comet assay
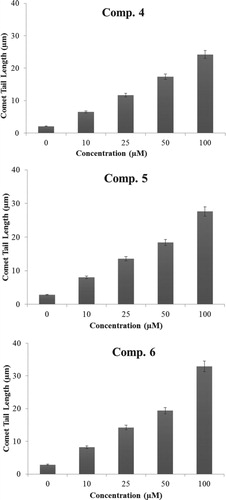
The ability of compounds (4–6) to cause DNA strand breaks in a cellular system of normal human peripheral lymphocytes as measured by standard comet assay shown in Figure , although the compounds (4–6) tested cause significant breakage of cellular DNA in isolated normal lymphocytes. The degree of such breakage is found to be maximum in compound (6) and is found of the order of 6 > 5 > 4. The increase in DNA damage suggested that glucocorticoids derivative induced dose-dependent fragmentation of chromosomal DNA leading to necrobiosis.
Figure 1. DNA breakage by compounds 4–6 in human lymphocytes was analysed by comet tail length (µms) plotted as a function of increasing concentrations of compounds (0–100 µM). All points represent mean of three independent experiments. Error bars denote mean ± SEM. P-value <.05 and significant when compared to control (0 µM).
4. DNA binding experiments
4.1. Fluorescence spectroscopic studies
The various molecular interactions such as excited state reactions, molecular rearrangements, energy transfer and collision are studied by using the technique of fluorescent quenching [Citation30]. In the present study, we have undertaken the fluorescent quenching technique to investigate the interaction of glucocorticoid oxadiazine derivatives (4–6) with CT DNA [Citation31]. The compounds (4–6) were excited at their respective λmax. Calf thymus DNA was added to exhibit a gradual increase in fluorescence emission intensity which implied that compounds (4–6) reveal strong interaction with DNA as illustrated in Figure , The increase in the emission intensity is greatly due to the extent to which the molecule is inserted into the hydrophobic environment of DNA. Since the surroundings inside the DNA helix is hydrophobic it lessens the accessibility of solvent molecules at the binding site and thus precluding the quenching effect. The binding of the compound to the DNA helix could decrease the collisional frequency of solvent molecules with the compound which leads to the emission enhancement of the compound.
Figure 2. Fluorescence spectra of the compounds 4–6 with increasing concentration of calf thymus DNA in molar base pair ratio. [Tris-HCl buffer (0.01 M, pH 7.2)].
![Figure 2. Fluorescence spectra of the compounds 4–6 with increasing concentration of calf thymus DNA in molar base pair ratio. [Tris-HCl buffer (0.01 M, pH 7.2)].](/cms/asset/92443410-92ff-4c8e-8fbf-b31f01923827/tusc_a_1603575_f0002_oc.jpg)
4.2. Absorption studies
The absorption spectra are used to determine the binding strength and the mode of DNA binding with small molecules [Citation32]. The UV-vis spectra Figure of compounds 4–6 with increasing concentrations of CT DNA exhibited an intense absorption band centred at 280 nm for compound (6). The ratio of the absorbance of Ct-DNA at 170 and 280 nm in 10 mM Tris-HCl buffer (pH 7.2) was taken. The concentration of Ct-DNA was determined from its absorption intensity at 260 nm with a molar extinction coefficient of 6600 M−1 cm−1 [Citation33]. The experiments were performed by titrating increasing concentrations of DNA to a fixed concentration of each complex. The blanks were taken for each tube comprising an equal amount of Ct-DNA present in the sample without any complex. After baseline correction using DNA solution as a blank and the observed absorbance is due to the occurrence of the complex with DNA.
Figure 3. Absoroption spectra of the compounds 4–6 with increasing concentration of calf thymus DNA in molar base pair ratio. [Tris-HCl buffer (0.01 M, pH 7.2)].
![Figure 3. Absoroption spectra of the compounds 4–6 with increasing concentration of calf thymus DNA in molar base pair ratio. [Tris-HCl buffer (0.01 M, pH 7.2)].](/cms/asset/87e39455-94f8-41cf-b813-d9cb6daa98e2/tusc_a_1603575_f0003_oc.jpg)
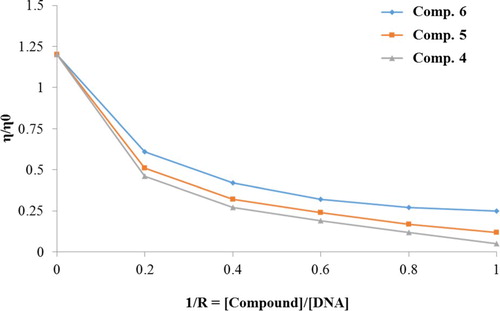
4.3. Viscometric measurements
Viscosity measurements were performed on calf thymus DNA with the endeavour of clarifying the binding mode of the compounds (4–6) to DNA by varying the concentration of the compounds added. Due to the increase in separation of the base pairs at the intercalation sites a classical intercalative molecular interaction causes a significant increase in viscosity of the DNA solution and hence an increase in the overall DNA length was observed.
For compounds (4–6), the viscosity of calf thymus DNA decreases with increase in the ratio of compounds to calf thymus DNA, due to the interaction of compounds with DNA generating bends in the DNA strand. The values of relative viscosity (η/ηo), where η and ηo are the specific viscosities of DNA in the presence and absence of the compounds, were determined and plotted against values of 1/R (R = [Compound]/[DNA]) (Figure ).
Figure 4. Effect of increasing amount of compounds 4–6 on the relative viscosity of calf thymus DNA.
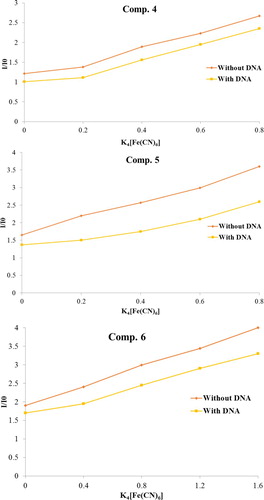
4.4. Steady-state binding experiment
A steady-state competitive binding experiment of the compounds (4–6) with an anionic quencher K4 [Fe(CN)6] M−1 which may afford further information about the binding of the compound to DNA was carried out. In the absence and presence of DNA, compounds (4–6) were proficiently quenched by K4 [Fe(CN)6] M−1 [Citation34]. Stern–Volmer plot of I/I0vsK4 [Fe(CN)6] M−1 for the three complexes are illustrated in Figure .
Figure 5. Emission quenching curves of compounds 4–6 in the absence & presence of calf thymus DNA.
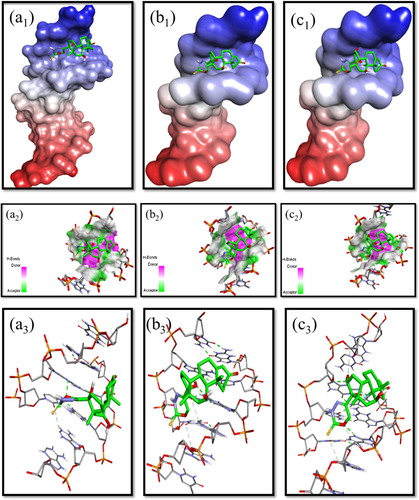
4.5. Molecular docking
Molecular docking has gained a growing interest in the investigation of binding interaction mechanism of biological macromolecules with small molecules. It plays an important role to understand the drug-DNA interactions for rational drug designing and discovery. Molecular docking studies of nucleic acids and their complexes can provide valuable information that is not available by other experimental techniques. This method gives the possibility to study an active site in detail and can be used for hit identification, virtual screening and binding mode determination. In the present work, molecular docking studies were performed to predict the binding modes of compounds (4–6) with DNA duplex of sequence d(CGCGAATTCGCG)2 (PDBID: 1BNA), and provide an energetically favourable docked structures Figure . The minimized conformation of compounds (4–6) sitting in the groove of the sequence d(CGCGAATTCGCG)2 show hydrogen bonding with the oxygen of the oxadiazine ring and –OH group of glucocorticoid moiety in the docked pose of the dodecamer. Generally, the more negative the relative binding energy, the stronger is the interaction between molecule and DNA and more stable is the compound formed. Thus, the compound formed between compound (6) and DNA with relative binding energy of −8.6 kcal mol−1 might be having highest stability than compound (5) (−8.4 kcal mol−1) and (4) (−7.9 kcal mol−1) in the order 6 > 5>4. Irrespective of the absence of any net positive charge on compounds (4–6), negative values of the relative binding energies indicated a higher binding potential of these compounds with DNA. Thus, we can conclude that there is a mutual complement between spectroscopic techniques and molecular modelling, which can provide valuable information about the mode of interaction of the compounds with DNA and the conformation constraints for adduct formation.
Figure 6. Molecular modelling studies (a1–c1) Surface representation showing the docked structure of steroidal oxadiazines(4–6) to 1BNA dodecamer d(CGCGAATTCGCG)2, respectively; (a2–c2) Showing closest view of surface around ligand;(a3–c3). Stereoview of the docked conformation of steroidal oxadiazine-Ct-DNA compounds (4–6), respectively, showing the possibility of hydrogen bonds.
5. Materials and methods
Chemicals were purchased from Merck and Sigma-Aldrich as analytical grade and used without further purification. Melting points were determined on a Biogen digital auto melting point apparatus. The IR spectra were recorded on KBr pellets with PyeUnicam SP3-100 Spectrophotometer and values are given in cm−1. 1H and 13C NMR spectra were run in CDCl3 on a Bruker AvanceII 400 NMR Spectrometer (operating at 400 MHz for 1H and at 100 MHz for 13C NMR) with TMS as internal standard and values are given in parts per million (ppm) (δ). Mass spectra were recorded on a JEOL D-300 Mass spectrometer. Elemental analysis was recorded on Perkin Elmer 2400 CHN Elemental Analyzer. Thin layer chromatography (TLC) plates were coated with silica gel G and exposed to iodine vapours to check the homogeneity as well as the progress of the reaction. Sodium sulphate (anhydrous) was used as a drying agent. Agarose, Calf thymus DNA, low melting point agarose (LMPA), RPMI 1640, Trypan blue, Histopaque1077 and phosphate buffered saline (PBS) Ca2+ and Mg2+ free were purchased from Sigma (St. Louis, MO). Compounds (4–6) were dissolved in 2 mM dimethyl sulphoxide before use as a stock of 1 mM solution. When added to reaction mixtures, in the presence of buffers concentrations talk about, all the compounds employed stayed in solution. The quantity of stock solution added did not initiate significant change in the pH of reaction mixtures.
5.1. Synthesis of oxadiazine derivative of glucocorticoids (4–6)
To a boiling solution of glucocorticoid (1–3) (1.38 mmol) in EtOH (7.5 mL), a few drops of conc. HCl were added followed by thiosemicarbazide and its derivatives (1.34 mmol) in EtOH (4.5 mL) with stirring. The reaction mixture was refluxed and stirred for about 24 h. After completion of reaction (monitored by TLC), the heavy precipitate was formed which was suspended in water (30 ml), filtered using suction and air dried. For further purification, the compounds were recrystallized from EtOH to give desirable products (4–6).
5.2. 3′,6′- Dihydro-2H-1′,3′,4′- oxadiazine-2′-thione-5′(17)-prednisolone (4)
Yellow powder, mp 183–184°C, yield: (80%). IR (KBr) υmax/cm−1 3424 (NH), 1651 (C = N), 1061 (C–O) and 1249 (C = S). 1H NMR (400 MHz, CDCl3): δ 10.48 (s, 1H, NH), 5.89 (s, 1H, C11–OH), 6.14 (s, 1H, C17–OH), 4.12 (m,1H, C11–αH), 1.26 (s, 3H, C10–CH3), 0.88 (s, 3H, C13–CH3). 13C NMR (100 MHz, CDCl3): δ 153.55 (C1), 130.32 (C2), 180.21 (C3), 120.40 (C4), 160.24 (C5), 39.15 (C6), 39.32 (C7), 37.63 (C8), 48.51 (C9), 54.93 (C10), 78.32 (C11), 46.21 (C12), 79.05 (C13), 49.71 (C14), 37.62 (C15), 38.90 (C16), 40.10 (C17), 15.11(C18), 16.90 (C19), 155.55 (C5′), 70.91 (C6′), 150.55 (C2′). MS (EI): m/z 416 [M+]. Anal. Calcd. (%) for C22H28N2O4S (416): C, 63.44, H, 6.78, N, 6.73, found: C, 63.49, H, 6.75, N, 6.70.
5.3. 3′,6′- Dihydro-2H-1′,3′,4′- oxadiazine-2′-thione-5′(17)-hydrocortisone (5)
Yellow powder, mp 146–148°C, yield: (78%). IR (KBr) υmax/cm−1 3427 (NH), 1595 (C = N), 1059 (C–O) and 1279 (C = S). 1HNMR (400 MHz, CDCl3): δ 11.74 (s, 1H, NH), 3.84 (s, 1H, C11–OH), 5.70 (s, 1H, C17–OH), 3.58 (m, 1H,C11–αH), 1.29 (s,3H,C10–CH3), 0.86 (s, 3H, C13–CH3). 13CNMR (100 MHz, CDCl3): δ 34.52 (C1), 32.21 (C2), 186.25 (C3), 125.11 (C4), 172.23 (C5), 31.55 (C6), 32.35 (C7), 30.31 (C8), 57.72 (C9), 38.61 (C10), 67.54 (C11), 42.22 (C12), 48.02 (C13), 49.51 (C14), 22.44 (C15), 29.53 (C16), 82.11 (C17), 16.45 (C18), 19.55 (C19), 155.83 (C5′), 81.11 (C6′), 151.51 (C2′). MS (EI): m/z 418 [M+]. Anal.Calcd. (%) for C22H30N2O4S (418): C, 63.13, H, 7.22, N, 6.69, found: C, 63.17, H, 7.19, N, 6.72.
5.4. 3′,6′- Dihydro-2H-1′,3′,4′- oxadiazine-2′-thione-5′(17)-triamcinolone (6)
Yellow powder, mp 195–197°C, yield: (75%). IR (KBr) υmax/cm−1 3421 (NH), 1596 (C = N), 1055 (C–O), 980 (C–F) and 1278 (C = S). 1HNMR (400 MHz, CDCl3): δ 10.66 (s, 1H, NH), 4.36 (s, 1H, C11–OH), 6.00 (s, 1H, C16–OH), 6.26 (s, 1H, C17–OH), 3.51 (m,1H,C11–αH), 3.93 (brs,1H,C16–βH), 1.40 (s,3H,C10–CH3), 0.88 (s, 3H, C13–CH3). 13CNMR (100 MHz, CDCl3): δ 154.21 (C1), 130.25 (C2), 178.22 (C3), 129.13 (C4), 177.80 (C5), 29.91 (C6), 25.44 (C7), 35.65 (C8), 98.22 (C9), 47.51 (C10), 71.25 (C11), 30.25 (C12), 35.53 (C13), 40.73 (C14), 29.61 (C15), 75.53 (C16), 86.32 (C17), 17.22 (C18), 20.15 (C19), 156.20 (C5′), 60.51 (C6′), 152.51 (C2′). MS (EI): m/z 450 [M+]. Anal.Calcd. (%) for C22H27FN2O5S (450): C, 58.65, H, 6.04, N, 6.22, found: C, 58.61, H, 6.02, N, 6.25.
6. Isolation of lymphocytes
From a single healthy donor heparinized blood samples (2 mL) were achieved by venepuncture and diluted suitably in Ca2+ and Mg2+ free PBS. Histopaque 1077 (Sigma) was used to isolate lymphocytes from blood and the cells were finally overhanging in RPMI 1640. For all the experiments a single donor donated the blood.
7. Viability assessment of lymphocytes
Trypan Blue Exclusion Test [Citation35] was used to check the viability of lymphocytes before and after the reaction.
7.1. Treatment of lymphocytes and evaluation of DNA breakage by alkaline single-cell gel electrophoresis (Comet assay)
The method employed by Singh et al. [Citation36] was used to performed comet assay with minor modifications. Fully frosted slides precoated with 1.0% normal melting agarose were applied. After treatment with compounds (4–6) about 10,000 cells were mixed with 90 µL of 1.0% LMPA to form a cell suspension and were pipetted over the first layer and covered with a cover slip. To solidify the agarose the slides were kept on an ice pack for 10 min. The coverslips were smoothly taken out and a third layer of 0.5% LMPA was pipetted. The slides were again covered with cover slips and were placed on ice packs to solidify. The slides were immersed in ice-cold lysis buffer for an hour after removing the cover slips. After lysis, the DNA was allowed to unwind in alkaline electrophoretic solution (300 mM NaOH, 1 mM EDTA, pH >13). Electrophoresis was carried out in a field strength of 0.7 V/cm and 300 mA current at 4°C. The slides were neutralized with ice-cold 0.4 M Tris pH 7.5 and stained with 75 µL ethidium bromide (20 mg/mL) and then covered with a cover slip. By using an image analysis system (Komet 5.5, Kinetic Imaging, Liverpool, UK) attached to an Olympus (CX41) fluorescent microscope (Olympus Optical Co., Tokyo, Japan) and a COHU 4910 integrated CC camera (equipped with 510–560 nm excitation and 590 nm barrier filters) (COHU, San Diego, CA, USA)the slides were scored. From each triplicate slide, images of 50 cells were analysed. DNA breakage was performed by using tail length (migration of DNA from nucleus in µ meters) parameters.
8. Statistics
The statistical analysis was performed as described by Tice et al. [Citation37] and is expressed as mean ± SEM/SD of three independent experiments. Variance analysis was performed using ANOVA.p-values <.05 were considered statistically significant.
9. DNA binding experiments
9.1. Absorption and fluorescence spectroscopy
The absorption and fluorescence spectroscopy was done using the standard methods reported in the literature [Citation38,Citation39]. The absorption spectra of the complexes (4–6) were recorded on UV-1800 Shimadzu spectrophotometer. All experiments were carried out by fluorometric titration using a Shimadzu spectrofluorometer-5301 (Japan) equipped with constant temperature holder attached with Neslab RTE-110 water bath with an accuracy of ±0.1°C. The excitation was done at 240 nm while the emission spectra (280–380) nm was obtained for all complexes with the widths of both slits (excitation and emission) were set to 5 small fluorescence studies. The fluorescence experiment was performed using complex (10 µM) with the varying range of concentrations of Ct-DNA.
9.2. Viscosity measurements
Viscosity measurements confirmed to the standard methods when DNA binding studies were carried out and practices previously explained in the literature [Citation40–43]. Viscosity measurements were performed from observed flow time of CT-DNA containing a solution (t > 100 s) corrected for the flow time of buffer alone (t0), using Ostwald’s Viscometer at 25 ± 0.01°C. Digital stopwatch was used to measure flow time.
9.3. Molecular docking studies
Molecular docking studies were carried out using Autodock 4.0 to study the interaction of compounds (4–6) with B-DNA. The Lamarckian genetic algorithm used for calculations were employed in Autodock 4.0 which was proven to be more reliable, sensitive and effective [Citation44–46]. The crystal structure of B-DNA dodecamer d(CGCAAATTTCGC)2 (PDB ID: 1BNA) were downloaded from the protein data bank (http://www.rcsb.org./pdb). The three-dimensional structure of compounds (4–6) were drawn using Chem Draw 12.0 and the structures were saved in.sdf format which was converted to.pdb format by Avogadro’s 1.01 [Citation47]. All water molecules were removed before performing docking and Kollmann charges were introduced along with the polar hydrogen atoms. The size of the grid was set to 52, 64 and 102 along the x-axis, y-axis and z-axis respectively, with a spacing of 0.542 Å having centre of grid at x = 14.7, y = 20.9, z = 8.8. Out of different conformers docked, conformer with the minimum energy was taken into account. Docked conformation analysis was done using Accelrys Discovery Studio 4.0.
10. Conclusions
The effectively developed, expedient and operationally simple strategy for improved synthesis of glucocorticoid oxadiazines was successful. The synthesized compounds were subjected to DNA binding studies, and the results show that compounds 4–6 were found to be of order 6 > 5>4. Necrobiosis and genotoxicity were depicted by comet assay. Both absorbance and fluorescence studies showed the interaction of compounds (4–6) with DNA suggesting the stabilization of the energy levels of the compounds in the presence of DNA. Further, the relative viscosity index and Stern–Volmer indices were found to be maximum for compound (6) followed by (5) and (4), respectively, suggesting the significance of a structural feature of the glucocorticoids. The cleavage and molecular docking studies carried out in the present work which are in total agreement with the primary intercalative interactions can also be argued. Hence, the present work has shown that these synthesized compounds can be used as a template for future development by designing more potent and selective cytotoxic agents.
Supplemental Material
Download MS Word (103.7 KB)Acknowledgements
Authors thank the Chairman, Department of Chemistry, A.M.U., Aligarh, for providing necessary research facilities. Facilities provided by SAP (DRS-II), FIST & PURSE for their generous research support are gratefully acknowledged. SAIF Punjab University, Chandigarh, is acknowledged for spectral analysis.
Disclosure statement
No potential conflict of interest was reported by the authors.
ORCID
Sultanat http://orcid.org/0000-0001-8736-5544
Abad Ali http://orcid.org/0000-0001-6958-3177
Mohd Asif http://orcid.org/0000-0002-6108-6595
Mohd Farhan http://orcid.org/0000-0002-1519-9644
Additional information
Funding
Related Research Data
References
- Bansal R, Guleria S, Thota S, et al. Design, synthesis and evaluation of novel 16-Imidazolyl substituted steroidal derivatives possessing potent diversified pharmacological properties. Steroids. 2012;77:621–629. DOI:10.1016/j.steroids.2012.02.005.
- Ali A, Asif M, Khanam H, et al. Synthesis and characterization of steroidal heterocyclic compounds, DNA condensation and molecular docking studies and their in vitro anticancer and acetylcholinesterase inhibition activities. RSC Adv. 2015;5:75964–75984. DOI:10.1039/C5RA11049A.
- Shamsuzamman, Ali A, Asif M, et al. Green synthesis of Zno nanoparticles using Bacillus Subtilis and their catalytic performance in the one-pot synthesis of steroidal thiophenes. Eur Chem Bull. 2014;3:939–945. DOI:10.17628/ecb.2014.3.939-945.
- Shamsuzzaman, Mashrai A, Khanam H, et al. Green synthesis and biological evaluation of steroidal 2H-Pyrans as anticancer and antioxidant agents. J King Saud Univ Sci. 2015;27:1–6. DOI:10.1016/j.jksus.2013.10.001.
- Ali, A.; Asif, M.; Alam, P.; Alam, M. J.; Sherwani, M. A.; Khan, R. H.; Ahmad, S.; Shamsuzzaman. DFT/B3LYP calculations in vitro cytotoxicity and antioxidant activities of steroidal pyrimidines and their interaction with HSA using molecular docking and multispectroscopic techniques. Bioorg Chem. 2017, 73, 83–99. DOI:10.1016/j.bioorg.2017.06.001.
- Manson AJ, Stonner FW, Neumann HC, et al. Steroidal Heterocycles. VII.1 androstano[2,3-d]isoxazoles and related compounds. J Med Chem. 1963;6:1–9. DOI:10.1021/jm00337a001.
- Hirschmann R, Steinberg NG, Buchschacher P, et al. Synthesis and structure of steroidal 4-Pregneno [3,2-c]pyrazoles. A novel class of potent anti-inflammatory Steroids. J Am Chem Soc. 1963;85:120–122. DOI:10.1021/ja00884a034.
- Hirschmann R, Buchschacher P, Steinberg NG, et al. Synthesis and structure of steroidal Pregn-4-eno- and 5α-Pregnano [3,2-c]pyrazoles. A novel Class of potent anti-inflammatory steroids. J Am Chem Soc. 1964;86:1520–1527. DOI: 10.1021/ja01062a015.
- Miller TC. 5α-Androstano [3,2-b]pyridines, 5α-Androstano[17,16-b]pyridines and Androst-4 and 5-eno[17,16-b]pyridines. J Heterocycl Chem. 1966;3:338–344. DOI:10.1002/jhet.5570030321.
- Laitonjam WS, Rajkumar TS, Chingakham BS. Synthesis of some A- and D-ring fused steroidal Pyrazoles. Steroids. 2002;67:203–209. DOI:10.1016/S0039-128X(01)00146-5.
- Gupta R, Pathak D, Jindal DP. Synthesis and biological activity of Azasteroidal [3,2-c]- and [17,16-c]pyrazoles. Eur J Med Chem. 1996;31:241–247. DOI:10.1016/0223-5234(96)89140-9.
- Shamsuzzaman, Khanam H, Mashrai A, et al. Synthesis, crystal structure, Hirshfeld surfaces, and thermal, mechanical and dielectrical properties of Cholest-5-ene. JTaibah Univ Sci. 2017;11:141–150. DOI:10.1016/j.jtusci.2016.01.001.
- Furkan M, Alam MT, Rizvi A, et al. Aloe emodin, an anthroquinone from aloe vera acts as an anti aggregatory agent to the thermally aggregated hemoglobin. Spectrochim Acta Part A Mol Biomol Spectrosc. 2017;179:188–193. DOI:10.1016/j.saa.2017.02.014.
- Shoeb M, Mobin M, Ali A, et al. Graphene-mesoporous anatase TiO2 nanocomposite: A highly efficient and recyclable heterogeneous catalyst for one-pot multicomponent synthesis of benzodiazepine derivatives. Appl Organomet Chem. 2017;27:1–18. DOI:10.1002/aoc.3961.
- Nasir Z, Ali A, Shakir M, et al. Silica-supported NiO nanocomposites prepared via a Sol–Gel technique and their excellent catalytic performance for one-pot multicomponent synthesis of benzodiazepine derivatives under microwave irradiation. New JChem. 2017;41:5893–5903. DOI:10.1039/C6NJ04013F.
- Davis M, Williams R, Chakraborty J, et al. Br. Prednisone or prednisolone for the treatment of chronic active hepatitis? A comparison of plasma availability. J Clin Pharmacol. 1978;5:501–505. DOI:10.1111/j.1365-2125.1978.tb01664.x.
- Czock D, Keller F, Rasche FM, et al. Pharmacokinetics and pharmacodynamics of systemically administered glucocorticoids. Clin Pharmacokinet. 2005;44:61–98. DOI:10.2165/00003088-200544010-00003.
- Fiel SB, Vincken W. Systemic corticosteroid therapy for acute asthma exacerbations. Journal of Asthma. 2006;43:321–331. DOI:10.1080/02770900600567163.
- Thrower BW. Relapse management in multiple sclerosis. Neurologist. 2009;15:1–5. DOI:10.1097/NRL.0b013e31817acf1a.
- Ansari A, Ali A, Asif M, et al. Review: biologically active Pyrazole derivatives. New J Chem. 2017;41:16–41. DOI:10.1039/C6NJ03181A.
- Khanam H, Ali A, Asif M, et al. Neurodegenerative diseases linked to misfolded proteins and their therapeutic approaches: a review. Eur J Med Chem. 2016;124:1121–1141. DOI:10.1016/j.ejmech.2016.08.006.
- Khan MOF, Lee H. Synthesis and pharmacology of anti-inflammatory steroidal antedrugs. J Chem Rev. 2008;108:5131–5145. DOI:10.1021/cr068203e.
- Marmur J. A procedure for the isolation of deoxyribonucleic acid from micro-organisms. J Mol Biol. 1961;3:208–218. DOI:10.1016/S0022-2836(61)80047-8.
- Reichmann ME, Rice SA, Thomas CA, et al. A further examination of the molecular weight and size of Desoxypentose nucleic acid. J Am Chem Soc. 1954;76:3047–3053. DOI:10.1021/ja01640a067.
- Wolfe A, Shimer GH, Meehan T. Polycyclic aromatic hydrocarbons physically intercalate into duplex regions of denatured DNA. Biochemistry. 1987;26:6392–6396. DOI:10.1021/bi00394a013.
- Lakowicz JR, Weber G. Quenching of fluorescence by oxygen. Probe for structural Fluctuations in macromolecules. Biochemistry. 1973;12:4161–4170. DOI:10.1021/bi00745a020.
- Pool-Zobel BL, Guigas C, Klein R, et al. Assessment of genotoxic effects by Lindane. FoodChemToxicol. 1993;31:271–283. DOI:10.1016/0278-6915(93)90077-C.
- Singh NP, McCoy MT, Tice RR, et al. A simple technique for quantitation of low levels of DNA damage in individual cells. Exp Cell Res. 1988;175:184–191. DOI:10.1016/0014-4827(88)90265-0.
- Lee RF, Steinert S. Use of the single cell Gel electrophoresis/comet assay for detecting DNA damage in aquatic (marine and freshwater) animals. Mutat ResFund Mol M. 2003;544:43–64. DOI:10.1016/S1383-5742(03)00017-6.
- Eftink MR. Fluorescence quenching reaction: probing biological macromolecular structures, biophysical and biochemical aspects of fluorescence spectroscopy. New York: Plenum Press; 1991.
- Singh TS, Mitra S. Interaction of Cinnamic acid derivatives with serum albumins: a fluorescence spectroscopic study. Spectrochim Acta A MolBiomolSpectrosc. 2011;78:942–948. DOI:10.1016/j.saa.2010.11.046. Epub 2010 Dec 22.
- Wang BD, Yang ZY, Crewdson P, et al. Synthesis, crystal structure and DNA binding studies of the Ln(111) complex with 6-hydroxychromone-3-carbaldehyde benzoyl hydrazone. J Inorg Biochem. 2007;101:1492–1504. doi: 10.1016/j.jinorgbio.2007.04.007
- Rahman Y, Afrin S, Husain MA, et al. Unravelling the interaction of Pirenzepine, a gastrointestinal disorder drug, with calf thymus DNA: an in vitro and molecular modelling study. Arch BiochemBiophys. 2017;1:625–626. DOI:10.1016/j.abb.2017.05.014.
- Mandal A, Ghosh S, Bothra AK, et al. Synthesis of Friedelan Triterpenoid analogs with DNA topoisomerase IIα Inhibitory activity and their molecular docking studies. Eur JMedChem. 2012;54:137–143. DOI:10.1016/j.ejmech.2012.04.037.
- Asif M, Ali A, Zafar A, et al. Microwave-assisted one pot synthesis, characterization, biological evaluation and molecular docking studies of steroidal thiazoles. J Photochem Photobiol B Biol. 2017;166:104–115. DOI:10.1016/j.jphotobiol.2016.11.010.
- Wani MY, Bhat AR, Azam A, et al. Nitroimidazolyl hydrazones are better amoebicides than their Cyclized 1,3,4-Oxadiazoline analogues: in vitro studies and lipophilic efficiency analysis. Eur J Med Chem 2013;64:190–199. DOI:10.1016/j.ejmech.2013.03.034.
- Lipinski CA, Lombardo F, Dominy BW, et al. Experimental and computational approaches to estimate solubility and permeability in drug discovery and development settings. J Adv Drug Deliv Rev. 1997;23:3–25. DOI:10.1016/S0169-409X(96)00423-1.
- Reicmann ME, Rice SA, Thomas CA, et al. A further Examination of The molecular weight and size of deoxy pentose nucleic acid. J Am ChemSoc. 1954;76:3047–3053. doi: 10.1021/ja01640a067
- Wolfe A, Shimer GH, Meehan T. Polycyclic aromatic hydrocarbons physically intercalate into duplex regions of denatured DNA. Biochemistry. 1987;26:6392–6396. doi: 10.1021/bi00394a013
- Hanwell MD, Curtis DE, Lonie DC, et al. Avogadro: an advanced semantic chemical editor, visualization, and analysis platform. J Cheminform. 2012;4:1–17. DOI:10.1186/1758-2946-4-17.
- Shamsuzzaman, Abdul Baqi KAA, Ali A, et al. Synthesis, characterization, biological evaluation and molecular docking of steroidal Spirothiazolidinones. J Mol Struct. 2015;1085:104–114. DOI:10.1016/j.molstruc.2014.12.036.
- Shamsuzzaman, Asif M, Ali A, et al. Design, synthesis and biological Evaluation of steroidal tetrazoles as antiproliferative and antioxidant agents. Eur Chem Bull. 2014;3:1075–1080. DOI:10.17628/ECB.2014.3.1075.
- Shamsuzzaman A, Baqi KAA, Asif M, et al. Design, synthesis and docking studies of novel Spiroazetidinone substituted steroidal derivatives possessing potent diversified pharmacological properties. Eur ChemBull 2015;4:154–164.
- Lipinski CA. Lead- and drug-like compounds: The rule-of-five revolution. Drug Discov Today Technol. 2004;1:337–341. DOI:10.1016/j.ddtec.2004.11.007.
- Egli M, Flavell A, Pyle AM, et al. Nucleic acids in chemistry and biology. 3rd ed. RSC Pub; 2006.
- Chaveerach U, Meenongwa A, Trongpanich Y, et al. DNA binding and cleavage behaviors of copper(II) complexes with Amidino-O-Methylurea and N-Methylphenyl-Amidino-O-Methylurea, and their antibacterial activities. Polyhedron. 2010;29:731–738. DOI:10.1016/j.poly.2009.10.031.
- Liu F, Wang K, Bai G, et al. The pH-induced emission Switching and Interesting DNA-binding properties of a novel Dinuclear ruthenium(II) complex. Inorg Chem 2004;43:1799–1806. DOI:10.1021/ic035109x.