
 ?Mathematical formulae have been encoded as MathML and are displayed in this HTML version using MathJax in order to improve their display. Uncheck the box to turn MathJax off. This feature requires Javascript. Click on a formula to zoom.
Abstract
Calcium Tartrate crystals were synthesized using sol–gel technique. Linear optical studies of the crystals were carried out in the UV–Vis-NIR spectral range. Nonlinear optical open aperture z-scan studies were done using high sensitive z-scan experimental technique. Both saturable absorption and reverse saturable absorption behaviour were observed at different input fluences. Reverse saturable absorption characteristic of the crystals make them suitable for optical limiting applications. Our analysis revealed that the novel crystal has the optimum values for the optical limiting parameters which are required for a high-performance optical limiter.
Highlights
Open aperture z-scan and optical limiting of CaTT crystals are reporting for the first time.
Crystals show both saturable and reverse saturable absorption.
The optical limiting response of pure CaTT-crystals is better than CaTT-electric crystals.
1. Introduction
The widespread interest in nonlinear optical crystalline materials has been motivated by their potential use in the fabrication of all-optical photonic devices [Citation1–6]. Transparent crystalline materials can exhibit different kinds of optical nonlinearities which are associated with nonlinear polarization. Recent years have witnessed an increased interest in research activities related to Calcium Tartrate (CaTT) crystals. CaTT single crystals have been found to have diverse applications in the field of optoelectronics on account of their ferroelectric and nonlinear optical characteristics [Citation7–14]. Most often, research efforts have concentrated on synthesis and characterization of the CaTT crystals. Although there have been a large number of reports on various properties of these crystals, nonlinear optical properties of these crystals are rarely studied [Citation15–23]. The CaTT crystal exhibits promising values of nonlinear optical parameters and hence it can be considered as a potential candidate for nonlinear optical applications [Citation24,Citation25].
In this context, linear optical studies, optical band gap determination, open aperture z-scan and optical limiting analysis of CaTT crystals is deserving of attention which to our knowledge have not been reported so far. Understanding the nonlinear optical properties of CaTT crystals is a pre-requisite for considering nonlinear optical applications. The purpose of the present study is to prepare CaTT crystals in different environments and to study their nonlinear optical properties such as open aperture z-scan and optical limiting. All derived or observed results are compared with similar systems found in the literature.
2. Experimental
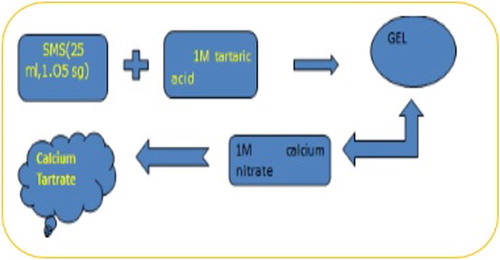
CaTT crystals were prepared by sol–gel technique by employing a single diffusion method. Medium for crystal growth, hydro silica gel, was prepared from sodium meta silicate (SMS). The specific gravity of the gel and pH of the solution determine the quality of the prepared crystals. To the solution of SMS having specific gravity 1.05, 1 M tartaric acid is added. pH is adjusted to 4, 5, 6, 7 and 8. Solution was kept for 36 h to form a firm gel. 1 M calcium nitrate solution was supernated after the gel formation. Twenty days later, CaTT crystals were separated from the gel. The steps involved in the production of crystals are depicted in Figure . Small crystals were produced by nucleation at lower pH values. Crystals of increased dimensions were formed for pH 7 and 8.
Figure 1. Schematic diagram of CaTT crystal preparation.
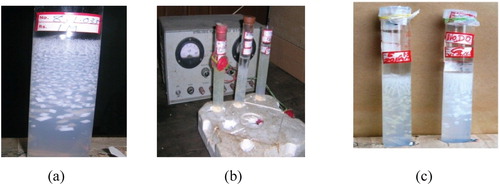
To study the effect of electric field and magnetic field on the properties of CaTT crystals, two different types of CaTT crystals were synthesized by applying an electric potential 10 V perpendicular in the direction of diffusion (CaTT-electric) (Figure (b)) and by providing a magnetic field of 0.1 Tesla across the test tube (CaTT-Magnetic) (Figure (c)).
Figure 2. Photographs of prepared CaTT crystals (a) pure CaTT (b) CaTT-electric (c) CaTT-magnetic.
Structural studies of the synthesized crystals were done using X-ray diffraction (XRD) analysis (XPERT-PRO using K-α 1.54060A0 (XRDML)). Linear absorption of the samples was recorded using Jasco V-570 UV/VIS/IR Spectrophotometer. A Q-switched Nd:YAG laser (Spectra physics Lab-1760, 532 nm, 7 ns, 10 Hz) was used as the source of excitation for open aperture z-scan studies. The CaTT crystals dispersed in water were taken in a 1 mm thick cell and moved along the z-axis through the focal point of a lens of focal length 20 cm [Citation26,Citation27]. Transmitted beam energy, reference beam energy and their ratios were simultaneously measured by using energy ratio metres Rjp 7620 (Laser Probe Corp) having two identical pyro electric detector heads (Rjp 735). CS2 was used as the standard for the initial calibration of z-scan setup. All measurements were done at room temperature.
3. Results and discussions
The crystalline nature of the synthesized materials was confirmed by the powder XRD analysis (Figure ). Sharp peaks in the pattern are due to large crystallite size, high relaxation time, high band gap and perfect crystalline property. A comparison with JCPDS values confirmed orthorhombic structure for the synthesized crystals (Figure ).
Figure 3. X-ray diffraction pattern of CaTT crystal.
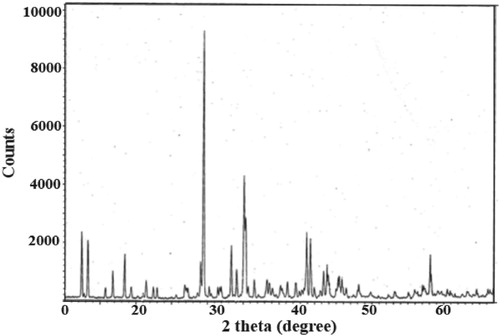
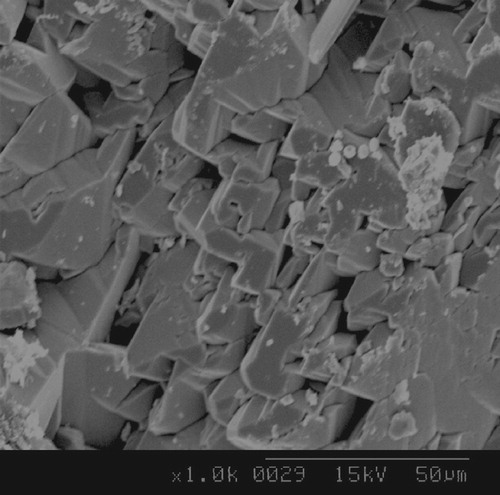
Figure 4 SEM image of pure CaT crystals.
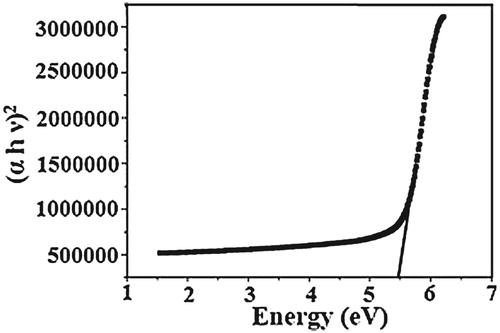
A representative linear absorption spectrum of pure CaTT crystal dispersed in distilled water is shown in Figure . The absorption peak of pure CaTT crystal at the concentration of 0.02 gm/ml is located in the UV region with peak at 244 nm. The band gap of the material was estimated from the graph of hν verses (αhν)2 (Figure ). Linear absorption coefficient α is related to the band gap Eg as (αhν)2 = k (hν − Eg), where hν is the incident light energy and k is a constant. An energy band gap of 5.48 eV for the present system points to its 83 nonlinear application potential.
Figure 5. Linear absorption spectrum of CaTT crystal.
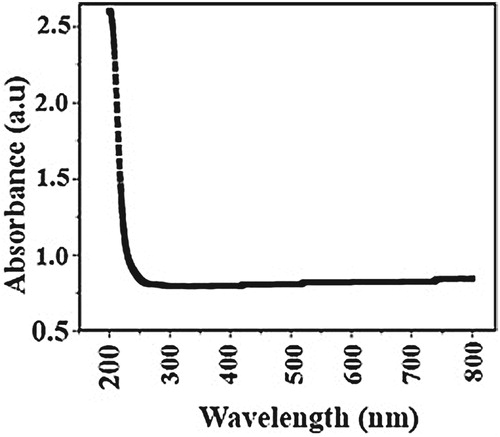
Figure 6. Optical band gap plot of CaTT crystal.
Optical nonlinearity of the crystals was measured using open aperture z-scan technique by focusing the input beam on to the sample at 532 nm using a Q-switched Nd: YAG laser. For estimating the limits of saturable absorption (SA) and reverse saturable absorption (RSA) behaviour, z-scan curves were recorded at different fluences in the nanosecond regime using a Gaussian laser beam at three different input fluences (87, 125 and 251 MW/cm2) (Figure ).
Figure 7. Open aperture z-scan plot of CaTT crystals (a) pure CaTT (b) CaTT-magnetic (c) CaTT-electric.
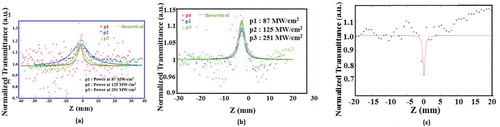
The solid curves are theoretical fit to the open aperture z-scan experimental data. The nonlinear absorption coefficient β can be obtained from this open aperture z-scan data by fitting the normalized transmittance data to the open aperture formula given by [Citation28]:
where
where Z0 = kw02/2 is the diffraction length of the beam.
k = 2π/λ is the wave vector, wo = the beam waist radius at the focal point, Leff = (1 − exp (−αL))/α is the effective thickness of the sample, I0 is the laser intensity at the focal plane.
From Figure (a,b), it is clear that the nonlinear absorption coefficient β is negative due to the transmission maximum at the focal point. These figures show the SA behaviour of CaTT samples. As CaTT is a saturable absorber, it exhibits reduced absorption at high input intensities and shows a transmission peak. The z-scan data shows that the increase in the laser intensity induces bleaching in the ground state absorption, which results in a transmittance increase giving a SA process. Thus CaTT crystals at input powers 87 and 251 MW/cm2 are well suited for passive Q-switching or mode locking of lasers. Figure (c) reveals RSA nature for CaTT-electric crystals. At a laser input power of 125 MW/cm2, it acts as an RS absorber. At this particular input fluence value, a valley is obtained in the transmittance curve for pure CaTT and CaTT-electric. Since the wavelength used in the experiment is 532 nm, RSA corresponds to two-photon absorption (TPA) [Citation29]. Values of nonlinear absorption coefficient β for three input fluence values are tabulated in Table . The saturation intensity Is values for the saturable absorbed CaT samples are also given in the table. The CaTT-magnetic crystals exhibited only SA due to the depletion of ground state ions [Citation30–32].
Table 1. Measured values of nonlinear absorption coefficient, saturation intensity and optical limiting threshold CaTT crystals.
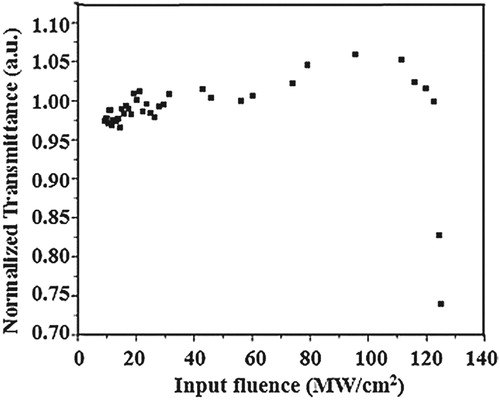
The RSA nature of CaTT makes it suitable for optical limiting applications. From the observed responses, it is clear CaTT is an effective optical limiter having low limiting threshold, large dynamic range and longer excited state life time to accumulate the population, high optical damage threshold, broadband response, fast response time and high linear transmittance. Figures and show the optical limiting response of CaTT and CaTT-electric crystals. The efficiency of an optical limiter is decided by its limiting threshold. It is obvious that lower the optical limiting threshold, better the optical limiting material. The optical limiting property occurs mainly due to absorptive nonlinearity which corresponds to the imaginary part of the third order susceptibility [Citation33]. The optical limiting response of CaTT crystal at I0 = 125 MW/cm2 is 103 MW/cm2 and that of CaTT-electric is 116 MW/cm2. From the data, it is clear that the pure CaTT crystal can be used as a better optical limiting material than CaTT-electric crystals.
Figure 8. Optical limiting response of CaTT crystal.
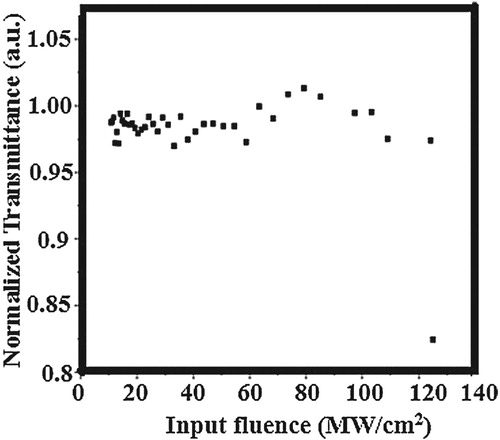
Figure 9. Optical limiting response of CaTT-electric crystals.
4. Conclusion
The synthesis and linear optical and nonlinear optical characterization of Calcium tartrate crystals are reported. A detailed optical analysis of the crystal systems has been carried out using UV–visible and open aperture z-scan technique. Optical band gap, nonlinear absorption coefficient, saturation intensity and optical limiting threshold of the material have been evaluated. The investigation reveals that the CaTT crystal has the optimum values of the nonlinear absorption coefficient and optical limiting threshold required for an optical limiter.
Disclosure statement
No potential conflict of interest was reported by the authors.
ORCID
I. Rejeena http://orcid.org/0000-0003-4114-9533
Vinoy Thomas http://orcid.org/0000-0002-7623-6349
S. Mathew http://orcid.org/0000-0002-4835-7231
Anit Elizabeth http://orcid.org/0000-0001-8649-3544
A. Mujeeb http://orcid.org/0000-0002-5694-0566
Additional information
Funding
References
- Craxton RS, Jacobs SD, Rizzo JE, et al. Basic properties of KDP related to the frequency conversion of 1 µm laser radiation. IEEE J Quantum Electron. 1981;17(9):1782. doi: 10.1109/JQE.1981.1071349
- Shajan XS, Mahadevan C. On the growth of calcium tartrate tetrahydrate single crystals. Bull Mater Sci. 2004;27:327. doi: 10.1007/BF02704767
- Labutina L, Marychev MO, Portnov VN, et al. Second-order nonlinear susceptibilities of the crystals of some metal tartrates. Crystallogr Rep. 2011;56 (1):72. doi: 10.1134/S1063774510061082
- Titaeva EK, Somov NV, Portnov VN, et al. Crystal structure of monobasic sodium tartrate monohydrate. Crystallogr Rep. 2015;60(1):72. doi: 10.1134/S1063774515010265
- Vivek P, Roop Kumar R, Murugakoothan P. Synthesis, growth, optimization, bulk SR method growth, fabrication of indigenous optical element and anisotropic studies on guanidinium L-monohydrogen tartrate (GuHT) single crystal for nonlinear optical device applications. J Cryst Growth. 2015;412:40. doi: 10.1016/j.jcrysgro.2014.11.042
- Shah A, Patel IB. FTIR and XRD study of barium tartrate (BaC4H4O6) crystals grown by gel method. AIP Conf Proc. 2010;1249:192. doi: 10.1063/1.3466554
- Medrano C, Gunter P, Arend H. Noncentrosymmetry Observed in CaC4H4O6· 4H2O Crystals by Nonlinear Optical Measurements. Phys Status Solidi B. 1987;14B:749.
- Ambady GK. The crystal and molecular structures of strontium tartrate trihydrate and calcium tartrate tetrahydrate. Acta Crystallogr. 1968;B24:1548. doi: 10.1107/S0567740868004619
- Brehat F, Wyneke B. Calculation of double-refraction walk-off angle along the phase-matching directions in non-linear biaxial crystals. J Phys B. 1989;22:1891. doi: 10.1088/0953-4075/22/11/020
- Hawthorne FC, Borys I, Ferguson RB. Structure of calcium tartrate tetrahydrate. Acta Cryst. 1982;38:2461. doi: 10.1107/S0567740882009042
- Johnson NW. Convex polyhedra with regular faces. Canadian J Math. 1966;18:169. doi: 10.4153/CJM-1966-021-8
- Nakatani N. Point group determination of calcium tartrate by etch figure. Jpn J Appl Phys. 1991;30:1961. doi: 10.1143/JJAP.30.L1961
- Rethinam FJ, Arivuoli D, Ramasamy P. Growth and characterization of pure and cadmium doped strontium tartrate tetrahydrate single crystals. Mater Res Bull. 1994;29:309. doi: 10.1016/0025-5408(94)90028-0
- Selvarajan P, Gon BN, Rao KV. Infrared spectroscopic and thermal studies of calcium tartrate single crystals grown by silica-gel technique. J Mater Sci Lett. 1993;12:1210.
- Bohandy J, Murphy JC. An X-ray study of gel-grown strontium tartrate tetrahydrate. Acta Crysta Uogr. 1968;24:286. doi: 10.1107/S0567740868002141
- Torres ME, Lopez T, Stockel J, et al. Structural characterization of doped calcium tartrate tetrahydrate. J Solid State Chem. 2002;163:491. doi: 10.1006/jssc.2001.9435
- Sahaya Shajan X, Mahadevan C. FT-IR spectroscopic and thermal studies on pure and impurity added calcium tartrate tetrahydrate crystals. Cryst Res Technol. 2005;40:598. doi: 10.1002/crat.200410389
- Saban KV, Jini T, Varghese G. Influence of magnetic field on the growth and properties of calcium tartrate crystals. J Magn Magn Mater. 2003;265:296. doi: 10.1016/S0304-8853(03)00278-6
- Tanimoto Y. Electric and magnetic field effects. In: Nagakura S, editor. Functionality of molecular systems. Tokyo: Springer; 1998. p. 301.
- Higashitani K, Okuhara K, Hatade S. Effects of magnetic fields on stability of nonmagnetic ultrafine colloidal particles. J. Colloid Interface Sci. 1992;152:125. doi: 10.1016/0021-9797(92)90013-C
- Higashitani K, Kage A, Katamura S, et al. Effects of a magnetic field on the formation of CaCO3 particles. J. Colloid Interface Sci. 1993;156:90. doi: 10.1006/jcis.1993.1085
- Fujiwara M, Tokunaga R, Tanimoto Y. Crystal growth of potassium nitrate in a magnetic field of 80 kOe. J Phys Chem B. 1998;102:5996. doi: 10.1021/jp981675f
- Fujiwara M, Chidiwa T, Tokunaga R, et al. Crystal growth of trans-Azobenzene in a magnetic field of 80 kOe. J Phys Chem B. 1998;102:3417. doi: 10.1021/jp980289v
- Suryanarayana K, Dharmaprakash SM. Linear and non-linear optical and electromagnetic properties of Ba2+ substituted calcium tartrate tetrahydrate crystals. Mater Chem Phys. 2003;77:179. doi: 10.1016/S0254-0584(01)00582-X
- Medrano C, Günter P, Arend H. Noncentrosymmetry observed in cac4h4o6 4h2o crystals by nonlinear optical measurements. Ferroelectrics. 1989;94(1):111. doi: 10.1080/00150198908014241
- Bahae MS, Said AA, Van Stryland EW. High-sensitivity, single-beam n_2 measurements. Opt Lett 1989;14:955. doi: 10.1364/OL.14.000955
- Irimpan L, Krishnan B, Deepthy A, et al. Size-dependent enhancement of nonlinear optical properties in nanocolloids of ZnO. J Appl Phys. 2008;103:033105. doi: 10.1063/1.2838178
- Irimpan L, Nampoori VPN, Radhakrishnan P. Spectral and nonlinear optical characteristics of nanocomposites of ZnO–CdS. J Appl Phys. 2008;103:094914. doi: 10.1063/1.2919109
- Rejeena I, Thomas V, Mathew S, et al. Spectral and lensing characteristics of gel-derived strontium tartrate single crystals using dual-beam thermal lens technique. J Fluoresc. 2016;26:1549. doi: 10.1007/s10895-016-1875-3
- Irimpan L, Nampoori VPN, Radhakrishnan P. Spectral and nonlinear optical characteristics of nanocomposites of ZnO–Ag. Chem Phys Lett. 2008;455:265–269. doi: 10.1016/j.cplett.2008.02.097
- Tintu R, Nampoori VPN, Radhakrishnan P, et al. Nonlinear optical studies on nanocolloidal Ga–Sb–Ge–Se chalcogenide glass. J Appl Phys. 2010;108:073525. doi: 10.1063/1.3481097
- Tintu R, Nampoori VPN, Radhakrishnan P, et al. Preparation and optical characterization of novel Ge–Se–Sb/PVA composite films for optical limiting application. J Phys D Appl Phys. 2011;44:025101. doi: 10.1088/0022-3727/44/2/025101
- Quereshi FM, Martin SJ, Long X, et al. Optical limiting properties of a zinc porphyrin polymer and its dimer and monomer model compounds. Chem Phys. 1998;231(1):87–94. doi: 10.1016/S0301-0104(98)00081-0