
ABSTRACT
A precise and accurate method for the analysis of antihypertensive drug combination nifedipine and valsartan was developed using the HPTLC method. The stationary phase used was a pre-coated silica gel G60 – F254 aluminium sheet and the mobile phase was acetonitrile: methanol: n-butanol: acetic acid (6:2:2:0.1, v/v/v/v). The detection of spots was carried out densitometrically using a UV detector at 230 nm in the absorbance mode. The Rf values of valsartan and nifedipine were found to be 0.25 and 0.65, respectively. The calibration curve was found to be linear in the range of 120–320 ng/band and 900–2400 ng/band for nifedipine and valsartan, respectively. Forced degradation studies were performed using stress conditions like acid and base hydrolysis, photolytic, thermal and oxidative stress degradation to develop the stability indicating method. The degradation study indicated that nifedipine was susceptible to acid-base hydrolysis, oxidative stress degradation and photolytic degradation, while valsartan was susceptible to acid-base hydrolysis and oxidative stress degradation.
1. Introduction
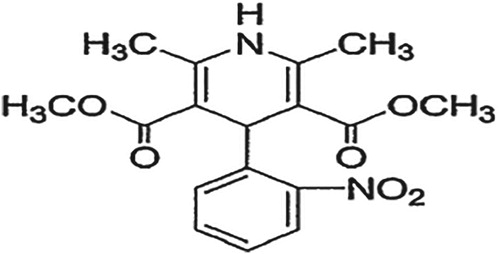
Nifedipine (NIF) is chemically dimethyl 1,4-dihydro-2,6-dimethyl-4-(nitrophenyl) pyridine-3,5-dicarboxylate. The empirical formula of NIF is C17H18N2O6 with a molecular weight of 346.34 g/mol [Citation1,Citation2] (Figure ). NIF acts by systemic vasodilation via the inhibition of inward flow of calcium ions through L-type calcium channels in cell membranes [Citation3–5].
Figure 1. Chemical structure of nifedipine.
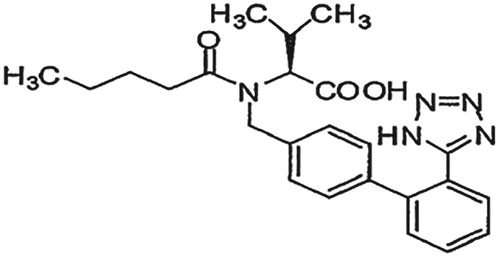
Valsartan (VAL) is chemically N-pentanonyl-N-[2′-(1H-tetrazol-5-yl)biphenyl-4-ylmethyl]-L-valine. It has an empirical formula C24H29N5O3 and a molecular weight of 435.5 g/mol (Figure ). Valsartan is an angiotensin receptor blocker that selectively inhibits the binding of angiotensin II to AT1, which is found in many tissues such as vascular smooth muscle and the adrenal glands. This effectively inhibits the AT1-mediated vasoconstrictive and aldosterone-secreting effects of angiotensin II and results in a decrease in the vascular resistance and blood pressure. Valsartan is selective for AT1 and has virtually no affinity for AT2 [Citation3,Citation4,Citation6].
Figure 2. Chemical structure of valsartan.
The clinical study showed that the combination therapy of NIF and VAL is superior than the monotherapy for the treatment of essential hypertension and provides a better mean reduction in blood pressure [Citation7].
A literature survey regarding the quantitative analysis of NIF revealed that attempts have been made to develop analytical methods for the estimation of NIF alone and in combination with other drugs by chromatographic methods like HPLC and HPTLC [Citation8–15]. VAL is official in Indian Pharmacopoeia [Citation16]. The literature survey revealed that HPLC and HPTLC methods have been reported for the estimation of VAL [Citation17–30].
There are HPLC [Citation31,Citation32] and HPTLC [Citation33] methods reported for the estimation of NIF and VAL in the combined dosage form. To our knowledge, no stability indicating methods have been reported for the estimation of a combination of NIF and VAL. The present study involves the development of stability indicating the HPTLC method for the simultaneous estimation of NIF and VAL in combination. Development of HPTLC method is simple, less time consuming and provides accurate and precise result compared to the liquid chromatographic method. The stability indicating method is necessary for the analysis of quality control and stability samples, so the stability indicating HPTLC method has been attempted and developed.
2. Experimental
2.1. Apparatus and instruments
HPTLC densitometric scanning was performed in the absorbance mode under control by the winCATS planar chromatography software (CAMAG, Muttenz, Switzerland). The source of radiation was the deuterium lamp. The sample was applied under a continuous drying stream of nitrogen gas with the help of a microlitre syringe, using a Linomat V sample applicator. The mobile phase was prepared by mixing in a Camag Twin-trough glass chamber. Identification and determination of the drug were performed on pre-coated silica gel G60 – F254 aluminium sheet (E. Merck, Germany) (100 × 100 mm, thickness layer 0.2 mm) TLC plates.
All the drugs and chemicals were weighed on an electronic analytical balance (Model AUX220, Shimadzu Ltd., Japan).
2.2. Reagents and materials
2.2.1 Pure drugs
Nifedipine (99.75%w/w) and valsartan (99.82%w/w) were procured from Relax Biotech Pvt Ltd, Vadodara, Gujarat, India.
2.2.2 Chemicals and reagents
Methanol (HPLC grade), iso propyl alcohol (HPLC grade), N-butanol (AR), hexane (AR grade), acetonitrile (HPLC grade), ethyl acetate (AR grade), formic acid (AR grade), acetic acid (AR grade), ammonia (AR grade) were procured from SD fine Chem. Ltd, Baroda, India and were used as a solvent in the developed method.
2.3. Development of the HPTLC method
2.3.1. Preparation of standard stock solutions
A 10 mg of NIF and VAL was accurately weighed and transferred to two separate 10 ml volumetric flasks and dissolved in a few millilitres of methanol. The volumes were made up to the mark with methanol to yield a solution containing 1000 µg/ml of NIF and VAL, respectively. Aliquots from the stock solutions of NIF and VAL were appropriately diluted with methanol in the same volumetric flask to obtain working standards of 20 µg/ml of NIF and 150 µg/ml of VAL.
2.3.2. Sample application
Standards and samples of NIF and VAL were applied on the HPTLC plates in the form of narrow bands of 6 mm length. The bands were applied 10 mm above from the bottom and 10 mm away from the left edge of the plate. Samples were applied under a continuous drying stream of nitrogen gas.
2.3.3. Mobile phase and development
Plates were developed using a mobile phase consisting of acetonitrile: methanol: n-butanol: acetic acid (6:2:2:0.1, v/v/v/v). Linear ascending development was carried out in a twin-trough glass chamber equilibrated with the mobile phase vapours for 30 min. Ten millilitres of the mobile phase (5 ml in the trough containing the plate and 5 ml in the other trough) were used for each development and were allowed to migrate at a distance of 80 mm. After development, the HPTLC plates were dried completely.
2.3.4. Densitometric analysis
Densitometric scanning was performed in the absorbance mode under control by the winCATS planar chromatography software (CAMAG, Muttenz, Switzerland). The source of radiation was the deuterium lamp, and bands were scanned at 230 nm. The slit dimensions were 5 mm in length and 0.45 mm in width, with a scanning rate of 20 mm/s. Concentrations of the compound were determined from the intensity of diffusely reflected light and evaluated as peak areas against concentrations using a linear regression equation.
2.3.5. Calibration curves for NIF and VAL
The working standard solution (20 μg/ml of NIF and 150 μg/ml of VAL) was applied on a TLC plate with the help of a microlitre syringe, using a Linomat V sample applicator. A 6, 8, 10, 12, 14, 16 μl were applied on the TLC plate which gave 120–320 ng/band for NIF and 900–2400 ng/band for VAL. The plate was developed and scanned in the above established chromatographic conditions. Peak area was recorded for each concentration of the drug; the observations are reported and a calibration curve was plotted as concentration vs peak area.
2.3.6. Method validation
Validation of the developed HPTLC method was carried out according to the International Council on Harmonization (ICH) guidelines Q2 (R1) for linearity and range, accuracy, precision, LOD and LOQ, specificity and robustness by the following procedure.
2.3.6.1. Linearity and range
Linearity of the method was evaluated by constructing calibration curves at five concentration levels over a range of 120–320 ng/band and 900–2400 ng/band for NIF and VAL, respectively. The calibration curves were developed by plotting peak area versus concentration (n = 5).
2.3.6.2. Accuracy
The accuracy of the method was determined by calculating recoveries of NIF and VAL by the method of standard additions in a synthetic mixture. The pre-analysed sample (120 ng/band for NIF and 900 ng/band for VAL) were spiked with standard drugs. The standard drugs were spiked at 50%, 100% and 150% of the target concentration (60, 120, 180 ng/band for NIF and 450, 900, 1350 ng/band for VAL). The solutions were applied on the TLC plate and development was carried out. The amounts of NIF and VAL were estimated by measuring the areas and by fitting these values to the straightline equations of the calibration curves.
2.3.6.3. Precision
Precision was evaluated in terms of intra-day and inter-day precisions. Intra-day precision was determined by analysing sample solutions of NIF (120, 240, 320 ng/band) and VAL (900, 1800, 2400 ng/band) at three levels covering low, medium, and high concentrations of the calibration curve three times on the same day (n = 3). Inter-day precision was determined by analysing sample solutions of NIF (120, 240, 320 ng/band) and VAL (900, 1800, 2400 ng/band) at three levels covering low, medium, and high concentrations over a period of 3 days (n = 3). The peak areas obtained were used to calculate the mean and relative standard deviation (% RSD) values.
To check the scanner repeatability same spot was scanned for six times and area was determined and the % RSD was calculated. Repeatability of measurement of peak area was determined by applying NIF (200 ng/spot) and VAL (1500 ng/spot) six times on the same plate to check the repeatability of injection.
2.3.6.4. Robustness
Small changes in the chamber saturation time, chamber size and composition of the mobile phase were introduced, and the effects on the results were examined. Robustness of the method was determined in triplicate at concentration levels of 200 and 1500 ng/band of NIF and VAL, respectively. The mean and % RSD values of the Rf were calculated.
2.3.6.5. Specificity
Specificity is the ability to assess unequivocally the analyte in the presence of components, which may be expected to be present. Typically, these might include impurities, degradants, matrix, etc. The specificity of the method was ascertained by analysing NIF and VAL in the presence of excipients like Avicel pH 102 (49.6%), sodium starch glycolate (4%), talc (1.6%) and magnesium stearate (0.8%). Interference due to excipients was noted and drugs nifedipine (12%), valsartan (32%).
2.3.7. Forced degradation study
Forced degradation of the drug substance can help identify the likely degradation products, which can in turn help to establish the degradation pathways and the intrinsic stability of the molecule and validate the stability indicating the power of the analytical procedures used. The nature of stress testing will depend on the individual drug substance and the type of drug product involved.
NIF and VAL were subjected to various stress conditions to conduct forced degradation studies. Stress studies were carried out under the conditions of acid and base hydrolysis, oxidation, thermal, UV light as mentioned in ICH Q1A (R2).
2.3.7.1. Alkali hydrolysis
To perform the alkali degradation study, appropriate aliquots of stock solutions (1000 µg/ml) of NIF and VAL were taken in two different 10 ml volumetric flasks and 2.5 ml of 0.1 N NaOH was added. Similarly, appropriate aliquots of stock solutions of NIF and VAL were taken in the same 10 ml volumetric flaks and 2.5 ml of 0.1 N NaOH was added. All the mixtures were heated in a water bath at 70–80°C for 1 h. and allowed to cool to room temperature. The solution was neutralized with 0.1 N HCl, and it was diluted up to the mark with methanol.
2.3.7.2. Acid hydrolysis
To perform the acid degradation study, appropriate aliquots of stock solutions (1000 µg/ml) of NIF and VAL were taken in two different 10 ml volumetric flasks and 2.5 ml of 1 N HCl was added. Similarly, appropriate aliquots of stock solutions of NIF and VAL were taken in the same 10 ml volumetric flaks and 2.5 ml of 1 N HCl was added. All the mixtures were heated in a water bath at 70–80°C for 1 h. and allowed to cool to room temperature. The solution was neutralized with 1 N NaOH and it was diluted up to the mark with methanol.
2.3.7.3. Oxidative stress degradation
To perform oxidative stress degradation, appropriate aliquots of stock solutions (1000 µg/ml) of NIF and VAL were taken in two different 10 ml volumetric flasks and 2.5 ml of 3% hydrogen peroxide was added. Similarly, appropriate aliquots of stock solutions of NIF and VAL were taken in the same 10 ml volumetric flasks and 2.5 ml 3% hydrogen peroxide was added. All the mixtures were heated in a water bath at 70–80°C for 1 h and allowed to cool to room temperature and diluted up to the mark with methanol.
2.3.7.4. Dry heat degradation
Analytically pure samples of NIF and VAL were exposed in an oven at 70–80°C for 2 h. The solids were allowed to cool and 10 mg each of NIF and VAL were weighed, transferred to two separate volumetric flasks (10 ml) and dissolved in few ml of methanol. Volumes were made up to the mark with the methanol. Aliquots from the stock solutions of NIF and VAL were appropriately diluted with methanol to obtain working standards of 20 µg/ml for NIF and 150 µg/ml of VAL.
2.3.7.5. Photo degradation
Analytically pure samples of NIF and VAL were exposed to UV light for 24 h. A 10 mg each of NIF and VAL were weighed, transferred to two separate volumetric flasks (10 ml) and dissolved in few ml of methanol. Volumes were made up to the mark with the methanol. Aliquots from the stock solutions of NIF and VAL were appropriately diluted with methanol to obtain working standards of 20 µg/ml for NIF and 150 µg/ml of VAL.
All the reaction solutions were suitably applied on the TLC plates and densitograms were recorded using the proposed method.
2.3.8. Analysis of synthetic mixture
Synthetic mixture was weighed and finally powdered. Powder equivalent to 10 mg NIF (26.66 mg of VAL) was taken in 10 ml volumetric flask. Methanol was added to the above flask, and the flask was sonicated for 15 min. The solution was filtered using Whatman filter paper No. 41, and the volume was made up to the mark with methanol. Appropriate volume of the aliquot was transferred to a 10-ml volumetric flask, and the volume was made up to the mark with the methanol to obtain 20 µg/ml of NIF (and 53.32 µg/ml of VAL). A 12 µl solution was applied for the estimation of NIF which gave a concentration of 240 ng/band. A 30 µl solution was applied for the estimation of VAL which gave a concentration of 1600 ng/band. The areas were determined and quantification was carried out by keeping this value in the regression equation.
3. Results and discussion
3.1. Optimization of the mobile phase
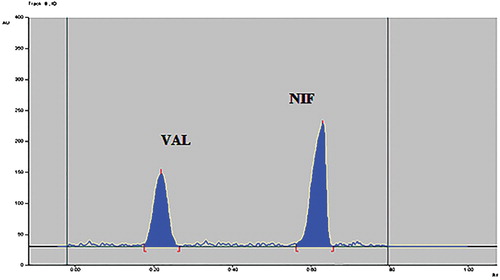
To develop the HPTLC method for the estimation of NIF and VAL in the combined dosage form, the selection of the mobile phase was carried out on the basis of polarity. A mobile phase that would give a dense and compact band with an appropriate Rf value for NIF and VAL was desired. The mobile phase acetonitrile: methanol: n-butanol: acetic acid (6:2:2:0.1, v/v/v/v) was found to be satisfactory and gave good separation for NIF and VAL. It was also observed that chamber saturation time and solvent migration distance were crucial in the chromatographic separation. A chamber saturation time of less than 30 min and solvent migration distances of less than 80 mm resulted in the diffusion of the analyte band. The developed plate was subjected to densitometric measurements in a scanning mode in the UV region of 400–200 nm, and the overlaid spectrum was recorded using CAMAG TLC Scanner 4. The overlaid spectra showed that all drugs absorb appreciably at 230 nm. So, it was selected as the detection wavelength (Figure ). These chromatographic conditions produced a well-defined, compact band of NIF and VAL with Rf0.65 and 0.25, respectively (Figure ).
Figure 3. Overlay of absorbance spectra of NIF and VAL.
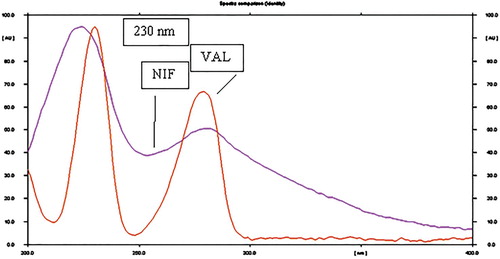
Figure 4. Densitogram of NIF and VAL.
3.2. Validation of the developed HPTLC method
The linearity was determined at six levels over the range of 120–320 ng/band of NIF with a correlation coefficient of 0.997. Similarly, responses for VAL were linear in the concentration range of 900–2400 ng/band with a correlation coefficient of 0.995. The regression analysis of the calibration curves is shown in (Table ). The accuracy was determined by recovery studies. The recoveries of NIF and VAL were found to be in the range of 98.3–100.14% and 98.47–100.12%, respectively, which are satisfactory.
Table 1. Regression analysis of the calibration curve.
Repeatability of the scanning device and injection was studied by applying and analysing NIF and VAL samples (200 and 1500 ng/band) six times. The % RSD values obtained were less than 1%. The results indicated that the method is repeatable. Variation of results within the same day (intra-day), variation of results between days (inter-day) were analysed. The low RSD value indicates that the method is precise. Under the experimental conditions used, the lowest amounts of drug that could be detected (LOD) for NIF and VAL were found to be 35.01 and 287.62 ng/band, respectively. The limits of quantification (LOQ) for NIF and VAL were found to be 106.1 and 871.60 ng/band, respectively. This indicates that the ng quantity of all drugs can be estimated accurately and precisely which means that the method is sensitive. Excipients used in the specificity studies did not interfere with the response of either of the drugs at their respective analytical wavelengths. The % RSD values less than 4% were obtained after introducing small, deliberate changes in parameters of the developed HPTLC method, confirming its robustness and the percentage recovery for VAL and NIF were found to be more than 98% for both the drugs. The validation parameters are summarized in Table .
Table 2. Summary of validation parameter.
3.3. Forced degradation study
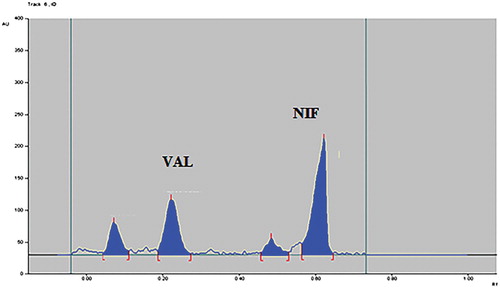
Densitogram of base hydrolysis (0.1 M NaOH) performed at 70–80°C for 1 h showed the degradation of NIF with degradation product peak at Rf value 0.44 and degradation of VAL with degradation product peak at Rf value 0.12 (Figure ). The degradation peaks of both the drugs were well resolved from the pure drug peaks. The acid hydrolysis was performed using 1 N HCl. The acid degraded samples showed degradation products peaks at Rf 0.45 and 0.54 for NIF. VAL underwent acid hydrolysis and gave degradation product at Rf 0.18 (Figure ). VAL was found to be stable to dry heat study (Figure ), and samples showed degradation products peaks at Rf 0.51 for NIF. Photo degradation study indicated that NIF was susceptible to light and gave degradation product peak at a Rf value 0.53, while VAL was found to be stable to the proposed conditions (Figure ). Oxidative stress degradation study performed using hydrogen peroxide showed that VAL was susceptible to degradation with a Rf value of the degraded product at 0.13 and NIF gave the degradation product at a Rf value 0.49 (Figure ).
Figure 5. Densitogram of base (0.1 N NaOH) hydrolysed sample of VAL and NIF.

Figure 6. Densitogram of acid (1 N HCl) hydrolysed sample of VAL and NIF.
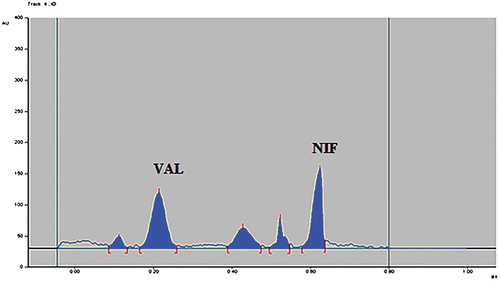
Figure 7. Densitogram of dry heat degraded sample of VAL and NIF.
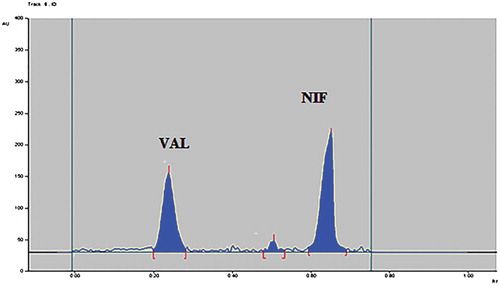
Figure 8. Densitogram of photolytic degraded sample of VAL and NIF.
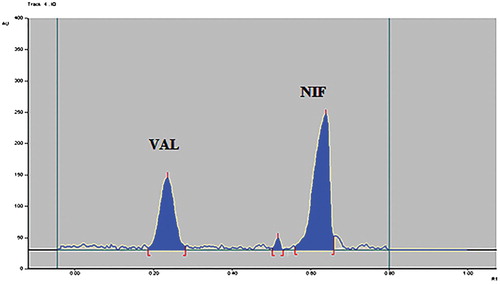
Figure 9. Densitogram of oxidative stress degraded sample of VAL and NIF.
The degradation study thereby indicated that NIF was susceptible to acid-base hydrolysis, oxidative stress degradation and photolytic degradation, while VAL was susceptible to acid-base hydrolysis and oxidative stress degradation. VAL was stable to dry heat and photolytic degradation conditions (Table ). No degradation products from different stress conditions affected the determination of NIF and VAL.
Table 3. Forced degradation study.
3.4. Analysis of synthetic mixture
The proposed method was applied to the determination of NIF and VAL in their synthetic mixture. The results obtained were compared with the corresponding labelled amounts (Table ).
Table 4. Analysis of synthetic mixture.
4. Conclusion
HPTLC method was developed for the estimation of NIF and VAL in combination. The method was found to be linear in the range of 120–320 ng/band and 900–2400 ng/band for NIF and VAL, respectively. The recovery was in the range of 98.3–100.14% for NIF and 98.47–100.12% for VAL. Forced degradation study was carried out using acid and base hydrolysis, photolytic, thermal and oxidative stress degradation conditions. The degradation peaks were well resolved from the drug peak so the method can be used for the analysis of stability samples. Compared to the reported HPLC method, the developed HPTLC method is less time consuming and consumes less quantity of mobile phase. The developed HPTLC method provides comparable accuracy and precision to that of the reported HPLC method.
Acknowledgements
Thankful for Relax Biotech Pvt. Ltd., Vadodara., India for providing gift sample of NIF and VAL, respectively.
Disclosure statement
No potential conflict of interest was reported by the authors.
ORCID
Dimal A. Shah http://orcid.org/0000-0002-6358-3739
Jaimin S. Patel http://orcid.org/0000-0001-6147-9711
Priyanka Jadeja http://orcid.org/0000-0003-1893-7865
Vandana B. Patel http://orcid.org/0000-0003-1799-4382
Usmangani K. Chhalotiya http://orcid.org/0000-0003-1183-2761
References
- Sweetman Sean C. Martindale: The complete drug reference. 35th ed. London: Published by the Pharmaceutical press; 2007; p. 1213, 1217, 1277.
- O'Neil Maryadele J. The Merck Index. An Encyclopedia of chemicals drugs. 15th ed. Published by The Royal Society of Chemistry, Cambridge, UK; 2013; p. 6613, 10102.
- Rang HP, Dale MM, Riter MJ, et al. In pharmacology. 6th ed. London: Elsevier Health Sciences; 2007; p. 501–502.
- Tripathi KD. Essentials of medical pharmacology. 6th ed. New Delhi: Jaypee Brothers Medical Publishers Pvt. Ltd; 2008; p. 549–550, 482, 486, 549, 540, 543,323, 529.
- Yuan-Nan Ke K, Dong YG, Shu-Ping M, et al. Improved blood pressure control with Nifedipine Gits/Valsartan combination versus high-dose Valsartan monotherapy in mild-to-moderate hypertensive patients from Asia. J Cardiovasc Pharmacol Ther. 2012;30:326–332.
- Ikuo S, Takao S. Controlled release Nifedipine and Valsartan combination therapy in patients with essential hypertension: the Adalat cr and Valsartan cost-effectiveness combination (advance-combi) study. J Hypertens Res. 2006;29:789–796.
- Bayer Healthcare AG. Study number: 14696, NCT01071122. 2013; p. 1–6.
- US Pharmacopeia 39 NF 34. The United State Pharmacopoeia Convention, Rockvill, vol. II. 2016; p. 5064, 5065, 5066, 6324, 6325, 6324, 6325.
- British Pharmacopoeia. British Pharmacopoeia Commission, vol. I. 2016; p. 187, 188, 1594, 1595, 1594, 1595.
- Abou-Auda H, Najjar T, Khamis K, et al. Liquid chromatographic assay of Nifedipine in human plasma and its application to pharmacokinetic studies. J Pharm Biomed Anal. 2000;22:241–249.
- Kamble N, Asirvatham S. Analytical method development and validation of Nifedipine and Atenolol in a capsule formulation by RP-HPLC. Int J Pharm Res Biosci. 2014;3(6):347–361.
- Modi T, Patel B, Patel J. Development and validation of stability indicating RP-HPLC method for simultaneous estimation of lignocaine HCl and nifedipine in cream. J Pharm Anal. 2016;5(1):1–37.
- Vidyadhara S, Sasidhar RLC, Praveen Kumar B, et al. Method development and validation for simultaneous estimation of Atenolol and Nifedipine in pharmaceutical dosage forms by RP-HPLC. Oriental J Chem. 2012;28(4):1691–1696.
- Asthana S, Kaur V, Chawla P, et al. Rapid and sensitive HPLC-UV method for simultaneous estimation of Nifedipine, Nateglinide and Lovastatin: quantitative application to polypill based synthetic ternary mixture. Int J PharmTech Res. 2010;2(1):682–688.
- Ramtek M, Kasture A, Dighade N. Development of high performance thin layer chromatographic method for simultaneous estimation of Atenolol and Nefidipine in combined dosage form. Asian J Chem. 2010;2(8):5951–5955.
- Indian Pharmacopoeia. Ministry of Health and Family Welfare, Indian Pharmacopoeia Commision, Ghaziabad, Vol. III. 2014; p. 2336, 2951, 2338, 2339, 2340, 2952, 2953, 2952, 2953.
- Sahu M, Prasad KD. Development and validation of analytical method for the estimation of Valsartan in pure and tablet dosage form by RP-HPLC method. Int J Res Pharm Chem. 2011;1(4):945–949.
- Ghanty S, Das R, Maiti S, et al. RP-HPLC Method for estimation of valsartan in solid oral dosage forms. J PharmSci Tech. 2014;3(2):88–91.
- Alexandar S, Kumudhavalli MV, Umamaheswari D, et al. A simple HPLC method for the estimation of Valsartan from rat plasma application to pharmacokinetic study. Int J Pharm Technol. 2016;8(3):15687–15697.
- Haque MA, Amrohi SH, Mohanty D, et al. Stability indicating RP-HPLC method for the estimation of Valsartan in pharmaceutical dosage form. Int Org Sci Res J Pharm. 2012;2(4):12–18.
- Bhavani K G, Srinivasu N, Nanduri G, et al. Development and validation of RP-LC method for simultaneous estimation of Amlodipine Besylate and Valsartan in bulk and its pharmaceutical formulations. J De Afrikana. 2016;3(4):262–273.
- Reddy DM, Rao PP, Ramachandran D. Stability indicating HPLC method for simultaneous estimation of Hydrochlorothioazide, Amlodipine and Valsartan in pharmaceutical dosage form. World J Pharm Sci. 2014; 2(12):1830–1836.
- Sridevi R, Mandal B, Navalgund SG. Stability-indicating HPLC method for the simultaneous determination of Valsartan and Ezetimibe in pharmaceuticals. Trop J Pharm Res. 2014;13(5):809–817.
- Vaka S, Patel P. New method development and validation for the simultaneous estimation of Sacubitril and Valsartan in a bulk and pharmaceutical dosage forms. Int J Res. 2017;4:17–24.
- Rizwan SH, Sastry GV. Development and validation of stability indicating RP-HPLC method for the simultaneous estimation of Aliskiren Hemifumarate and Valsartan in bulk and pharmaceutical dosage form. Asian J Pharm Clin Res. 2015;8:223–227.
- Kachave RN, Kale M, Wagh RD. Simultaneous estimation of Cilnidipine and Valsartan by RP-HPLC in tablet formulation. Eur J Anal Chem. 2016;11(5):245–253.
- Bhaisare M, Sahu K, Karthikeyan C, et al. RP-HPLC method for simultaneous estimation of Amlodipine and Valsartan in tablet formulation and validation as per ICH guidelines. Latin Am J Pharm. 2011;30(2):342–346.
- Godiyal S, Nihalani G, Qureshi R, et al. Development and validation of HPTLC method for estimation of Valsartan in bulk and marketed formulation. Indo-American J Pharm Res. 2016;6(8):6478–6484.
- Jadhav ML, Girase MV, Tidme SK. Development and validation of HPTLC method for simultaneous estimation of Valsartan and Hydrochlorothiazide in tablet dosage form. J Pharm BioSci. 2015;2:20–25.
- Lokhande SP, Gupta SP, Garg G, et al. Development and validation of a HPTLC method for the simultaneous estimation of Ramipril and Valsartan. Int J Pharm Teach Pract. 2012;3(1):225–227.
- Shah PM, Shah JS, Maheshwari DG. Development and validation RP-HPLC method for simultaneous estimation of Valsartan and Nifedipine in synthetic mixture. Int J Pharm Technol. 2016;7(2):9161–9169.
- Sood J, Sapra B, Tiwary A. Microemulsion transdermal formulation for simultaneous delivery of Valsartan and Nifedipine formulation by design. Am Assoc Pharm Sci. 2016;18 (6):1–16.
- Patel CB, Patel SA. Development and validation of Q-absorbance ratio method for simultaneous estimation of Valsartan and Nifedipine in synthetic mixture. Int Res J Pharm. 2016;7(1):1–8.