
Abstract
In this article, Western Saudi Arabia underwent remote sensing investigation via Operational Land Imager (OLI), Advanced Land Observing Satellite/ Phased Array type L-band Synthetic Aperture Radar (ALOS/PALSAR), Sentinal-1 and Shuttle Radar Topography Mission (SRTM). Image-transformation and enhancement techniques such as Band ratios, principal component analysis (PCA), and Minimum Noise Fraction (MNF) were utilized. Applying Sentinel-1 and SRTM DEMs enhanced the perspective views of the terrain. The main results are highlighting of geologic rock units, geomorphic and structural features, and extraction and visualization of dominant lineaments. N–S foliations that are associated with folds N–S tight, isoclinal, and asymmetric (F1), NW-SE trending Najd system strike-slip faults and NNE–SSW, NE–SW NW–SE, and E–W Cenozoic faults are the major identified structural lineaments, which were analyzed and synthesized via rose diagrams. Visible Near Infra-Red/Short Wave Infra-Red (VNIR/SWIR) radar data are very important data set for water resources applications.
1. Introduction
Remote sensing plays a significant role in revealing the geomorphic, geologic, hydrologic, and structural use of land and mineral resources. Advanced analysis and interpretation of remote sensing data provides a unique opportunity to get remote access to the earth surface geology [Citation1–4], marine surface [Citation5,Citation6], aeolian landforms [Citation7,Citation8] and atmospheric conditions [Citation9–12]. The advent of remote sensing technology has heralded a new era in the field of applied geology, with the knowledge of new approaches towards characterizing the types of rocks and the tectonic features affecting the rocks [Citation4,Citation13,Citation14].
These features can be revealed from reflected and backscattered images of the Visible Near Infra-Red IR (VNIR) and the Short Wave Infra-Red (SWIR) radar systems present in the geo-spatial databases. A wide range of geologic and geographic information can be inferred from remotely sensed imagery, including lithology, structural features, soils landforms, and drainage geometry. Multispectral and hyper-spectral data, which present information within the VNIR and SWIR regions, allows the discrimination of rocks, mineral resources [Citation15–17], and the delineation of geological and structural features [Citation18,Citation3]. Each band records the interaction of specific electromagnetic radiation with targets and provides information that reflects the chemical and physical characteristics. A particular advantage of using optical remote sensing data is that it displays the contrast between different rock units and the characterizing fault traces and folds.
As compared to the optical VNIR/SWIR data, the Synthetic Aperture Radar (SAR) images penetrate the atmosphere, the hydrosphere, and the quaternary deposits, revealing near-surface features [Citation1,Citation2]. Roth and Elachi [Citation19] showed radar waves’ capabilities of producing subsurface images in arid regions for a depth of several metres, using the L-band [Citation20]. The L-band of PALSAR data presents a deeper penetration than the C-band and clearly characterizes the masked structural geometry [Citation1,Citation20]. Radar data is also significant in revealing morphological features and morphologically defined structures [Citation1–3,Citation21].
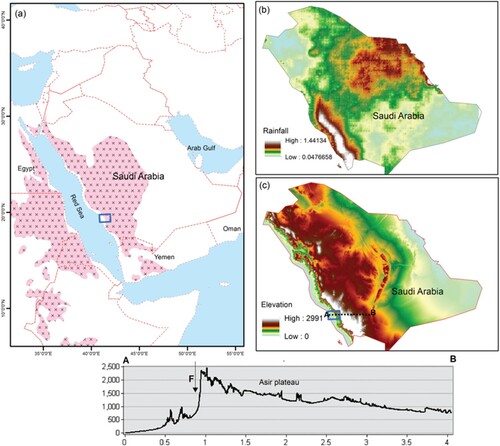
The Arabian Peninsula represents an arid to hyper-arid region, much like the North African Sahara [Citation2,Citation22–25]. The prevalent climate of this region makes it ideal for remote sensing investigations. The study area is located in the most elevated area within the western part of the Arabian Shield, which represents a counterpart to Nubian Shield before the opening of the Red Sea. It forms a plateau, known as the Asir plateau, that contains escarpment-crest elevations reaching up to about 3000 m and changes abruptly into a narrow and deeply incised terrain including the Red Sea coastal plain, to the west of the plateau escarpment. This new development of steep depression and coastal-plain-like geomorphology, due to the rifting event in the Red Sea, has led to the cropping-out of a highly deformed and complex geology of the compressional regime that is affected by subsequent extensional events. Therefore, the study area has significant features which make it a very interesting area for geological investigations in the Arabian Shield [Citation26]. For example, the geologic rock units vary between the Precambrian and the recent age [Citation26], the structural features, such as folds and faults, are present, and the topographic features are found to be changing from a lowly elevated coastal area to an escarpment. Moreover, Cenozoic time has created the recent development of geology and topography by which the faults form their own hydrologic system in the western part of the Kingdom of Saudi Arabia (KSA), reflecting higher measurable precipitation than other parts of KSA (see Figure (b)).
Figure 1. (a) Regional view of KSA, related to other countries and the Arabian-Nubian Shield (ANS) in pink colour; (b) Locational map of KSA, represented by TRMM rainfall precipitation data; (c) SRTM DEM of KSA.
The main objective of the current study is to integrate wide array of remote sensing data of different resolution such as ALOS/PALSAR, Sentinel-1 SRTM, Google Earth, and Landsat 8- OLI data through GIS, to understand the geologic and structural features of a particular area in southwestern Saudi Arabia. In addition, it aims to understand the hydrologic characteristics on the basis of the geologic and topographic conditions in area of difficult accessibility as a result of rough terrain. This is because most of the work done in such areas without using recent advanced satellite remote sensing data.
2. Study area
The Al Qunfudhah area in western KSA is about 300 km from Jiddah, and extends along the Red Sea between longitude 40o 48 49.015 E and 41o 56 41.89 E and latitude 19o49 32.44 N and 19o 01 41E (Figure ), covering approximately 11,000 sq km. The majority of the study area (Figure ) is occupied by Neoproterozoic basement rocks of various ages, covered by minor amounts of Paleogene clastic sedimentary rocks, summarized in Table . Based on the geological map of Al Qunfudhah in the KSA [Citation26], the oldest rocks are represented by Baish Group of serpentinites, talc schist, low-grade metamorphosed volcanic rocks, and volcaniclastic rocks of Precambrian age [Citation27]. This group is overlain by Bahah Group, which comprises different varieties of amphibolites, schist, graywack, argillite, and slate. The Jiddah group of volcanics, volcaniclastics, schist, and amphibolite schist overlies the Bahah Group. In addition to these groups of several rock units, the study area contains intrusive gabbros, metagabbro-diorites, tonalities, granitoids, hornblendites, and syenites, that are cut by several dykes of rhyolites, microgranites, gabbros, and olivine basalts. Neogene Sand gravels, silt deposits due to flood, and aeolian actions cover the western part of the study area, which forms the Red Sea’s coastal plain. The NNE and NW are the main trends controlling the structural features of the study area. Folding systems dominate the present study, represented by anticlines and synclines. The axes of these folds trend almost in NE direction. Moreover, this area is dissected by several joints and dykes of felsic and mafic composition.
Figure 2. Geologic map of the study area, that is overlain by the structural elements.
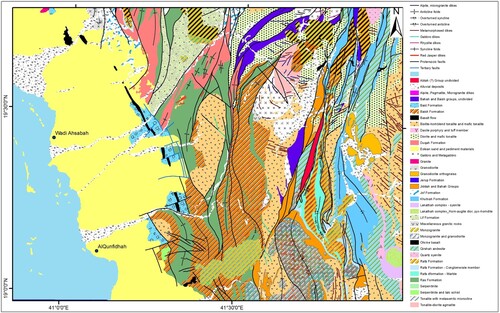
Table 1. Geologic units, appeared in the study area, from older Neoproterozoic rocks to Paleogene and Neogene rocks.
The study area is situated in the southwestern part the Arabian Shied, which resembles 1/3rd of the Arabian plate and was separated from the Nubian Shield in the African plate after the rifting in the Red Sea. The Arabian-Nubian Shield consists mostly of juvenile crusts, interpreted as an area containing a transpressive suture between East and West Gondwana [Citation28]. This occurred between about 900 and 550 Ma, during the Mozambique Ocean’s closure [Citation29]. It was produced through the accretion of, mainly, interoceanic island arcs along sutures characterized by ophiolites [Citation30–33].
From the hydrologic point of view, the area is located in an arid region that receives low rate of rainfall. During summer, the present study comes to dry and hot condition but the winter is cold with some rainfall storms as the clouds drift towards the Asir Mountains due to the prevailing westerly winds [Citation34]. The most abundant rainfall occurs in Saudi Arabia is in the Asir Mountains. The precipitation for the study area was obtained as a range from 5 to 425 mm/year in 30 years’ average (1975-2004) for the basin [Citation35]. Based on the present hydrologic conditions that given by Tropical Rainfall Measuring Mission (TRMM) data, the mean daily rainfall rate in a period of 1998–2012 ranges from 0.04–1.4 mm/day (Figure (b)). This shows low rainfall conditions but the highest in KSA. Surface runoff and drainage during rainfall seasons and flash floods along the high altitude of the Asir Mountains are the main surface hydrology of the area.
3. Material and methods
Multispectral images from the Operational Land Imager (OLI) aboard Landsat-8 and the radar data of Shuttle Radar Topography Mission (SRTM) and Sentinel-1 was processed and analysed in order to identify the surface geologic and structural features (Figure ). The Landsat-8 bands 2, 3, 4, 5, 6, and 7 were used respectively with resolution of 30 m, to perform several image transformations such as band ratios, Minimum Noise Fraction (MNF) and Principal Component Analysis (PCA). Band ratios such as 6/7, 4/2, and 6/5*4/5 was applied here in order to discriminate mafic, felsic and altered rock units. The MNF approach was utilized as a technique of ordering components based on quality [Citation36]. In this manuscript the PCA 3, 2, 1 is used here in R, G, and B to enhance the interpretation rock units as the PCA technique orders the components in decreasing variance in successive principal components.
Figure 3. Flowchart explains the data used adopted in the present study.
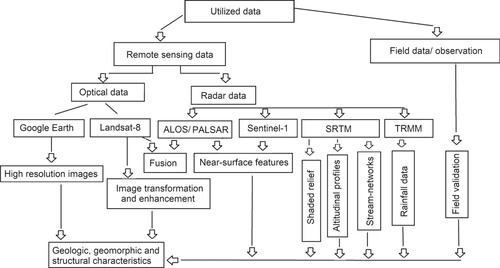
90 m resolution Digital Elevation Map (DEM) of Shuttle Radar Topography Mission (SRTM) imagery was used for extracting streams, faults, and shear. Shaded relief model is used here as a key in the lineament extraction process and interpretation of complex geomorphologic features [Citation37]. This technique is used here to enhance the extraction and the lineament visualization. Moreover, five-time vertical exaggeration of DEM data were used to enhance the study of subtle features within the flat basin areas and emphasizes the topographic conditions of the study area. The slope was used here to define the terrain characteristics, and stream-networks were delineated using SRTM/DEM data, using surface flow routing via the 8D flow direction algorithm [Citation38,Citation39].
The Advanced Land Observing Satellite (ALOS)/ Phased Array type L-band Synthetic Aperture Radar (PALSAR) data was applied in the present investigations. This sensor utilizes the L-band frequency (1.27 GHz, 24 cm) with an incident angle of 34.3°. The selected scene of fine mode acquisitions (HH polarizations, receive horizontally) has a product level 1.5 and contains 10 m of spatial resolution, which is used here to enhance the near-surface structures [Citation1] in the present study by comparing with the OLI sensor and processing by the NEST ESA and the ENVI software packages.
Single polarization mode, containing VV Sentinel-1 [Citation40–42] that utilizes the C-band microwave region of the electromagnetic spectrum (5.405 GHz) is used here. The Sentinel-1data (10 m resolution) geometrically and radiometrically processed in the ESA-NEST software. An enhanced Lee filter was applied here to reduce the speckle effects and to suppress the noise in order to conduct better interpretation and backscatter analysis to revealing near surface features (Figure (c)).
In the present study, rainfall data is obtained from Tropical Rainfall Measuring Mission (TRMM) satellite which produces valuable rainfall data on Saudi Arabia (Figure (c)). The obtained data of available in 0.25° spatial resolution covering the area under investigation, representing the average daily rainfall between January 1, 1998 to November 30, 2012 (evaluated by the global TRMM-3B42 version 7), were used to understand the rainfall intensity and runoff over the area under investigation [Citation2]. The data is processed and interpolated using GIS 10.3 software to understand the spatial distribution of rainfall data (Figure (c)).
The image fusion and combination is a technique that merges images from various data sources to obtain further information than can be individually viewed from any of them alone [Citation1,Citation43–45]. Data merge was performed by utilizing a hue, saturation, and value (HSV) sharpening transformation technique of Envi 5. This Image sharpening technique is applied to sharpen a low spatial resolution image by a high spatial resolution image. Therefore, the merging of band combination 7,5,3 (RGB) Landsat OLI image of 30 m spatial resolution and ALOS/PALSAR (10 m resolution) is applied here to obtain combined image of many properties such as surface geometry/roughness (ALOS/PALSAR) and composition (OLI image) to enhance the outcome of the image.
4. Results
Processing and interpretation of the SRTM DEM data revealed valuable information regarding the geomorphic and structural characteristics through the use of several approaches such as transverse profiles describing the altitudinal contrasts, slope breaks and stream-network extraction, and shaded relief. The DEM showed that the altitude achieves its maxima in the eastern part (∼2388 m) and decreases westward, towards the Red Sea’s level. It generated a steep slope of 0o–62o difference, which is a significant contrast with respect to elevations. Accordingly, ∼40% of the study area is represented by rough and steep slope terrain (Figure (c)). The rough terrain to the east represented an elevated plateau of the Asir Mountains that contain various lithologic and structural features. The western section of the study area represents low relief plain along the Red Sea cost. It is noteworthy that the Asir plateau is tilted eastward, marked in the west by a sharp topographic contrast reflected in the fault scarp (Figure , profile A-B).
Figure 4. (a) SRTM DEM of the present study; x-y representing the transverse profile below the image; (b) Automatic stream-network extraction; (c) Slope of the investigated terrain, the legend indicates the degree of slope; (d) Hill shade relief (sun azimuth 315°, a solar elevation of 30°, and Z = 10). The box in red is explained in figure “f”; (e) Transverse profile along x-y, as depicted in Figure “a”; (f) Subset of OLI 753 on the shaded relief image that is marked in red polygon (Figure (d)).
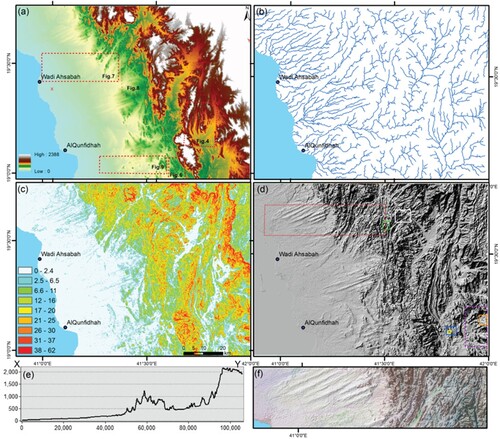
Automatically delineated stream networks show two main categories of E–W and NE trending stream orientations. They exhibit a straight line along major structures and cut through the plateau escarpment with the NE trend, in which the escarpment forms natural basin boundary to the east. Then, they were found to detour into the western low relief of the Red Sea’s coastal plain and the beach, thereafter finding their way to pour into the Red Sea. The stream networks covering the eastern part are aligned in the NNE–SSW directions and link with the ENE–WSW direction at a right angle. Dendritic patterns were recognized in homogenous lithology, on fault with the wide scarp and the Red Sea’s coastal area that show straight, dendritic, and parallel patterns. The prominent short, straight, and parallel streams occur on tilted fault scarp of the Asir Mountains. Applying SRTM DEM revealed a high runoff westward into the Red Sea, as depicted from the automatically extracted drainage channel networks and the elevation (0–2388 m) difference (Figure (b)).
Shaded relief image was obtained by assigning the sun azimuth 315° and a solar elevation of 30°, and Z = 10 maximized the extracted information, as shown in Figure (d). This image (Figure (d)) clearly visualizes the geometry of the terrain and highlights the lineaments that represent fractures, faults, ridges, foliation, and tilted layers. In the eastern part, parallel structural belts were recognized as being dissected by NW–SE, which are related to the Najd Fault systems. In this view, various sub-E–W reliefs were recognized in the plain to the west, when combined with DEM. A draping subset of 753 of OLI on the shaded relief image allowed the visualization of the contrast in the reliefs; where there are two sets of NE–SW and the sub E–W directions appear to be clearly consistent with the extracted stream networks (Figure (d)).
The transverse profile along X–Y displays the roughness of the rugged terrain and the sharp defined topographic contacts represented by fault escarpments that separates the elevated plateau from the western plain (Figure (e)). In addition, several sharp scarps were recognized in the transverse topographic profiles (Figure (e)). In this E–W profile, a significant NNW–SSE sharp topographic contrast was interpreted as a fault trace. The faults are commonly normal faults, contemporaneous with the Red Sea rift. Such faults have steep escarpments and most of the dendritic drainage patterns have developed on these scarps and drained westward. These faults have strong topographic expressions in the form of escarpments and cliffs, many of which appear in the DEM data and can be visualized through high-resolution images on Google Earth.
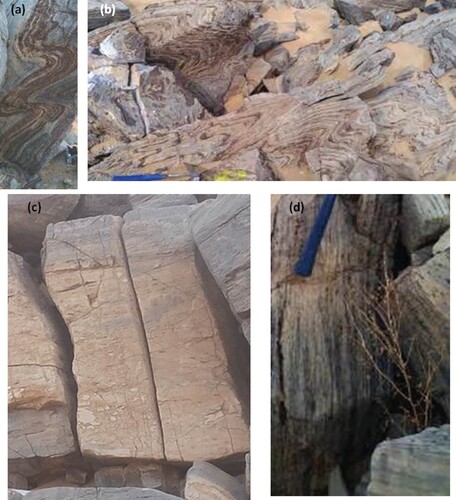
Analysis and interpretation of various data sets of SRTM DEM, OLI, ALOS/PALSAR, Sentinel-1, and Google Earth data revealed folds, joints, and faults, with respective characteristics in the investigated terrain. The repetition of curved symmetric layers of U and S geometry gives the impression of fold geometry [Citation46] that are well-defined by the analysed OLI data (Figure ). The folds are first order (F1) folds [Citation47], highlighted by bedding or marker horizon along the rolling strike [Citation46]. As shown by the DEM data (Figure (b)) they are trending mainly N–S, NNE–SSW and NE. Using band ratios 6/5*4/5 of OLI, 6/7, 4/2 and 6/5*4/5 of OLI, fused ALOS PALSAR/OLI and ASTER DEM (Figure (b)–(e)), clearly highlighted the hinge zone of the F1 folds, which range from tight to isoclinal synforms and antiforms. The parallel beds of the isoclinal folds show the edges’ geomorphology due to the straightness of strike in the satellite images (Figure ), in which the dip direction of E and ENE can be defined, especially in the resolution data of Google Earth that almost (Figure (a,b)). The folds in the northern part of the investigated area probably underwent stronger east–west stresses (Figure (a)) than those present to the south of the study area (Figure (b)). Some of the depicted folds are characterized by well-foliated limbs and contain predominant cores of different compositions (Figure ).
Figure 5. (a) 7, 4, 5 in R, G, B; (b) 6/5*4/5 of OLI; (c) 6/7, 4/2 and 6/5*4/5 of OLI; (d) Fused ALOS/PALSAR/OLI; (e) Aster DEM;(f) Subset of Google Earth displays sinistral NW–SE displacements.
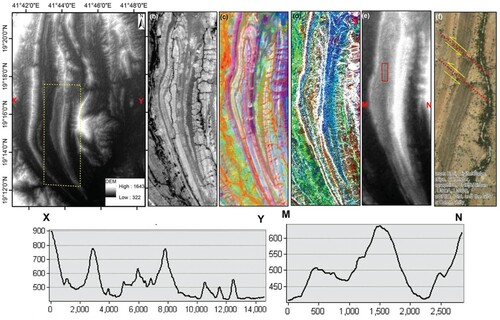
Figure 6. (a) Visualization and re-orientation of the fold limbs, using Google Earth, for the selected area in Figure revealed the overturned syncline fold; (b) Asymmetric syncline fold, the eastern limb of the steep slope, and the western limb of the gentle slope toward the inner part (marked in blue polygon in Figure (d)).
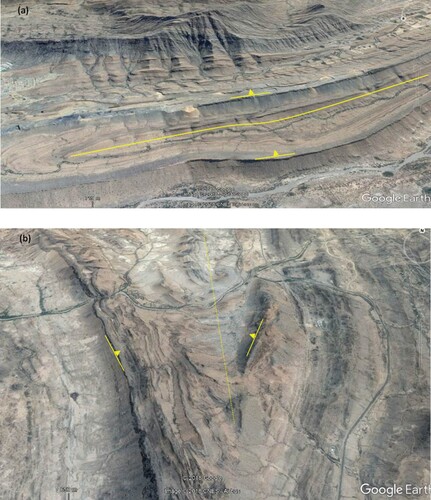
Figure 7. (a) A well-recognized fold depicted from 753 of the OLI data (the area marked in white polygon in Figure (a)); (b) MNF3 grey scale image of the OLI data.
Applying the MNF transformation allowed to highlight the borders of the fold limbs and their core. In this fraction, the limbs were clearly foliated and highly deformed (Figure (b)). The MNF fraction was selected as it not only minimizes the data-dimensionality of multispectral data but also orders the components in terms of the image quality, as with the increase in component number the quality decreases. The highly deformed area surrounded the core in higher brightness that defined domal structure. Through comparison, we found that the MNF3 grey scale provides better measurement than that which is obtained through the use of 7, 5, 3 in RGB. The curving of layers can produce joints along the fold hinges. To the east, the fold border by the major fault line followed the trend NW–SE.
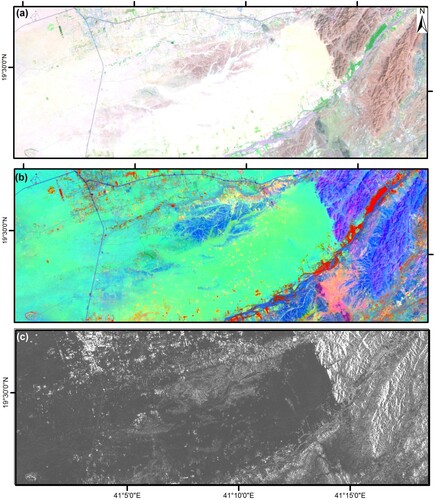
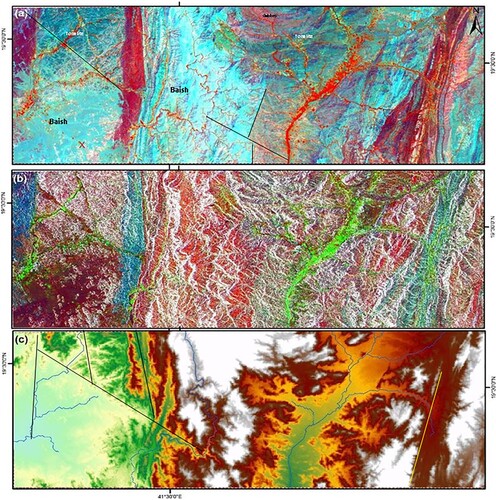
In addition to ductile deformation represented by folds, the faults were recognized on the basis of several features [Citation46]: (a) Abrupt changes in topography and landforms; (b) depressions along the fault trace; (c) lithologic contrasts; (d) scarps or cliff; (e) sudden shifts of drainage courses or straightness of streams. The OLI, superimposed on the hill-shade relief, clearly highlighted the sets of faults that cut the fold. Indeed, the area is dominated by major structures, represented by NW–SE and NE–SW faults and the fracture system. A subset of Google Earth visualized a set of NW–SE sinistral-strike slip faults that cut the folds (Figure (f)). At the downstream areas, NW–SE sinistral faults were found to be intersected by NE–SW normal faults, producing geologic structures along the fault trace, most likely a graben that revealed the accumulation of sand deposits (Figure ). The fault lines were traced by integrating OLI, the analysis of 6/7, 4/2, 6/5*4/5, and the intensity of Sentinel-1 VV. Notably, the display of 6/7, 4/2, 6/5*4/5 in R, G, and B distinctly showed the NW–SE and NE–SW fault lines that bounded the mountainous and low relief of the down-faulted blocks. Such an area is provides an insightful perspective regarding water resources, as they were identified to have received plenty of fluvial deposits and runoff as well. Furthermore, vegetation is common along the NE–SW fault line, shown in green (Figure (a)).
Figure 8. (a) 753 band composite of OLI; (b) 6/7, 4/2, and 6/5*4/5 of OLI; (c) Sentinel-1 VV intensity.
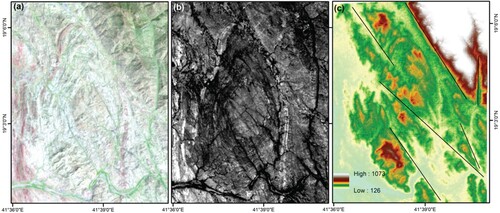
The lithologic contrasts were established using image transformation and enhancements. The use of band ratio 6/7, 4/2, and 6/5*4/5 of OLI, allowed the discrimination of the hard rocks in blue and soil in green. Particular band ratios are perceived to define the composition of the rock units [Citation17,Citation47]. Utilization of the band ratios of 6/7, 4/2, and 6/5*4/5 in R, G, and B of the Landsat OLI, allowed the delineation of areas of clay mineral and vegetation marked by red (Figure (a)). This is because band ratio 6/7 is used particularly to highlight the OH-bearing minerals, and 4/2 defines the ferric-oxide-rich areas in green. Moreover, the band 6/5*4/5 of OLI ( = 5/4*/4 Landsat-7) is useful to discriminate between mafic and non-mafic rocks [Citation47]. This ratio enhances the possibility of ferrous oxides, the FeO-rich alumina-silicate minerals. Therefore, the application of band ratios (6/7, 4/2, 6/5*4/5) led to hard rocks in blue and soil in green being well displayed (Figure (a)). 6/7 has been effectively applied in arid areas for highlighting clay minerals, as clay minerals have a high reflectance in band 6 and a low absorption feature in band 7 [ Citation48].
Using the band ratio colour composite /7, 6/5, and 6/5*4/5 in R, G and B, respectively, distinguished the spectral properties of the investigated rocks quite well (Figure (a)). The processed image noticeably differentiates between the lithologic contrasts of the Baish group and the intrusive contacts. In this image, the argillites (dark reddish colour), OH-bearing minerals (e.g. kaolinite-smectite, micas, amphiboles) that are revealed by band ratio 6/7 [Citation17,Citation49] can be distinguished from tonalities coloured dark cyan. The detected zone of argilites represents a highly deformed contact between the intrusive tonalities and the older Baish group. This is because the clay minerals display prominent absorption in band 7 and high reflectance in band 6 of OLI. The light red represents vegetation. Light cyan highlights the metamorphosed basaltic flows, the pyroclastic rocks, and the serpentinites. Such rocks are alternated with mafic rocks, which are rich in OH-bearing minerals. The fusion of 7, 6, 5 band composites in R, G, and B of the OLI/ALOS/PALSAR data highlighted the geometry of the rock units and the major faults. In this view, the vegetation appears in green colour. DEM shows the fault that impacted the intrusive tonalite intrusion and the surrounding rocks (Figure (c)).
Figure 9. (a) 6/7, 6/5, 6/5*4/5 band combination subset that is marked in green polygon in Figure (d), (b) fused PALSAR/OLI, (c) DEM
The fused ALOS/PALSAR image clearly obscured the bed rocks that are represented as cones in the plain (Figure ). The subset of the available ALOS/PALSAR showed an even clearer view of the plain that is mainly covered by sand, because the electromagnetic L-band penetrates the sand, in contrast to OLI (Figure (b)). The fused subset ALOS/PALSAR and OLI (Figure (c)) showed better results from the combined information. This is because the L-band of PALSAR data provides even deeper penetration and can characterize the hidden features’ lines as well as their structural geometry [Citation1,Citation8,Citation20]. The dark tones arise as a result of the backscattering of radar waves on the sand deposits. These deposits appear to be dark in ALOS/PALSAR data against the intermediate-to-bright outcrops of the surface bedrocks which reflect textural and geometric characteristics based on surface roughness [Citation20,Citation50]. As compared to the optical VNIR/SWIR data, ALOS/PALSAR data is better equipped with the 10 m spatial resolution and the L-band.
Figure 10. (a) A subset of OLI; (b) ALOS/PALSAR data; (c) Fused ALOS/PALSAR/OLI data; (d) Subset of fused ALOS/PALSAR/OLI data; (e) PCA 321 in R, G, and B.
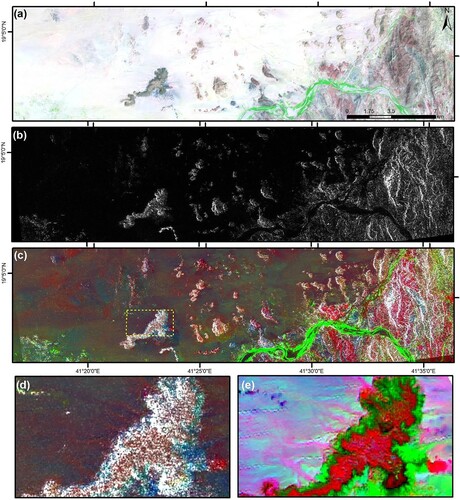
Further analysis of the given OLI data, using certain PCA analysis in R, G, and B, showed a clear zoning in the rock units (Figure (d,e)), which also displayed variations in their outward geometry. The PCA analysis (Figure (e)) provided evidences for metamorphic zoning as a result of the basaltic intrusion into the country rocks. This is because the intrusion of asic rocks into the country allowed the change in the physiochemical characteristics of the host rocks and caused deformation that is represented by foliation. Zoning in the rock units, displayed as a result of the intrusion of basic olivine basaltic rocks on the surrounding bed rocks (Figure (d,e)), can be clearly recognized. Such a process also caused dynamic deformation, reflected in foliations on the contacts. Further analysis of the rock units revealed the metamorphic aureoles (Figure (d,e)). This clarified the fact that during the Quaternary, massive lava flow in the Mekkah region impacted the study area.
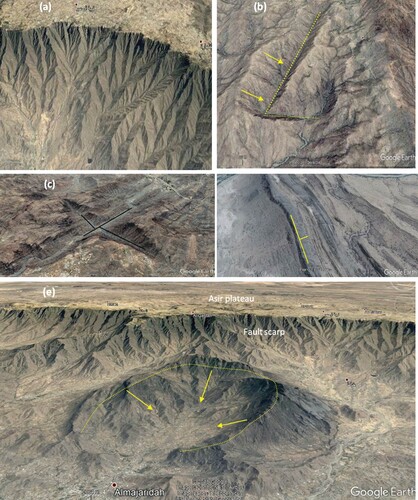
The use of Google Earth images (Figure ) allowed characterizing several exemplified geomorphic features that were difficult to recognize in the medium-resolution images. In these images, the fault scarps shaped by parallel drainages of the borders of the Asir plateau were recognized (Figure (a,e)). Subsidence and uplifts allowed the shaping of intersecting fault lines that meet at right angles, forming “L” shapes and cross-shapes “+”, within the investigated area (Figure (b,c)). Further analysis of these images showed the ring complexes of the intrusive contacts of hornblendite and syenite of Lakathah. These features reflect the complex geologic/structural evolution of the study area.
Figure 11. (a) Parallel and dendritic stream networks on the fault scarp; (b, c) Linear structures meet in right angles, represented by fault scrap; (d) Tilted rocks to the east; (e) Complex structures, containing hornblendite and syenite, of Lakathah display well-defined subcircular structures, like the basin.
Note: The views in this figure are marked as polygons in Figure (b) (a = orange; b = green; c = white; d = yellow; e = magenta).
The lineaments of geological structures have been commonly applied to characterize them [Citation37,Citation51]. The Hill-shade relief displayed enhancement in the edges along with highlighted features, such as landforms and lineaments. Lineament analysis, in this study (Figure (a)), is mainly dependent on the interpretation of SRTM DEMs, OLI, Sentinel-1, and the geological map. Lineaments were recognized and interpreted as the straightness of geological structures, which might be connected to significant geological structures, particularly lithological contacts, tilted rocks, fold axes, joints, and faults. Further, lineaments were obtained mainly by applying Hill-shading/stream-networks of SRTM DEMs, band ratios of OLI data, and sentinel-1 data.
Figure 12. (a) Lineaments extracted from remote sensing (black) and geologic map (blue); (b) Lineament density map; (c, d) Rose diagrams illustrating the orientation (left) and the lengths (right) of the detected linear structural elements in the present study.
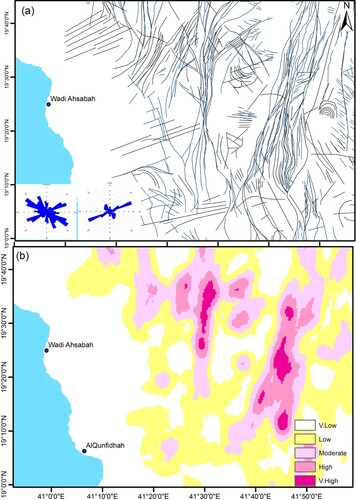
Analyses of the detected lineaments on the rose diagram revealed that the study areas are predominated by NW–SE, NNW–SSE, NE–SW, and NNE–SSW, respectively, according to their abundance. The ENE–WSW, NW–SE, and NNE–SSW lineaments are found to be longer and more abundant than the NW–SE trend. The lineament density map (Figure (b)) also clearly showed various distributions on the area due to major tectonics, particularly the fault and fold zones in the N–S, the NNE, and the NNW directions.
5. Discussion
The tight and isoclinal N–S F1 folds were related to the compressional regime that was constrained within the field (Figure (a,b)) and occurred during the Pan-African Orogeny. Another worldwide name for the Pan African Orogeny is East African Orogen (EAO) that resulted in the collision and amalgamation of several tectonic terrains and the development of the Arabian-Nubian Shield [Citation29,Citation52,Citation53]. The F1 folds are associated with the N–S thrust faults that were turned into normal faults and a graben system (which was reactivated), during the Red Sea rifts that developed. The NW sinistral faults are associated with the Najd fault system [Citation54]. The granitic rocks intruded the fold systems along the NE trend. The NW–trending dyke swarms throughout the eastern part of the study area were synchronous with the left-lateral transform faults that control the Arabian Shield [Citation52]. Based on the lineament interpretation and distribution, the N-trending Nabitah and the NW-trending Najd fault zones have been found to control the terrains. This area experienced dextral shearing, that developed during the EAO [Citation55]. This dextral N–S shearing is older than the sinistral shearing, which is known as the Nabitah orogeny [Citation47,Citation56]. These processes allowed the shaping of the shearing and the fracture system (Figure (c,d)). The sizable tectonic uplift during the Nabitah orogeny (680– 640 Ma; [Citation57,Citation58]) may have been prepared by the breaking apart and faulting of the west block of the Asir mountains and may have segmented the plateau into a normal fault zone trend NW–SE, perpendicular to the uplift force. Therefore, the Asir highlands were sharply uplifted and tilted to the northeast during the Neogene which, in association with the Red Sea’s formation, allowed the formation of the NW–SE normal faults and the E–W shearing after erupting the flood basalt. The presence of (NNW-SSE) extension system that are related to the Red Sea rift, formed NE-SW trending normal faults that cut obliquely, forming depression of the sea cost [Citation59].
Figure 13. Field photographs, (a, b) overturned folds trend NNE–SSW; (c) joints in the N–S direction; (d) foliated marble.
The eastern part of the study area is situated in more elevated terrain, in which most of the drainage system is structurally controlled [Citation11,Citation45]. Most of the wadis receive plausible rainfall precipitation, reflected in the occurrence of vegetation shown in green colour (Figure (a)). However, most of the western part of the given study area is covered by sand, which dominant for several metres, which represents a significant medium for water resources (Figure ). Therefore, a subset of the present study which is displayed by OLI, ALOS/PALSAR, and fused OLI, was investigated. The OLI image revealed the sand cover in white colour and the rocks in dark-red/dark colour; however, the vegetated areas along the wadi were shown in green colour. The ALOS/PALSAR images (Figure ) in grey scale probes the sand covers and display the near-surface views, which allowed better visualization of the unrecognized rocks that are masked by sand (dark tone). The fine-grained sediments appear in dark colour within the ALOS/PALSAR image, in contrast with the bed rocks and the rough sediments [Citation20,Citation45].
Figure 14. (a, b) Sand blankets overlaying the bed rocks and dominant for several metres, which represents a significant medium for water resources.
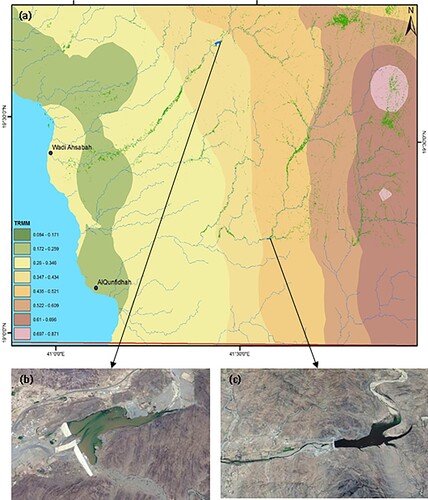
The result of the spatially-distributed rainfall data in Saudi Arabia ranges between 0.04–1.44 mm/day (see Figure (b)). The rainfall precipitation intensity increases on the more elevated area in the southwestern part of the kingdom. Thus, an understanding of the structural geology of the area under investigation is significant to characterize the geologic characteristics and the possible pathways of rainfall precipitation for the groundwater aquifers. The study area is characterized by wide variations in its topography and several tectonic events [Citation47] that have formed subsequent structural elements (F1 folds, sinistral and normal faults, and fractures). The topographic variation and the structural features seem to influence the distribution of rainwater after precipitation, in Saudi Arabia. Based on TRMM and SRTM DEM data, the topography and geology of the Asir Mountains are found to have positive relationships with the precipitation distribution [Citation60].
Based on the results of the NDVI analysis, the study area is abundant in vegetation cover, which leads to sufficient surface-water and groundwater. Water, after precipitation, is preserved in the soil and in highly faulted and/or fractured rocks. Surface water can seep into the substrata through geologic structures, forming groundwater. Therefore, areas having high structural deformations would reserve plausible rainfall and would have more groundwater resources [Citation61]. Fractured and deformed hard rock aquifers encompass a wide range of hydraulic settings due to lithological variations and a history of deformation.
Runoff in the southwestern part of KSA occurs mainly during the seasonal rainfall precipitation, when the wadis receive plausible flood waters from their various tributaries after recharging the sediments below [Citation34,Citation60]. This area received annually about 5–425 mm/year [Citation35]. Several dams were erected in many wadis to save and utilize the water for agricultural purposes. These reservoirs behind the dams (Figure (b,c)) have increased the recharging capacity of the groundwater aquifers, including the shallow (wadis) and the deep aquifers, and also extended the period of irrigation. The area provides greater benefits from its structural intensities and rainfall precipitation, as compared to other areas in the KSA.
Figure 15. (a) Water precipitation that is overlain by vegetated and water-containing areas; (b, c) Water reservoir behind the dam.
The precipitation data derived from TRMM data (Figure (a)) provided important information regarding the rainfall intensities in the study area. The average rainfall data that ranges from 0.084–0.871 mm/day during the period of 1998–2012 showed that the uplands receive a high amount of rainfall precipitation, particularly the eastern parts. Such areas also display the elevated terrains of rough topography, and such catchments were received plausible amount of precipitation. Combining areas that contain steep slopes, receive high rainfall, and have a high density of streams, presents the hazardous areas which witness flash floods [Citation22,Citation62–64]. The presence of mountainous regions and steep slopes can cause damages to life and, therefore, economic activities. Thus, awareness of the direction of water flow and the areas comprising flash flood hazards, along with building erect dams, artificial reservoirs, diversions, and structural densities, would minimize the impact of the hazards.
6. Conclusions
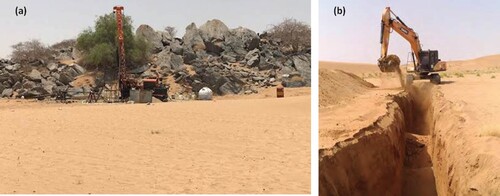
Analysis and interpretation of Landsat-8, SRTM, ALOS/PALSAR, Sentinel-1 and Google Earth data revealed several geomorphic and structural features in the present study. The recognized fold systems– through the remote sensing analysis trend in N–S, NNE–SSW, and NNW–SSE direction – were identified as reflecting the E–W compressional regime. These folds were cut by Cenozoic normal faults, which are related to the rifting events in the Red Sea. A new hydrologic system was developed within the Red Sea coastal plain, which represents the pediment plain of the N–S fault escarpments that bounded the Asir plateau to its east. The fault escarpment represents basin boundary of all the wadis that run from the sharp and steep depression in the east, through the Red Sea plane, and drain into the Red Sea in the west. Due to the continental deposition of clastic material within the Red Sea plane, such as gravel, sand, and sand dunes, the water in the study area is considered to fall under the surface conditions of the wadi aquifers. These Cenozoic continental deposits, accommodated in tectonically developed Cenozoic continental depression, can reserve precipitated rainfall water and flash flood water. The highly structural intensities along with high seasonal rainfall intensity, in comparison to other parts of the Arabian Peninsula, make it a promising area for harvesting water resources. The intermittent heavy storms and rapid runoff because of its high relief caused flash flood hazards on the Red Sea cost. The presence of vegetated cover reflects the abundances of surface and ground- water intensities. In order to harvest the water resources, several techniques such as canal dam/barriers, percolation tanks, reservoirs, and trenches were built along the wadis and are being utilized.
Acknowledgements
The authors would like to thank editor-in-chief Dr. Shaya Al-Qahtani for help and support. Special thanks to Prof. Ali Al-Dousari for his effort that enhanced the manuscript. Finally the authors are grateful to anonymous reviewers for their constructive comments, which helped in improving the quality of the manuscript.
References
- Abdelkareem M, El-Baz F. Analyses of optical images and radar data reveal structural features and predict groundwater accumulations in the central eastern desert of Egypt. Arab J Geosci. 2015;8:2653–2666. doi: 10.1007/s12517-014-1434-7
- Abdelkareem M, El-Baz F. Regional view of a trans-African drainage system. J Adv Res. 2015;6:433–439. doi: 10.1016/j.jare.2014.10.001
- Abdelkareem M, El-Baz F. Mode of formation of the Nile Gorge in northern Egypt by DEM-SRTM data and GIS analysis. Geology J. 2016;51(5):760–778. doi: 10.1002/gj.2687
- Al-Nahmia F, Saddiqi O, Hilali A, et al. Application of remote sensing in geological mapping, case study Al maghrabah area – Hajjah region, Yemen. ISPRS Annals of the Photogrammetry, Remote Sensing and Spatial Information Sciences, IV-4/W4, 2017 4th International Geo-Advances Workshop, 14–15 October (2017), Safranbolu, Karabuk, Turkey.
- Kachelriess D, Wegmann M, Gollock M, et al. The application of remote sensing for marine protected area management. Ecol Indic. 2014;36:169–117. doi: 10.1016/j.ecolind.2013.07.003
- Al-Enezi E, Al-Dousari A, Al-Shammari F. Modeling adsorption of inorganic phosphorus on dust fallout in Kuwait bay. J Eng Res. 2014;2(2):1–14. doi:10.7603/s40632-014-0001-4.
- Baird T, Bristow CS, Vermeesch P. Measuring sand dune migration rates with COSI-Corr and landsat: opportunities and challenges. Remote Sens. 2019;11(20):2423. doi: 10.3390/rs11202423
- Gaber A, Abdelkareem M, Abdelsadek I, et al. Using InSAR coherence for investigating the interplay of fluvial and aeolian features in arid lands: implications for groundwater potential in Egypt. Remote Sen. 2018;10(6):832–849. doi: 10.3390/rs10060832
- Just AC, De Carli MM, Shtein A, et al. Correcting measurement error in satellite aerosol optical depth with machine learning for modeling PM2.5 in the Northeastern USA. Remote Sens. 2018;10:803. doi: 10.3390/rs10050803
- Shi C, Hashimoto M, Nakajima T. Remote sensing of aerosol properties from multi-wavelength and multi-pixel information over the ocean. Atmos Chem Phys. 2019;19:2461–2475. doi: 10.5194/acp-19-2461-2019
- Al-Dousari AM, Aba A, Al-Awadhi S, et al. Temporal and spatial assessment of pollen, radionuclides, minerals and trace elements in deposited dust within Kuwait. Arab J Geosci. 2016;9(2):95), https://doi.org/10.1007/s12517-015-2182-z.
- Aba A, Al-Dousari AM, Ismaeel A. Atmospheric deposition fluxes of 137Cs associated with dust fallout in the northeastern Arabian Gulf. J Environ Radioact. 2018;192:565–572. https://doi.org/10.1016/j.jenvrad.2018.05.010.
- Abdelkareem M, Kamal El-Din G, Osman I. An integrated approach for mapping mineral resources in the eastern desert of Egypt. Int J Appl Earth Obs Geoinf. 2018;73C:682–696. doi: 10.1016/j.jag.2018.07.005
- Abdelkareem M, El-Baz F. Characterizing hydrothermal alteration zones in Hamama area in the central eastern desert of Egypt by remotely sensed data. J Geocarto Int. 2017;33(12):1307–1325. doi: 10.1080/10106049.2017.1325410
- Abrams MJ, Brown D, Leple L, et al. Remote sensing of porphyry copper deposits in Southern Arizona. Econ Geol. 1983;78:591–604. doi: 10.2113/gsecongeo.78.4.591
- Carrino TA, Crosta AP, Toledo CL, et al. Hyperspectral remote sensing applied to mineral exploration in southern Peru: amultople data integration approach in Chapi Chiara gold prospect. Int J App Earth Obs Geoinf. 2018;64:2887–2300.
- Kamal El-Din G, Abdelkareem M. Integration of remote sensing, geochemical and field data in the Qena-Safaga shear zone: implications for structural evolution of the eastern desert. Egypt J Afr Earth Sci. 2018;141:179–193. doi: 10.1016/j.jafrearsci.2018.02.014
- Mwaniki M, Matthias M, Schellmann G. Application of remote sensing technologies to map the structural geology of central region of Kenya. IEEE J Sel Top Appl Earth Obs Remote Sens. 2015;8(4):1855–18867. doi: 10.1109/JSTARS.2015.2395094
- Roth LE, Elachi C. Coherent electromagnetic losses by scattering from volume in homogeneities. IEEE Trans Antennas Propag. 1975;23:674–675. doi: 10.1109/TAP.1975.1141170
- Paillou P, Schuster M, Tooth S, et al. Mapping of a major paleodrainage system in eastern Libya using orbital imaging radar: The Kufrah River. Earth Planet Sci Lett. 2009;277:327–333. doi: 10.1016/j.epsl.2008.10.029
- Gani N, Abdelsalam M. Remote sensing analysis of the Gorge of the Nile, Ethiopia with emphasis on Dejen–Gohatsion region. J Afr Earth Sci. 2006;44(2):135–150. doi: 10.1016/j.jafrearsci.2005.10.007
- Abdalla F, El Shamy I, Bamousa AO, et al. Flash floods and groundwater recharge potentials in arid land alluvial basins southern Red sea coast. Egypt Int J Geosci. 2014;5:971–982. doi: 10.4236/ijg.2014.59083
- Al-Dousari AM., Al-Awadhi J. Dust fallout in northern Kuwait, major sources and characteristics. Kuwait Journal of Science. 2012;39(2A):171–187.
- Al-Dousari AM, Al-Hazza A. Physical properties of aeolian sediments within major dune corridor in Kuwait. Arab J Geosci. 2013;6(2):519–527. https://doi.org/10.1007/s12517-011-0353-0.
- Aba A, Al-Dousari AM, Ismaeel A. Depositional characteristics of 7 Be and 210 Pb in Kuwaiti dust. J Radioanal Nucl Chem. 2016;307(1):15–23. https://doi.org/10.1007/s10967-015-4129-y.
- Prinz WC. Geologic Map of the Al Qunfudhah Quadrangle, Sheet 19 E, Kingdom of Saudi Arabia. Ministry of petroleum and Mineral Resources, Saudi Arabia (1983).
- Greenood WR, Schmidt DL. Late proterozoic cratonization in southwestern Saudi Arabia. Phil Trans R Soc Lond A. 1976;280:517–5277. doi: 10.1098/rsta.1976.0010
- Johnson PR, Kattan F. Oblique sinistral transpression in the Arabian Shield: the timing and kinematics of a neoproterozoic suture zone. Precambrian Res. 2001;107:117–138. doi: 10.1016/S0301-9268(00)00157-1
- Stern RJ. Neoproterozoic (900–550 Ma) arc assembly and continental collision in the east African orogen: implications for the consolidation of Gondwanaland. Annu Rev Earth Planet Sci. 1994;22:319–351. doi: 10.1146/annurev.ea.22.050194.001535
- Gass IG. Pan-African (upper Proterozoic) plate tectonics of the Arabian-Nubian Shield. In: A Kroner, editor. Precambrian plate tectonics. Amstardam: Elsevier; 1981. p. 387–405.
- Kröner A. Ophiolites and the evolution boundaries in the late proterozoic Arabian-Nubian shield of northeast Africa and Arabia. Precambrian Res. 1985;27:277–300. doi: 10.1016/0301-9268(85)90016-6
- Pallister JS, Stacey JS, Fischer LB, et al. Arabian Shield ophiolites and late proterozoic microplate accretion. Geology. 1987;15:320–323. doi: 10.1130/0091-7613(1987)15<320:ASOALP>2.0.CO;2
- Johnson PR. Tectonic map of Saudi Arabia and adjacent areas (scale:1:4,000,000). Saudi Arabian Deputy Ministry for Mineral Resources Open-File Report USGS-OF-97-3 (1998).
- Al-Turki S. Water resources in Saudi Arabia with particular reference to Tihama Asir province, Durham theses, Durham University. (1995) 616 p. Available at Durham E-Theses Online: http://etheses.dur.ac.uk/5127/.
- Yachiyo Engineering CO., LTD. The study on master plan on renewable water resources development in the southwest region the Kingdom of Saudi Arabia; Final report (2010) 68 pp.
- Green AA. A transformation for ordering multispectral data in terms of image quality with implications for noise removal. IEEE Trans Geosci Remote Sens. 1988;26:65–74. doi: 10.1109/36.3001
- Jordan G, Meijninger BML, Van Hinsbergen DJJ, et al. Extraction of morphotectonic features from DEMs: development and applications for study areas in Hungary and NW Greece. Int J Appl Earth Obs Geoinf. 2005;7:163–182. doi: 10.1016/j.jag.2005.03.003
- O’Callaghan JF, Mark DM. The extraction of drainage networks from digital elevation data. Comput Vis Graph Image Process. 1984;28(3):323–344. doi: 10.1016/S0734-189X(84)80011-0
- Jenson SK, Domingue JO. Extracting topographic structure from digital elevation model data for geographic information system analysis. Photogramm Eng Remote Sensing. 1988;54:1593–1600.
- Attema E, Davidson M, Snoeij T, et al. Sentinel- mission overview, (2009) 36–39.
- Liu C. Analysis of Sentinel-1 SAR data for mapping standing water in the Twente region. MSc. Enschede, the Netherland, (2016) 47 p.
- Amitrano D, Di Martino D, Lodice A, et al. Sentinel-1 for monitoring reservoirs: a performance analysis. Remote Sens. 2014;6(11):10676–10693. doi: 10.3390/rs61110676
- Pohl C, van Genderen JL. Multisensor image fusion in remote sensing: concepts, methods and applications. Int J Remote Sens. 1998;19:823–854. doi: 10.1080/014311698215748
- Amarsaikhan D, Gantuya R, Battsengel V. Applications of remote sensing and geographic information systems for urban land-cover changes studies. Geocarto Int. 2009;24(4):257–271. doi: 10.1080/10106040802556173
- Abdelkareem M, Abdalla F, Mohamed SY, et al. Mapping paleohydrologic features in the arid areas of Saudi Arabia using remote-sensing data. Water. 2020;2020(12):417. doi: 10.3390/w12020417
- Ruisi Z, Min Z, Jianping C. Study on geological structural interpretation based on worldview-2 remote sensing image and its implementation. Procedia Environ Sci. 2011;10:653–659. doi: 10.1016/j.proenv.2011.09.105
- Bamousa AO. Infracambrian superimposed tectonics in the late proterozoic units of Mount Ablah area, southern Asir Terrane, Arabian Shield, Saudi Arabia. Arab J Geosci. 2013;86:2035–2044. doi: 10.1007/s12517-011-0490-5
- Sabins FF. Remote sensing for mineral exploration. Ore Geol Rev. 1999;14:157–183. doi: 10.1016/S0169-1368(99)00007-4
- Gupta RP. Remote sensing geology. 2nd ed Berlin: Springer-Verlag; 2003.
- Abdelkareem M, El-Baz F. Evidence of drainage reversal in the NE Sahara revealed by space-borne remote sensing data. J Afr Earth Sci. 2017;110:245–257. doi: 10.1016/j.jafrearsci.2015.06.019
- Hung L, Batelaan O, De Smedt F. Lineament extraction and analysis, comparison of LANDSAT ETM and ASTER imagery. Case study: Suoimuoi tropical karst catchment, Vietnam. Proceedings of SPIE - The International Society for Optical Engineering (2005) 5983.
- Nehlig P, Genna A, Asfirane F, et al. A review of the Pan-African evolution of the Arabian Shield. GeoArabia. 2002;7(1):101–104.
- Meert JG, Lieberman BS. The neoproterozoic assembly of Gondwana and its relationship to the Ediacaran-Cambrian radiation. Gondwana Res. 2008;14:5–21. doi: 10.1016/j.gr.2007.06.007
- Stern RJ. The Najd fault system, Saudi Arabia and Egypt. Alate precambrian rift-related transform system? Tectonics. 1985;4(5):497–511. doi: 10.1029/TC004i005p00497
- Divi SR, Yoshida M. Tectonic and mineralization in the Arabian Shield and extensions: introduction. Gondwana Res. 2001;4(2):129–134. doi: 10.1016/S1342-937X(05)70662-6
- Volesky JC, Stern RJ, Johnson PR. Geological control of massive sulfide mineralization in the neoproerozic Wadi Bidah Belt shear zone, southwestern Saudi Arabia: inferences from orbital remote sensing and field studies. Precambrian Res. 2003;123:235–247. doi: 10.1016/S0301-9268(03)00070-6
- Stoeser DB, Stacey JS. Evolution, U-Pb geochronology, and isotope geology of the Pan-African Nabitah orogenic belt of the Saudi Arabian Shield. In: El- Gaby S, Greiling RO, editor. The Pan-African belt of Northeast African and adjacent areas. Braunschweig: Friedrich Viewig and Sohn; 1988. p. 227–288.
- Fritz H, Abdelsalam M, Ali KA, et al. Orogen styles in the east African Orogen: a review of the neoproterozoic to Cambrian tectonic evolution. J Afr Earth Sci. 2013;86:65–106. doi: 10.1016/j.jafrearsci.2013.06.004
- Sulaiman A, Elawadi EA, Mogren S. Gravity interpretation to image the geologic structures of the coastal zone in al Qunfudhah area, southwest Saudi Arabia. Geophysical J Int. 2018;214(3):1623–1632. doi: 10.1093/gji/ggy220
- Masoud MH. Geoinformatics application for assessing the morphometric characteristics’ effect on hydrological response at watershed (case study of Wadi Qanunah, Saudi Arabia). Arab J Geosci. 2016;9:280. doi: 10.1007/s12517-015-2300-y
- El-Baz F. Sand accumulation and groundwater in the eastern Sahara. J Epis. 1998;21:147–151. doi: 10.18814/epiiugs/1998/v21i3/002
- Abdelkareem M. Targeting flash flood potential areas using remotely sensed data and GIS techniques. Nat Hazards J. 2017;85(1):19–37. doi: 10.1007/s11069-016-2556-x
- Abdelkareem M, El-Baz FF. Remote sensing of paleodrainage systems west of the Nile river. Egypt J Geocarto Int. 2017;32(5):541–555. doi: 10.1080/10106049.2016.1161076
- Hussein S, Abdelkareem M, Hussein R, et al. Using remote sensing data for predicting potential areas to flash flood hazards and water resources. Remote Sens App Soci Environ. 2019;16:100254. doi:10.1016/j.rsase.2019.100254.