
Abstract
This paper reports on the systematic measurement and modelling of the impedance spectra in Bentonite support (solid pellets) with various Ni content (x = 0%, 1%, 3%, 5%, 7%, 13%, 15%, 17% and 20%) for the aim of investigating the dielectric loss tangent versus x. The extracted conductivity and loss tangent exhibited nonlinear variations with x and only rapidly increased above x = 13%. This behavior is more pronounced at low frequencies <100 kHz and is qualitatively consistent with reports about the conductivity of metal–insulator mixture, suggesting better dispersion efficiency of Nickel on Bentonite.
1. Introduction
Catalysis plays an important role in the economy of many vendors concerned with the synthesis of numerous chemicals [Citation1]. In heterogeneous catalysis, the catalytic activity can be determined by some factors including active metals, support materials, and preparation procedures [Citation2]. Availability of cheap metals (e.g. Nickel, Ni) are thus required to provide reliable alternatives for precious metals in industrial heterogeneous catalysis [Citation2].
Bentonite is regarded to be a decent support for many catalysts owing to its strong interaction with metals, its large amount of mesoporosity and its low cost. Hence, Bentonite was employed in several catalytic applications [Citation3]. We have thus performed an impedance characterization measurement in Ni/Bentonite system with various Ni loading content (x = 0–20%) and found that the impedance spectra (specifically the extracted dielectric loss tangent) were consistent with the theory of metal–insulator mixture and was suggesting effective Ni dispersion throughout the Bentonite. Our results may have a direct impact on the science of catalytic reactions as well as on the relevant technologies concerned with capacitor improvement methods (e.g, controlling dielectric breakdown voltage with optimized metal additives [Citation4]). To the best of our knowledge, similar systematic reports in Ni/Bentonite systems are lacking.
2. Materials and methods
2.1. Materials
The following chemicals were used without further purification: Nickel Chloride were purchased from “ASAGGAF-Pharma-HOLYLAND” (production of K.S.A). Bentonite (molecular weight = 1801 g/mol), purchased from Sigma-Aldrich (CAS# 1302-78-9), was in the form of granules with uniform grain sizes, eliminating the need for sieve analysis. The grain size was typically 10 times smaller than the ball clay. It has a surface area of almost 1000 m2/g.
2.2. Methods
2.2.1. Preparation of Ni/bentonite pellets
All samples with different Ni loading (x = 0%, 1%, 3%, 5%, 7%, 13%, 15%, 17% and 20%) were prepared with the following procedure. NiCl2 and bentonite were dissolved separately in adequate amount of deionized water. The bentonite suspension was stirred at room temperature, to confirm the full bulge of bentonite, with a 300 rpm agitation for 20 min. The prepared solution of NiCl2 was released into the bentonite suspension and agitated at 300 rpm at 25 °C for 3 h, attaining a slurry that was dried at 120°C overnight. This heating process ensures moisture-free samples (the pellets were also measured at room temperature in a low humidity environment to further avoid moisturizing the sample under test). We prepared the samples (Pellets) as follows: the dried samples were grounded using mortar and pestle to gain fine powder. Small amount of the fine powder (∼ 0.30 g) was compressed in the hydraulic die-set ket, forming a circular pellet with ∼ 0.5 cm radius and 0.1 cm thickness.
2.2.2. Impedance spectra: measurement procedure
Figure shows the impedance measurement setup using the instrument “Solartron Frequency and Analytical Response analyzer” that was connected to the parallel configuration of the sample (Ni/Bentonite pellets) with a fixed resistor Rp = 47 kΩ. The potential difference across the 100 Ω resistors were controlled by the internal circuitry of the measurement instrument to determine the current between WE and RE1 (Working and Reference Electrodes) and between CE and RE2 (Counter and Reference Electrodes) across these 100 Ω resistors, leading to the evaluation of the impedance. Therefore these 100 Ω resistors were not included in the model for the measured impedance data that was discussed in conjunction with Figure in Section 4. The measurements frequency range was f = 0.1–300 kHz at an AC amplitude of 0.1 V and zero DC voltage.
Figure 1. Impedance measurement setup, where the sample (Bentoniet solid pellet with various Ni content, x%) is connected in parallel with Rp = 47kΩ. The measuring instrument (Solartron 1287A and 1255B) terminals are the counter electrode (CE), working-electrode (WE) and reference electrodes (RE1 and 2).
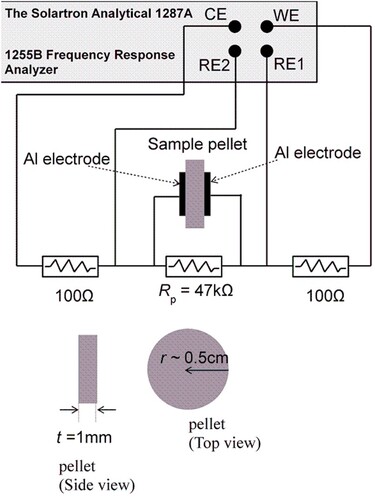
Figure 2. Measured impedance equivalent circuit model. The sample is represented as a constant phase element CPE1 in parallel with R1 resistor. The impedance of the Al contacts is represented by CPE2. This branch is connected in parallel with Rp (see Figure [a]). The CPE is characterized by the parameters (n, Y). The circuit parameters (R1, n1 and 2, Y1 and 2) were used to fit the measured impedance data (obtained from the setup in Figure (b)) with fixed Rp = 47kΩ.
![Figure 2. Measured impedance equivalent circuit model. The sample is represented as a constant phase element CPE1 in parallel with R1 resistor. The impedance of the Al contacts is represented by CPE2. This branch is connected in parallel with Rp (see Figure 1[a]). The CPE is characterized by the parameters (n, Y). The circuit parameters (R1, n1 and 2, Y1 and 2) were used to fit the measured impedance data (obtained from the setup in Figure 1(b)) with fixed Rp = 47kΩ.](/cms/asset/a7878e19-b174-494f-9c71-dcae54a0fec1/tusc_a_1747216_f0002_ob.jpg)
We point out that the Al electrodes were fixed to the sample pellet with a thin layer of adhesive to avoid using a conducting paste (available to us was a silver paste) that would diffuse into the pores of the sample, giving rise to an unwanted signal in the impedance spectrum. However, we have managed (as discussed in Sections 4 and 5) to exclude the effect of this adhesive on the measured impedance spectrum, leaving only the data associated with the Ni/Bentonite pellet.
We also point out that the setup with parallel pellet-Rp configuration in Figure was adopted due to its observed stability (less noise) and excellent data reproducibility as compared with that where the pellet was connected in series with the 100 Ω resistors.
2.2.3. Impedance spectroscopy model
We model the pellet Ni/Bentonite as a resistor connected in parallel with a constant phase element (CPE, i.e. an imperfect capacitor) characterized by the parameters n and Y such that its corresponding impedance is ZCPE = 1/Y(jω)n where ω is the angular frequency (2πf) and ZCPE is a pure reactance (1/jYω) for n = 1 or resistance (1/Y) for n = 0. Figure shows the complete model where the sample is represented by a resistor (R1) in parallel with CPE1 while CPE2 represents the Al contacts. The branch (R1, CPE1, CPE2) is connected in parallel with a fixed resistor Rp = 47 kΩ.
The model in Figure has been employed by the Elchemea software [Citation5] to fit the measured impedance data in order to extract the model parameters (i.e. R1, n1, Y1, n2, Y2) for each sample (i.e. for each x). Finally, the impedance spectra specific to the sample were obtained by simulating (with Elchemea software) the model of CPE1 in parallel with R1 using the extracted values for the model parameters. For example, the data in Figure (a) was calculated with the model shown in Figure (b).
3. Results and discussions
The measured results were presented as the Imaginary impedance (Im. Z) versus the real impedance (Re. Z), i.e. the so-called Nyquist plot (usually, – Im. Z vs. Re. Z [Citation6]). For example, the ideal Nyquist plot is a semicircle for a parallel capacitor (C) and resistor (R) model as shown by the simplified schematic in Figure (c). Here, at low frequency (∼ 0 Hz) Re. Z = R and at high frequency Re. Z = Im. Z = 0. Figure (a) and (b) illustrate the measured data (open circles) for x = 0% and 17% (the data for the remaining x are not shown to avoid crowding the space). Clearly at very low frequency (e.g. 0.1 kHz, Figure (a,b)) the measurement signal avoided the capacitive branch of the sample (i.e. R1, CPE1 and CPE2 branch) and dominantly passed through Rp, giving rise to Im. Z ∼ 0 and Re. Z ∼ Rp = 47 kΩ. The solid lines in Figure are the fitting data obtained from the model in Figure , resulting in the model parameters that are listed in Table . For example, for x = 0% the fitting parameters are Rp = 47 kΩ, R1 = 2.733 × 10¹¹ Ω, Y1 = 2.845 × 10⁻¹¹F·sn1-1, n1 = 0.9722, Y2 = 0.04327 F·sn2-1, and n2 = –0.3602. The maximum fitting error (associated with the standard deviation) for all samples was ∼ 0.5%.
Figure 3. Examples of the measured impedance (Z) data (the circles are: – Imaginary Z versus Real Z) in pellets with Ni contents of x = (a) 0% and (b) 17%. The solid lines are the fitting data obtained from the circuit model in Figure with fitting parameters (Rp, CPE1, CPE2, and R1) described in the text and listed in Table for each x. (c) Standard Nyquist plot for a parallel RC circuit where Re. Z = R at low frequency and Z = 0 at high frequency. (d) The calculated sample conductance (1/R1) versus x obtained from Table .
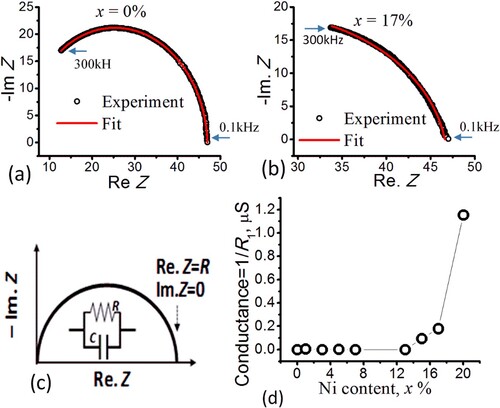
Table 1. The calculated parameters obtained from fitting the model in Figure to the experimental impedance spectrum for the samples with different Ni contents, x.
Figure (d) demonstrates the nonlinear pattern of the conductance (conductance = 1/R1, where R1 were obtained from Table ) as a function of x, where 1/R1 ∼ 0 within 0 < x < 13% followed by a region of a rapidly increasing conductance for x > 13%. This pattern is qualitatively consistent with the existing reports (e.g. [Citation7,Citation8]). The onset of the noticeable increase in the conductance can simply be associated with the sufficient increase of the number of polarization sites (associated with Ni) above x = 13%. The pattern in Figure (d) may also suggest that the Nickel dispersed effectively (i.e. spread in a large surface area) in the Bentonite support (as reported by [Citation9] who observed weak and broad NiO peaks on Ni/Bentonite as an evidence of better dispersion of NiO particles). Otherwise, Ni may accumulate away or beneath the electrodes (our electrodes were having smaller surface area than that for the pellet), giving rise to fluctuating or monotonically increased/decreased conductance for different samples. The effective dispersion property of catalysts increases the catalyst surface area on the support and, hence, speed up the catalytic reaction [Citation9].
Figure (d) stimulated us to investigate the dielectric loss in the region of low (x < 13%, Figure (d)) and high conductance (x > 13%, Figure (d)). Figure (a) shows the dependence of the dielectric loss (associated with the dielectric loss tangent, tan δ, [Citation10]) on the measurement frequency (f) with “ x” as a parameter. These data were calculated from tan δ = ∈``/∈` = Re. Z / Im. Z [Citation6] where ∈`` and ∈` are the complex and real dielectric constants. Thus, tan δ were calculable (i.e. using Elchemea sotware [Citation5]) from the ratio between Re. Z[CPE1, R1] and Im. Z[CPE1, R1] where Z[CPE1, R1] is the sample’s impedance corresponding to the sample model shown in Figure (b). We stress that the sample model in Figure (b) is part of the overall model in Figure which has been used to fit the measured impedance spectra, resulting in the fitting parameters in Table . Thus, to simulate Z[CPE1, R1] using Elchemea software we restricted ourselves to the values of R1 and CPE1 (i.e. n1 and Y1) from Table and run the Elchemea simulation on Figure (b) model to obtain tan δ (Figure (a)) from the ratio between Re. Z[CPE1, R1] and Im. Z[CPE1, R1].
Figure 4. (a) The dielectric loss versus the frequency (f) for Ni contents x = 0–20%. The inset is tan δ versus x at f = 100 Hz. (b) the part of the model in Figure that was used to calculate the data in (a). This part represents the model of our Bentonite pellet with x% of Ni. The values of n1, Y1 and R1 parameters for each x% are listed in Table .
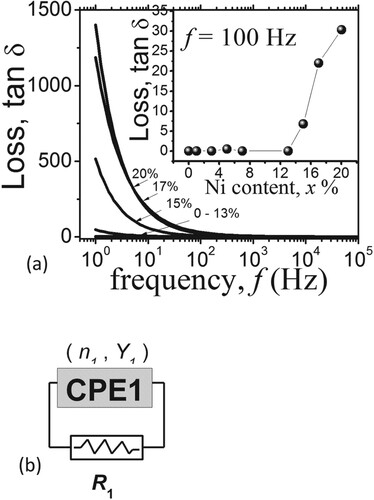
Clearly Figure (d) and Figure (a) are compatible with each other, since the onset of the increasing conductance (x > 13%, Figure (d)) coincides with the onset of increasing tan δ specifically in the low frequency regime (f < 1 kHz), whereas for x < 13% the samples were in the insulating regime characterized by the nearly no conductance and low tan δ for all f. The low frequency conductance and tan δ suggests that the time constant for the site polarization (associated with Ni or Ni oxide, as it has been reported that Ni forms NiO in Bentonite [Citation9]) is large. To further investigate the compatibility of Figure (d) and Figure (a), we plotted tan δ versus x at f = 100 Hz (inset of Figure (a)). Clearly, tan δ is quite low for x < 13% and then rapidly increased after x = 13%, in congruent with Figure (d).
4. Conclusion
We performed systematic measurement and modelling of the impedance spectra in Bentonite support (solid pellets) with various Ni content (x = 0%, 1%, 3%, 5%, 7%, 13%, 15%, 17% and 20%) for the aim of investigating the dielectric loss factor versus x. The conductivity and loss factor exhibited nonlinear variations with x and only rapidly increased above x = 13%. This behaviour was more pronounced at low frequencies < 100 kHz and is qualitatively consistent with existing reports about the conductivity of metal–insulator mixture. It has also been associated with the better dispersion efficiency of Nickel in Bentonite. Thus, our finding triggered the relevance of impedance characterization with the evaluation of the catalyst dispersion quality which is essential for improving catalytic reaction.
Disclosure statement
No potential conflict of interest was reported by the author(s).
References
- Deutschmann O, Knözinger H, Kochloefl K. Heterogeneous catalysis and solid catalysts. Ullmann’s Encyclopedia of industrial Chemistry. American Cancer Society; 2009. doi:10.1002/14356007.a05_313.pub2.
- Liu M, Yi Y, Wang L, et al. Hydrogenation of carbon dioxide to value-added chemicals by heterogeneous catalysis and plasma catalysis. Catalysts. Mar. 2019;9(3):275. doi: 10.3390/catal9030275
- Sedaghat ME, Rajabpour Booshehri M, Nazarifar MR, et al. Surfactant modified bentonite (CTMAB-bentonite) as a solid heterogeneous catalyst for the rapid synthesis of 3,4-dihydropyrano[c]chromene derivatives. Appl Clay Sci. Jun. 2014;95:55–59. doi: 10.1016/j.clay.2014.02.016
- Beale PD, Duxbury PM. Theory of dielectric breakdown in metal-loaded dielectrics. Phys Rev B. Feb. 1988;37(6):2785–2791. doi: 10.1103/PhysRevB.37.2785
- Elchemea Analytical. https://www.elchemea.com/.
- Macdonald JR, Johnson WB. Fundamentals of impedance spectroscopy. In Impedance spectroscopy, John Wiley & Sons, Ltd, 2018, pp. 1–20.
- Malekie S, Ziaie F. A two-dimensional simulation to predict the electrical behavior of carbon nanotube/polymer composites. J Polym Eng. 2016;37(2):205–210. doi: 10.1515/polyeng-2015-0511
- McLachlan DS. Equation for the conductivity of metal-insulator mixtures. J Phys C Solid State Phys. Mar. 1985;18(9):1891–1897. doi: 10.1088/0022-3719/18/9/022
- Zhang R, Guo G, Gao Y, et al. Compared study on the bentonite supported nickel based catalysts materials. Mater Lett. Dec. 2013;113:146–148. doi: 10.1016/j.matlet.2013.09.019
- Engineering Physics Theory and Experiments. Scribd. https://www.scribd.com/doc/281112044/Engineering-Physics-Theory-and-Experiments.