
 ?Mathematical formulae have been encoded as MathML and are displayed in this HTML version using MathJax in order to improve their display. Uncheck the box to turn MathJax off. This feature requires Javascript. Click on a formula to zoom.
Abstract
A reliable and sensitive micelle based liquid chromatography (MLC) was developed aiming to simultaneously estimate three binary antibiotic mixtures namely: cefixime (CFX) in combination with either linezolid (LNZ) (mixture Ι) or levofloxacin hemihydrate (LEV) (mixture II), and nifuroxazide (NX) with drotaverine HCl (DV) (mixture IΙI). All mixtures were separated using a micellar mobile phase prepared in 0.02 M phosphoric acid and consisting of an anionic surfactant; sodium dodecyl sulphate, triethylamine (0.3%), n-propanol, adjusted to pH 2.5 (for mixtures Ι and ΙΙ) or pH 5 for mixture ΙΙΙ with detection wavelengths of 254, 295, and 210 nm for the three mixtures respectively. Separation of the first two mixtures was conducted using a C18 column, while the last mixture was separated using a C18 monolithic column. Drugs in mixture I were rectilinear at (1.0–320.0 µg/mL) and (0.5–320.0 µg/mL) for CFX and LNZ, respectively with corresponding detection limits of 0.3269 and 0.0512 µg/mL and quantitation limits of 0.9906 and 0.1552 µg/mL, while pharmaceutical agents in mixture II showed linearity over the ranges of (0.125–80.0 µg/mL) and (0.25–160.0 µg/mL) for CFX and LEV, respectively with corresponding detection limits of 0.0154 and 0.026 µg/mL and quantitation limits of 0.0465 and 0.0789 µg/mL. Whereas linearity ranges of the analytes in mixture ΙΙΙ were 0.5–400.0 µg/mL and 2.0–400.0 µg/mL for NX and DV respectively with corresponding detection limits of 0.1822 and 0.2631 µg/mL and quantitation limits of 0.5522 and 0.7974 µg/mL. The proposed method was thoroughly validated; besides it was applied to estimate the concerned analytes in their dosage forms. The results obtained from the developed method and the reference methods were in accordance. The proposed method was further extended to determine drugs of mixtures Ι and ΙΙ in spiked human plasma without any extraction steps with high recovery percentages.
1. Introduction
Co-administration of two or more antibiotics could be encountered in severe illness which includes meningitis, staphylococcal pneumonia, brucellosis, endocarditis and tuberculosis [Citation1]. Such combinations should be only prescribed after careful medical examination and given in optimum doses. On the other hand, several harmful effects may arise upon using such combinations, such as: increase in the hypersensitivity and/or toxicity of one or more of the drugs in the mixture, appearance of bacterial resistance for any of the used antibiotics, possible drug–drug interaction, and emergence of complicated infection by the resistant organism that is not responding to any of the drugs used in the mixture [Citation1].
To overcome such limitations, it is required to accurately assay the used antibiotics applying an efficient technique which allows quantification in biological fluids with simple procedure and achieving well recoveries. Such requirements give us the enthusiasm to propose micellar liquid chromatography as an analytical method to assay three antibiotics binary mixtures; namely (cefixime/ Linezolid) CFX/LNZ (mixture Ι), (cefixime/ levofloxacin hemihydrate) CFX/LEV (mixture ΙΙ), and (Nifuroxazide/ drotaverine HCl) NX/DV (mixture ΙΙΙ).
Cefixime is a broad spectrum cephalosporin belonging to the 3rd generation [Citation2] (Figure A). Linezolid (Figure B), is an oxazolidinone antibiotic having a greater activity against Gram(+) than Gram(-) bacteria [Citation3]. On the other hand, levofloxacin hemihydrates (Figure C), is an isomer of the fluoroquinolone antibiotic ofloxacin [Citation1]. It is generally considered to be about twice as active as ofloxacin; the racemic substance. Concurrent administration of CFX with LEV may lead to enhancement in the gastro intestinal disturbances which are one of the main adverse effects for both cephalosporins and quinolones [Citation2]. Meanwhile, co administration of CFX with LNZ could lead to lactic acidosis –a well known side effect of LNZ- which may be potentiated by the diarrhea caused by CFX [Citation2].
Figure 1. Structural formulae of: (A) Cefixime. (B) Linezolid. (C) Levofloxacin hemihydrates. (D) Nifuroxazide. (E) Drotaverine hydrochloride. (F) Daclatasvir dihydrochloride
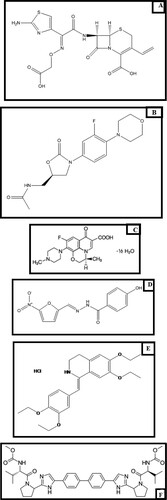
Meanwhile, Nifuroxazide (Figure D), is a broad spectrum intestinal nitrofuran antibiotic utilized to manage diarrhea and colitis [Citation2]. Furthermore, its utility to control urinary tract and skin infections is well known [Citation1]. Eventually, Drotaverine HCl is an antispasmodic which is used to manage biliary, urinary, and gastrointestinal spasm [Citation1] (Figure E).
Different separation techniques were reported for the estimation of the studied pharmaceuticals whether alone or combined with other pharmaceuticals. The most recent methods include HPLC [Citation4–20], HPTLC [Citation21,Citation22] and capillary electrophoresis [Citation23–26].
Recently, Monolithic columns acquired an important role in HPLC. Such columns are composed of a tightly sealed single piece permeable medium; consequently, the mobile phase transudes through the entire bed [Citation27]. The mesopore structure of the porons controls both the efficiency of the analytical column, and the kinetics of the mass transfer. There are many advantages of monolithic columns making them very useful in many liquid chromatographic applications including highly efficient separation in a very short chromatographic run [Citation27].
Liquid chromatography is considered one of the most utilized analysis methods for drugs analyses. Among the most vital applications of HPLC is chiral separation of enantiomeric pharmaceutical agents using suitable chiral stationary phases. The importance of this application arises from the fact that only one enantiomer of a certain drug possesses the desired pharmacological action, while other enantiomer(s) lacks this efficiency and its presence in dosage forms contribute to undesirable side effects which may develop to potential toxicity in some cases. Many review articles in the literature discussed chiral separation covering many aspects, like discussing the advances of chiral separation on monolithic columns [Citation28], and retrieving the new trends in small peptides chiral separation [Citation29]. Several research papers were also concerned with enantiomeric separation of different pharmaceuticals like ibuprofen [Citation30], nebivolol [Citation31,Citation32], piperidine-2,6-dione analogues [Citation33], and various racemic pharmaceuticals utilizing macrocyclic glycopeptides in addition to polysaccharides and antibiotic chiral columns [Citation34].
By following up the previously published articles, it was obvious that MLC has not been utilized before to determine any of the studied binary mixtures, which gave us the enthusiasm to perform this study taking advantage of the unique features of micelle based mobile phases, which includes: lower consumption of organic solvents which emphasizes on the application of green chemistry in the assay of pharmaceutical compounds accomplishing more safety for the analysts and proving to be environmentally benign. Moreover, the solubilizing ability of micelles was one of the factors that encouraged us to perform this study, since it permits direct injection of biological fluids without prior extraction which is usually a tedious time consuming procedure that may result in lower recovery percentages [Citation35]. It is to be mentioned that the method has a short chromatographic run, which helps in assaying multiple samples. Routine-one factor at a time-steps for optimization of the developed MLC were followed and the research article concerned with MLC separation of ambroxol and levofloxacin [Citation36] was used as a guide during experimental studies.
2. Experimental
2.1. Instruments
Perkin Elmer Chromatograph “TM Series 200” with UV/VIS detector and a 20 µL loop, supplied with injector valve of Rheodyne.
Ultra-filtration unit “Millipore filter Sibata” was used to filter the mobile phases.
To degas the mobile phases, “Prominence degasser DGU-20A5” was utilized.
pH metre “Jenway 3503 digital (UK)” was used to adjust pH.
2.2. Materials
Cefixime (Batch # KCI03140046), Sigma Co., Cairo, Egypt. It has a potency of 98%.
Linezolid (Batch# IF060601), Glenmark Co., Cairo, Egypt. It has a potency of 99.6%.
Levofloxacin hemihydrate (Batch # 20120605) obtained from Eva Co., Cairo, Egypt. It has a potency of 99.4%.
Nifuroxazide (Batch # 20090301), of 98% purity and drotaverine HCl (Batch # D008A-05), of 98.8% purity were both supplied by EVA Pharmaceutical Company, Cairo, Egypt.
Daclatasvir dihydrochloride (DTS) (Figure F) (Batch # DCZN160002), of 98.8% purity, supplied by BDR Lifesciences Private Limited company, Gujarat, India.
Sodium dodecyl sulphate (SDS) of purity 90%, n-propanol, methanol and acetonitrile were all purchased from (Sigma-Aldrich, Germany).
triethylamine (TEA) was purchased from (Riedel-deHäen, Germany).
orthophosphoric acid (85% w/v), (Prolabo, France).
The human plasma sample from Mansoura University Hospital, Mansoura, Egypt. It was kept frozen till use after gentle thawing.
2.3. Conditions of chromatographic separation
Regarding mixture I, separation was conducted using an ODS hypersil C18 column (250 mm×4.6 mm i.d., 5-µm particle size). The mobile phase is composed of n-propanol: 0.1M SDS: TEA (10: 90: 0.3, v/v/v) prepared in 0.02 M H3PO4 at pH 2.5, with flow rate of 1.2 mL/min and λ=254 nm. For mixture II, the same column was utilized. The mobile phase consisted of n-propanol: 0.15 M SDS: TEA (8: 92: 0.3, v/v/v) prepared in 0.02M H3PO4 at pH 2.5, with flow rate of 1 mL/min adopting λ = 295 nm.
On the other hand, mixture ΙΙΙ was separated using Onyx Monolithic C18 column (100 mm×4.6 mm i.d., 2-µm particle size) as a stationary phase, while the mobile phase used was 0.1M SDS: n-propanol: TEA (85:15:0.3, v/v/v) in 0.02M phosphoric acid at pH 5. A flow rate of 1.2 mL/min was utilized through the study with UV detection at 210 nm.
2.4. Standard solutions
Solutions of CFX, LNZ, LEV, NX, DV and DTS containing 1.0 mg/mL were attained through dissolving in methanol, and further diluting with the same solvent to reach the required ranges of concentrations of the studied drugs for the three mixtures.
2.5. Procedures
2.5.1. Construction of calibration plots
Accurate volumes of the stock solutions of each of the studied drugs were transferred into volumetric flasks (10.0 mL) to get final concentrations of (1.0–320.0 µg/mL) and (0.5–320.0 µg/mL) for CFX and LNZ in mixture I and (0.125–80.0 µg/mL) and (0.25–160.0 µg/mL) for CFX and LEV in mixture II. Concerning mixture ΙΙΙ, aliquots of each of NX or DV stock solutions covering the linearity ranges of 0.5–400.0 and 2.0–400.0 µg/mL respectively were quantitatively transferred to 10.0 mL volumetric flasks and spiked with DTS internal standard of final concentration (40.0 μg/mL). For all mixtures, the mobile phase was used to carry out dilution, followed by injecting 20 µL for three times applying the described chromatographic conditions. By plotting the peak areas (mixtures Ι and ΙΙ) or peaks area ratios (mixture ΙΙΙ) versus the final concentrations, calibration plots were obtained; from which derivation of regression equations was performed.
2.5.2. Analysis of antibiotic combinations in synthetic mixtures
Appropriate volumes were taken from the stock solutions of the studied drugs- keeping the pharmaceutical ratio of (1: 3) for CFX and LNZ in mixture I, (0.8: 1) for CFX and LEV in mixture II, and (5: 1) for NX and DV in mixture IΙI - were transferred to volumetric flasks (10.0 mL). Then the procedure mentioned under “construction of calibration plots” was followed. The percentage recoveries were deduced applying the appropriate regression equations.
2.5.3. Assay of laboratory prepared formulations
The combined tablets of mixtures Ι and ΙΙ were prepared in our laboratory keeping the drugs in their pharmaceutical ratio; (1:3) for CFX and LNZ; (mixture I) and (0.8:1) for CFX and LEV; (mixture II). While the co-formulated capsules for mixture ΙΙΙ were prepared by keeping NX and DV in a ratio of (5:1). All dosage forms were prepared through mixing the active ingredients with maize starch (15 mg), magnesium stearate (10 mg), lactose (15 mg) and talc (20 mg) for each tablet or capsule. An accurately weighed quantity of prepared tablet or capsule powder which is equivalent to 16.66 mg CFX with 50.0 mg LNZ in mixture I, 400.0 mg CFX with 500.0 mg LEV in mixture II, and 200.0 mg NX with 40.0 mg DV in mixture ΙΙΙ were transferred into volumetric flasks (100.0 mL) where 80 mL of methanol were added. Sonication was performed followed by dilution and filtration. Volumes with different concentrations of every drug in each binary mixture were prepared by dilution with the same solvent and assayed as mentioned under “construction of calibration plots”. Calculation of each drug concentration was carried out through the suitable regression equation.
2.5.4. Analysis of CFX, LNZ and LEV in spiked human plasma
One mL of human plasma was transferred to a series of volumetric flasks of 10.0 mL volume, spiked with increasing quantities of CFX, LNZ or LEV to get a concentration range of (1.0–5.0 µg/mL) and (0.5–50.0 µg/mL) for CFX and LNZ, respectively in mixture I. While in mixture II, the final concentration ranges were (0.25–8.0 µg/mL) and (0.25–12.0 µg/mL) for CFX and LEV, respectively. The contents of the flasks were completed with the mobile phase then filtered. Procedure mentioned under “construction of calibration plots” was applied. Concentrations of drugs in plasma were determined applying the suitable regression equation.
3. Results and discussion
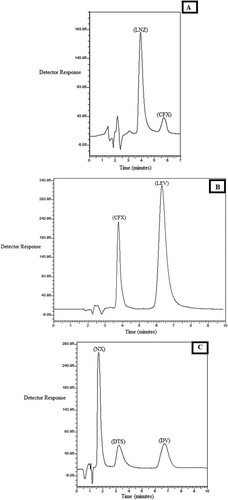
The developed methods were able to efficientley separate binary mixtures of the concerned drugs using MLC applying isocratic elution technique, and yielding symmetric well separated peaks as could be seen from Figure (A–C). Different factors were studied to choose the most suitable mobile phase, achieving best separation parameters and maximum sensitivity measures.
Figure 2. Chromatograms of laboratory prepared mixtures of: A: CFX (33.32 µg/mL), LNZ (100.0 µg/mL). B: CFX (80.0 µg/mL), LEV (100.0 µg/mL). C: NX (100.0 µg/mL), DV (20.0 µg/mL) and DTS as internal standard (40.0 µg/mL).
Starting with column choice, several columns were tested including: ODS hypersil C-18 column (250 × 4.6 mm i.d., 5 µm particle size), Agela Technologies, USA, ODS hypersil C-8 (250 × 4.6 mm i.d., 5 µm particle size), Merck, Germany and Onyx Monolithic C-18 column (100 mm×4.6 mm i.d., 2-µm particle size), Merck, Germany. From experimental investigations, the first column was found to be superior to the other two columns in the separation of mixtures Ι and ΙΙ since it resulted in well resolved peaks and achieving short chromatographic run times, while the C8 column produced distorted overlapped peaks. Concerning mixture ΙΙΙ, DV was retained and couldn't be eluted when the first two columns were used. Hence, Monolithic C-18 column was tried and it succeeded to elute DV and to efficiently separate the studied drugs in a short run.
The influence of SDS concentration was investigated over the concentration of 0.05–0.2 M SDS. It was observed that 0.1M and 0.15M of SDS were the suitable concentrations for mixtures I and II, respectively achieving highest separation parameters giving maximum number of theoretical plates and highest resolution factors (Tables and ). When the concentration of SDS was lower than the optimum in case of both mixtures, the retention time of CFX increased and its peak was distorted, which results in a remarkable delay in the analysis time. However, when SDS concentration was higher than the selected values, CFX was eluted rapidly from the column overlapping with the solvent front (in both mixtures), in addition to its poor resolution from LNZ (mixture Ι), as reflected from the small Rs values; 1.98, and 0.96 (Table ). Regarding mixture ΙΙΙ, 0.1 M SDS showed best results in terms of peaks symmetry and retention times of all analytes, attaining best resolution between the studied drugs (Rs = 5.31, Table ).
Table 1. Effect of mobile phase composition on the chromatographic separation parameters in mixture I.
Table 2. Effect of mobile phase composition on the chromatographic separation parameters in mixture II.
Table 3. Effect of mobile phase composition on the chromatographic separation parameters in mixture IΙI.
pH values ranging from (2.5–6) were investigated to study their influence on the separation efficiency. For mixtures Ι and ΙΙ, pH 2.5 was found to be the optimum value as it gives well-shaped peaks with high number of theoretical plates. For both mixtures, the retention time of CFX decreased gradually by elevating the pH values, so that it overlapped with solvent front. This behaviour is in accordance with its acidic nature reflected from its pka values (2.92, 3.45) [Citation37]. Such values suggest that by raising the pH, more ionization of CFX will be experienced, increasing its polarity, and decreasing its retention time, eluting with the solvent front. On the other hand, the retention time of LNZ was not affected through the entire pH range, as it possesses a basic nature (pka 14.45) [Citation37], hence it is expected to be ionized over the entire studied pH range. Regarding LEV, its elution time decreased by elevating the pH over 2.5, where it starts to overlap with CFX. The pka values of LEV (5.45, 6.2) [Citation37] suggest that the drug becomes in neutral state at low pH values (2.5), and by increasing the pH, its ionization starts to increase its polarity, decreasing its retention time consequently. Since the drugs of mixture ΙΙΙ are weakly basic, (pka of DV 7.11, pka of NX 8.33) [Citation37], they are ionized through the entire pH range, their degree of ionization is highest at lower pH values (least retention times), and starts to decrease gradually by increasing pH (higher retention times), after detailed study, pH 5 was found to be optimum compromising between retention times and peaks symmetry.
The effect of various organic modifiers -such as n-propanol, methanol and acetonitrile- on the separation efficiency was also tested. For all mixtures, n-propanol was superior to other organic modifiers as it resulted in symmetrical well separated peaks. On the other hand, both methanol and acetonitrile were found to increase the retention times of the drugs up to 20 min and gave non symmetrical peaks. The ratio of n-propanol was modified from (8% −15%). It was observed that 10%, 8% and 15% for the three mixtures respectively were appropriate resulting in maximum separation efficiency parameters (Tables –).
The influence of wavelength in both mixtures was studied. For mixture I, different wavelength settings were investigated; (230–300 nm), 254 nm was selected accomplishing optimum sensitivity. For mixture II, λ was investigated over the range (250–300 nm). Based on the same concept, 295 nm was chosen for that mixture. Regarding mixture ΙΙΙ, after detailed investigation, 210 nm was used achieving best sensitivity for both drugs.
Flow rates ranging from 0.8–1.2 mL/min were investigated. After throughout investigation, flow rates of 1.2 mL/min (mixtures Ι and ΙΙΙ) and 1 mL/min for mixture ΙΙ, were selected accomplishing short analyses run time accompanied with peaks symmetry.
Finally, different internal standards were tried for the last mixture, such as cefixime, linezolid, levofloxacin hemihydrate, ebastine and daclatasvir dihydrochloride. Daclatasvir dihydrochloride was chosen since it was eluted in a reasonable time without delaying the chromatographic run, and could be detected in a suitable sensitivity with the wavelength used throughout the study. Ebastine was retained on the column and couldn't be eluted for more than 15 min, and the rest of the drugs overlapped with NX.
The obtained results for the three mixtures are presented in Tables –.
3.1. Method validation
Validation parameters were studied according to ICHQ2 (R1) recommendations [Citation38].
The linearity and range of the proposed method was assessed when plotting concentration in µg/mL of either drugs versus the peak area (peak area ratios for mixture ΙΙΙ), the regression equations were derived and found to be:
P = −5358.8 + 25275 C for CFX in mixture I
P = 702.88 + 33446 C for CFX in mixture II
P = 25389 + 44061 C for LNZ
P = 51996 + 81482 C for LEV
P = 0.0484 + 0.0573 C for NX
P = 0.0178 + 0.0194 C for DV
Where: C represents the drug concentration in µg/mL, P represents the peak area.
Values reaching unity of correlation coefficient (Table ) indicate satisfactory linearity.
Table 4. Analytical performance data for the determination of the studied drugs by the proposed method.
LOD and LOQ were calculated according to ICH Q2 (R1) [Citation38]. The calculated values are listed in Table .
Accuracy was studied by comparing results procured from drugs analyses applying the proposed method in pure form (Table ) or in synthetic mixtures (Tables and ) with those of comparison methods [Citation4,Citation5,Citation19]. As could be deduced, high recoveries -in addition to low values of t and F test [Citation39] obtained by comparing the results of the proposed and the reference methods-indicate that the proposed method is accurate. Since the excipients in the dosage forms showed no interference during the quantitation of the concerned drugs, accuracy was proved. On the other hand, the precision test was carried out to investigate repeatability and intermediate precision (Table ), showing low RSD values which proved the precision of the developed method.
Table 5. Application of the proposed method for the analysis of the studied drugs in pure form.
Table 6. Assay results for the determination of the studied drugs (mixtures Ι and ΙΙ) in laboratory prepared mixtures.
Table 7. Assay results for the determination of the studied drugs (mixture ΙΙΙ) in laboratory prepared mixtures.
Table 8. Precision data for the determination of the studied drugs by the proposed methods.
Robustness was assessed by evaluating the effect of minor changes in the mobile phases composition on the obtained separation efficiency parameters, such as: organic modifier concentrations (optimum conc. ± 1), pH (2.5 ± 0.1), and concentration of SDS (optimum conc. ± 0.02) on performance criteria of the proposed method. Such small changes had no influence on the responses obtained by the developed method, demonstrating robustness.
Finally, specificity of the developed method was illustrated by analyzing different antibiotics binary mixtures within the described concentration ranges, where the results showed acceptable percentage recoveries and small RSD values. Also, the added excipients in the prepared tablets and capsule showed no interfering peaks at the wavelength of detection used and applying the optimum chromatographic conditions (Table , Figure ). Moreover, specificity was also demonstrated during analysis of drugs in mixtures Ι and ΙΙ in plasma, where biological matrices showed no interference at the retention times of the studied drugs (Figure ).
Figure 3. Chromatograms of laboratory prepared co-formulated dosage forms of: A: laboratory prepared co-formulated tablet of CFX (33.32 µg/mL), LNZ (100.0 µg/mL). B: Laboratory prepared co-formulated tablet of CFX (80.0 µg/mL), LEV (100.0 µg/mL). C: laboratory prepared capsules of NX (100.0 µg/mL), DV (20.0 µg/mL) and DTS as internal standard (40.0 µg/mL).
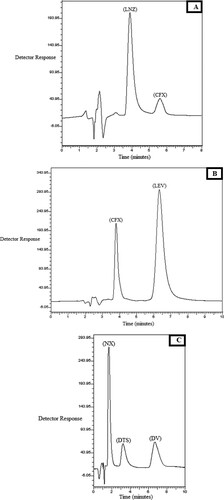
Figure 4. Chromatograms under the described chromatographic conditions of: A: Blank plasma. B: CFX (4.0 µg/mL), LNZ (12.0 µg/mL) in spiked human plasma. C: CFX (4.0 µg/mL), LEV(5.0 µg/mL) in spiked human plasma
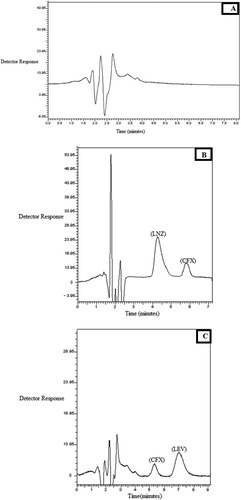
Table 9. Results for the analysis of studied drugs in their prepared tablets and capsules by the proposed and comparison methods.
3.2. Applications
3.2.1. Assay of laboratory prepared tablets and capsules
The developed method was used to estimate CFX with LNZ (mixture I) and CFX with LEV (mixture II) in their tablets, or NX with DV in their laboratory prepared capsules. The results presented in Table indicate a good agreement with those by the previously reported methods [Citation4,Citation5,Citation19]. Well resolved peaks of the antibiotics binary mixtures in the extract of laboratory prepared tablets or capsules could be illustrated in Figure (A–C).
3.3.2. Analysis of spiked human plasma
The proposed method was extended to estimate drugs of mixtures Ι (Figure B) and ΙΙ (Figure C) in spiked human plasma with corresponding final concentrations of (1.0–5.0 µg/mL) and (0.5–50.0 µg/mL) for CFX and LNZ respectively in mixture I, and (0.25–8.0 µg/mL) and (0.25–12.0 µg/mL) for CFX and LEV respectively in mixture ΙΙ. The analyses were carried out without performing any tedious time consuming extraction procedures, which is superior to traditional methods that result in lower % recoveries. The results are presented in Table . However, drugs in mixture ΙΙΙ were not estimated in plasma, as NX is poorly absorbed from the gastro intestinal tract [Citation2,Citation3] and consequently does not reach the systemic circulation acting as a local intestinal antiseptic.
Table 10. Assay results for the determination of the studied drugs in spiked human plasma using the proposed methods.
4. Conclusion
The proposed method succeeded to estimate three binary antibiotics mixtures namely; CFX in its combined tablets with LNZ (mixture Ι) or LEV (mixture ΙΙ), and NX in its capsules with DV. Separation of the binary mixtures in a reasonable time with good resolution was attained. The proposed method also permitted the quantitation of the concerned analytes in both their pure form and in their laboratory prepared dosage forms. Furthermore, estimation of the drugs in mixtures Ι and ΙΙ in spiked human plasma without prior extraction procedures was carried out. Such applications could be easily utilized to follow the concentration of the studied drugs in vitro to control any suspected toxicity that may outcome from administering them in combination, which was the major motivation for designing this study. The proposed method was found to be simple, sensitive, accurate and precise, so that it can be applied in quality control laboratories.
Disclosure statement
No potential conflict of interest was reported by the author(s).
References
- Sweetman SC. Martindale: the complete drug reference. UK: Pharmaceutical Press; 2009.
- Brunton LL. Goodman and Gilman's: the pharmacological basis of therapeutics. Twelfth Edition. Mc-Grow Hill (CA): Vastavikta Sharma and Cenveo publisher services; 2011.
- Rang HP, Ritter JM, Flower RJ, et al. Rang and Dale's pharmacology. Eighth Edition Livingstone: Elsevier; 2014.
- Shah V, Sen DB, Sen A, et al. Devolpment and validation of UV spectroscopic and chromatographic method for simultaneous estimation of cefixime and linezolide in their combined dosage form. Pharm Sci Mont. 2016;7:1–20.
- Dhandhukiya VR, Tiwari PS, Godavariya VD. Development and validation of RP HPLC method for the simultaneous estimation of levofloxacin hemihydrate and cefixime trihydrate in marketed formulation. Int Res J Pharm. 2013;4:81–83. doi: 10.7897/2230-8407.04618
- Khan A, Iqbal Z, Khan M I, et al. Simultaneous determination of cefdinir and cefixime in human plasma by RP-HPLC/UV detection method: method development, optimization, validation, and its application to a pharmacokinetic study. J Chromatogr B. 2011;879:2423–2429. doi: 10.1016/j.jchromb.2011.06.040
- Adam EH, Saeed AE, Barakat IE. Development and validation of a high performance liquid chromatography method for determination of cefixime trihydrate and its degradation products formed under stress condition of UV light. Int J Pharm Sci Res. 2012;3:469–473.
- Patel NS, Tandel FB, Patel YD, et al. Development and validation of stability-indicating HPLC method for simultaneous estimation of cefixime and linezolid. Indian J Pharm Sci. 2014;76:535–540.
- Khandagle KS, Gandhi SV, Deshpande PB, et al. A simple and sensitive RP-HPLC method for simultaneous estimation of cefixime and ofloxacin in combined tablet dosage form. Int J Pharm Pharm Sci. 2011;3:46–48.
- Talebpour Z, Pourabdollahi H, Rafati H, et al. Determination of cefixime by a validated stability-indicating HPLC method and identification of its related substances by LC-MS/MS studies. Sci Pharmaceut. 2013;81:493–503.
- Prashanthi J, Sundar S. A validated RP-HPLC method for the determination of linezolid in pharmaceutical dosage forms. Int J Pharm Biol Sci. 2012;3:44–51.
- Cios A, Kuś K, Szymura-Oleksiak J. Determination of linezolid in human serum by reversed-phase high-performance liquid chromatography with ultraviolet and diode array detection. Acta Pol Pharm. 2013;70:631–641.
- Vlase L, Muntean D, Cuciureanu M, et al. High-throughput determination of linezolid in human plasma by liquid chromatography-tandem mass spectrometry. J Liq Chromatogr Rel Tech. 2011;34:591–600. doi: 10.1080/10826076.2010.535480
- Sousa J, Alves G, Campos G, et al. First liquid chromatography method for the simultaneous determination of levofloxacin, pazufloxacin, gatifloxacin, moxifloxacin and trovafloxacin in human plasma. J Chromatogr B. 2013;930:104–111. doi: 10.1016/j.jchromb.2013.04.036
- Belal FF, El-Din MKS, El-Enany NM, et al. Micellar liquid chromatographic method for the simultaneous determination of levofloxacin and ambroxol in combined tablets: application to biological fluids. Chem Cent J. 2013;7:1–14. doi: 10.1186/1752-153X-7-162
- Maher HM, Belal TS. HPLC-DAD stability indicating determination of the fixed dose combination of nifuroxazide and drotaverine hydrochloride in capsules. J Liq Chromatogr Rel Tech. 2012;35:2001–2020. doi: 10.1080/10826076.2011.627617
- El-Gindy A, Emara S, Shaaban H. Validation and application of chemometrics-assisted spectrophotometry and liquid chromatography for simultaneous determination of two ternary mixtures containing drotaverine hydrochloride. J AOAC Int. 2010;93:536–548. doi: 10.1093/jaoac/93.2.536
- Issa YM, Hassouna ME, Zayed AG. Simultaneous determination of paracetamol, caffeine, domperidone, ergotamine tartrate, propyphenazone, and drotaverine HCL by high performance liquid chromatography. J Liq Chromatogr Rel Tech. 2012;35:2148–2161. doi: 10.1080/10826076.2011.629387
- Metwally FH, Abdelkawy M, Naguib IA. Determination of nifuroxazide and drotaverine hydrochloride in pharmaceutical preparations by three independent analytical methods. J AOAC Int. 2006;89:78–87. doi: 10.1093/jaoac/89.1.78
- Schulte S, Ackermann T, Bertram N, et al. Determination of the newer quinolones levofloxacin and moxifloxacin in plasma by high-performance liquid chromatography with fluorescence detection. J Chromatogr Sci. 2006;44:205–208. doi: 10.1093/chromsci/44.4.205
- Pawar SJ, Kale AP, Amrutkar MP, et al. HPTLC estimation of cefixime and cloxacillin in tablet dosage form. Asian J Res Chem. 2010;3:299–301.
- Rao J, Sethy K, Yadav S. Validated HPTLC method for simultaneous quantitation of cefixime and ofloxacin in bulk drug and in pharmaceutical formulation. Int J Compr Pharm. 2011;2:1–4.
- Alnajjar A O. Simultaneous determination of ofloxacin and cefexime in tablet formulation using capillary electrophoresis. J Liq Chromatogr Rel Tech. 2013;36:2687–2697. doi: 10.1080/10826076.2012.725691
- Michalska K, Pajchel G, Tyski S. Determination of linezolid and its achiral impurities using sweeping preconcentration by micellar capillary electrophoresis. J Pharm Biomed Anal. 2008;48:321–330. doi: 10.1016/j.jpba.2008.01.025
- Michalska K, Pajchel G, Tyski S. Determination of enantiomeric impurity of linezolid by capillary electrophoresis using heptakis-(2,3-diacetyl-6-sulfato)-beta-cyclodextrin. J Chromatogr A. 2007;1180:179–186. doi: 10.1016/j.chroma.2007.11.110
- Liu YM, Cao JT, Tian W, et al. Determination of levofloxacin and norfloxacin by capillary electrophoresis with electrochemiluminescence detection and applications in human urine. Electrophoresis. 2008;29:3207–3212. doi: 10.1002/elps.200800048
- Guiochon G. Monolithic columns in high-performance liquid chromatography. J Chromatogr A. 2007;1168:101–168. doi: 10.1016/j.chroma.2007.05.090
- Al-Othman ZA, Al-Warthan A, Ali I. Advances in enantiomeric resolution on monolithic chiral stationary phases in liquid chromatography and electrochromatography. J Sep Sci. 2014;37:1033–1057. doi: 10.1002/jssc.201301326
- Ali I, Al-Othman ZA, Al-Warthan A, et al. Advances in chiral separations of small peptides by capillary electrophoresis and chromatography. J Sep Sci. 2014;37:2447–2466. doi: 10.1002/jssc.201400587
- Ali I, Singh P, Aboul-Enein HY, et al. Chiral analysis of ibuprofen residues in water and sediment. Anal Lett. 2009;42:1747–1760. doi: 10.1080/00032710903060768
- Aboul-Enein HY, Ali I. HPLC enantiomeric resolution of nebivolol on normal and reversed amylose based chiral phases. Pharmazie. 2001b;56:214–216.
- Aboul-Enein HY, Ali I. Studies on the effect of alcohols on the chiral discrimination mechanisms of amylose stationary phase on the enantioseparation of nebivolol by HPLC. J Biochem Biophys Methods. 2001;48:175–188. doi: 10.1016/S0165-022X(01)00148-8
- Ali I, Naim L, Ghanem A, et al. Chiral separations of piperidine-2,6-dione analogues on Chiralpak IA and Chiralpak IB columns by using HPLC. Talanta. 2006;69:1013–1017. doi: 10.1016/j.talanta.2005.12.004
- Aboul-Enein HY, Ali I. Optimization strategies for HPLC enantioseparation of racemic drugs using polysaccharides and macrocyclic glycopeptide antibiotic chiral stationary phases. Il Farmaco. 2002;57:513–529. doi: 10.1016/S0014-827X(02)01242-9
- Lough WJ, Wainer IW. High performance liquid chromatography: fundamental principles and practice. Florida, USA: CRC Press; 1995.
- Belal FF, Sharaf El-Din MK, El-Enany NM, et al. Micellar liquid chromatographic method for the simultaneous determination of levofloxacin and ambroxol in combined tablets: application to biological fluids. Chem Cent J. 2013;7:162–176. doi: 10.1186/1752-153X-7-162
- Beale JM, Block JH. Organic medicinal and pharmaceutical chemistry, Twelfth Edition. London: Wolters Kluwer, Lippincott Williams & Wilkins; 2010.
- ICH Harmonized Tripartite Guideline, Validation of Analytical Procedures: Text and Methodology, Q2 (R1), Current Step 4 Version, Parent Guidelines on Methodology Dated November 6 1996, Incorporated in November. [cited 2016 April 8]. available at http://www.fda.gov/downloads/Regulator%20yInformation/Guidances/>UCM128049.pdf.
- Miller JN, Miller JC. Statistics and chemometrics for analytical chemistry. New Jersy, USA: Prentice Hall/Pearson; 2010.