
 ?Mathematical formulae have been encoded as MathML and are displayed in this HTML version using MathJax in order to improve their display. Uncheck the box to turn MathJax off. This feature requires Javascript. Click on a formula to zoom.
Abstract
Chitosan (CS) was used as a powerful chelating agent and an excellent template for synthesis of metal oxide nanoparticles (NPs). The CS-MgO nanocomposite film was prepared by adding 10%wt of MgO relative to CS and was characterized by different techniques. From the FTIR, some of the main characteristic peaks of CS were shifted due to the interaction with MgO especially with OH and NH2 groups. Also, SEM graphs showed a clear change in the morphological surface of CS. Moreover, XRD pattern shows an improvement in the crystallinity due to incorporation of MgO NPs. The dielectric and optical properties of the nanocomposite film were studied. Moreover, the effect of temperature on the dielectric properties of the hybrid film was studied. The absorption and transmittance were measured for the prepared samples by using UV–VIS spectrophotometer. The optical parameters such as refractive index, absorption coefficient and energy band gap for the CS-MgO nanocomposite were calculated and compared with the pure CS film only.
1. Introduction
Natural polysaccharides often used as ideal stabilizing agents, have the requirements for low cost and renewable raw materials [Citation1]. Nowadays, most of the researchers have been invented a lot of hybrid composite materials to gain new properties that fit many industrial applications [Citation2]. In the last few decades, a growing interest to invent and design metal ion polysaccharides complexes that have been utilized for many useful applications such as metal up take, water treatment, forming novel catalysts, dyeing processes and many other industrial applications [Citation3].
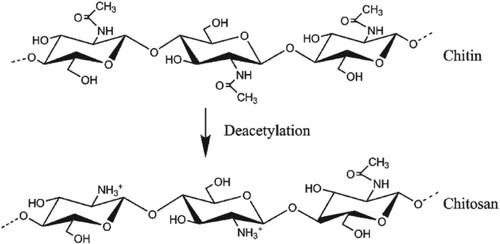
Chitosan (CS) is an alkaline polysaccharide that is prepared through partial hydrolysis of chitin, the main component in the shells of crustacean and fungi walls. CS has been intensively studied due to its excellent biodegradability, biocompatibility, low toxicity and film-forming property [Citation4]. It contains hydroxyl and amino functional groups which play an important role in the chemical adsorption of the metal ions [Citation5]. CS and its derivatives, rather than any other polysaccharides, are considered as a powerful template for the preparation of metal oxide nanoparticles (NPs) owing to its unique ability to combine with metal ions via the hydroxyl and amino groups (Figure ) [Citation6–10].
Figure 1. Structures of chitosan and chitin.
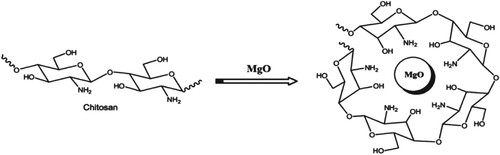
During the last few years, numerous studies on NPs have involved much attention due to their wide use in vast applications such as biological, electronic, energy, environmental and catalytic applications. Magnesium oxide, periclase, is white and hygroscopic solid material. Recently, sol–gel [Citation11] or hydrothermal [Citation12] techniques could be widely used for the production of different nanosized magnesium oxides. It is known that, magnesium oxide (MgO) is a very promising nominee for insulation applications because of its low heat capacity and high melting point [Citation13]. Moreover, MgO nanoparticles have a promising electrical, chemical, thermal and optical properties that has attracted the attention of many scientists to synthesize and to explore the potential applications [Citation14]. For the above reasons, in this study, we have synthesized CS-MgO nanocomposite film via a simple casting method and investigated its optical and dielectric properties (Figure ). The calculation of dielectric constant and loss and its relationship to frequency and temperature enhances the understanding of the polarization method, conduction process, optical properties, effect of impurities and phase change [Citation15–21].
Figure 2. Conversion of chitosan to chitosan-MgO (10%wt) nanocomposite.
As well as the AC conductivity, which can be obtained from the insulation properties combined with the DC conductivity, it is used to produce useful information about the properties of defects and the nature of the conductivity in the material.
2. Experimental
2.1. Materials and methods
CS (powder, shrimp shells, product no. C3646, density = 0.15–0.3 g/cm3) and MgO (nanopowder <50 nm particle size BET, product no. 549649) were purchased from Sigma-Aldrich company. The Fourier-Transform infrared (FTIR) spectra of nanocomposite were recorded on a Pye-Unicam SP300 Instrument (Cambridge, UK) in potassium bromide discs. Field emission scanning electron microscope (FESEM) analyses were measured on a high-resolution scanning electron microscope (model HRSEM, JSM 6510A, Jeol, Tokyo, Japan). X-ray diffraction (XRD) measurement was carried out on Philips Diffractometer (Model: X’Pert-Pro MPD; Philips, Eindhoven, Netherlands).
2.2. Preparation of CS-MgO nanocomposite film
Firstly, CS solution was prepared by dissolving 1 g CS in 100 mL of 1% (w/v) aqueous acetic acid solution under stirring overnight. The formed viscous solution was filtered and 10 (w/v%) of MgO was added portion-wise under vigorous stirring and the stirring was continued for 24 h. From the resulting solution, 20 g was poured into Teflon petri-dish (8 cm) and dried at 50°C for 3 days in a vacuum oven to get rid of the solvent. CS-MgO nanocomposite film was peeled off from the petri-dish after treatment with 5 mL of 1 M NaOH (to neutralize the residual acetic acid) and then was rinsed with distilled water. Finally, the produced film was kept inside a vacuum desiccator at room temperature for 2 days.
2.3. Measuring dielectric properties
We used “Solartron Frequency and Analytical Response analyzer” instrument for measuring the impedance spectra associated with our samples that were in the form of circular pellets, ∼ 1 mm thick and ∼ 0.5 cm in radius. The pellets were connected in series with a small 47 Ω resistor to stabilize the signal. The measurement frequency range was f = 0.1 kHz – 300 kHz at an AC amplitude of 0.3 V and zero DC voltage.
We used copper tapes as the electrodes that were fixed at the pellet with a thin layer of adhesive (with a negligible contribution to the impedance) to avoid using a conducting paste (available to us was a silver paste) that would diffuse into the sample, resulting into an unwanted signal in the impedance spectrum.
2.4. Measuring optical properties
The optical spectroscopic analyses of the prepared samples have been carried out by using UV-visible-near IR spectroscopy over the wavelength range of (350–3000 nm).
3. Results and discussion
3.1. Characterization of CS-MgO nanocomposite film
3.1.1. FTIR spectra
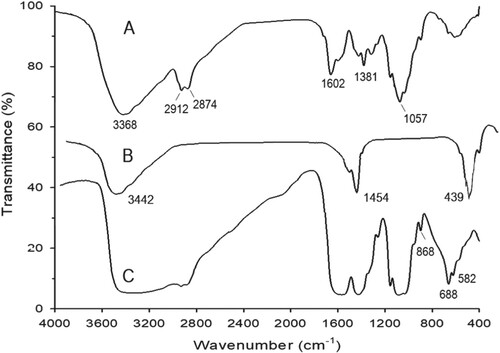
As shown in the FTIR spectra (Figure (A–C)) of CS, MgO and CS-MgO nanocomposite showed that the main functional groups of CS clearly appeared at υ = 3368 cm−1 (broadband of OH– group), 2912, 2874 cm−1 (C–H bond; CH3 groups), 1602 cm−1 (amide carbonyl groups), 1381 cm−1 (bending vibration of CH2 groups) and 1057 cm−1 (asym. vibration of C = O) (Figure (A)). Also, Figure (B) showed the presence of the characteristic bands of MgO molecules at 1454 and 439 cm−1. These bands confirmed the combination of the CS structure features with the MgO nanoparticles inside the hybrid nanocomposite (Figure (C)). In addition, reasonable shift in the CS and MgO bands in the nanocomposite spectrum was shown which is explained by the interaction between MgO nanoparticles and the OH and NH2 groups of CS. This band shift was familiar and previously reported as a result of CS with metal oxides [Citation22].
Figure 3. FTIR of chitosan (A), MgO nanoparticles (B), and the chitosan-MgO nanocomposite (C).
3.1.2. FESEM analysis
FESEM was used to identify the presence of MgO NPs within the polymer matrix by studying the morphological changes in the surface and monitoring the distribution of MgO NPs throughout Figure (A–C).
Figure 4. FESEM images of chitosan (A), MgO nanoparticles (B), and the chitosan-MgO nanocomposite (C).
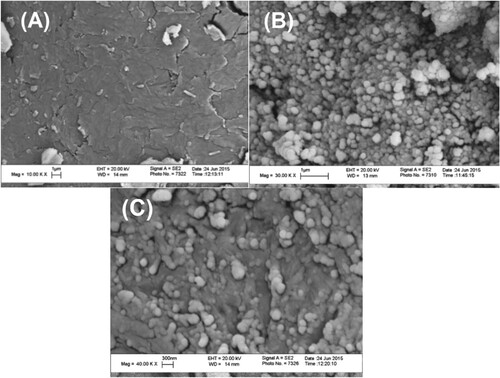
The micrographs of the pure CS (Figure (A)), MgO NPs (Figure (B)) and that of the hybrid films with magnesia particles 10 wt% (Figure (C)) are shown. There is a clear and obvious morphological change between the surface of the native CS which is homogenous and smooth to a great extent as compared to the hybrid CS-MgO nanocomposite. The MgO NPs were uniformly distributed as bright spots over the whole surface of the polymer matrix which is greatly similar to the image of MgO NPs (Figure (B)). The average size of MgO particles was found to be approximately 15–20 nm for 10 wt%.
3.1.3. X-ray diffraction
XRD patterns of the blank CS and the CS-MgO (10 wt%) thin-film nanocomposite were shown in Figure (A–B). The CS pattern (Figure (A)) shows only the characteristic sharp peak at 2Θ = 18° as reported in literature [Citation23]. For the CS-MgO nanocomposite pattern (Figure (B)), clear additional peaks at 42°,49°and 60°that indicates the presence of MgO.
Figure 5. XRD patterns of chitosan (A), and the chitosan-MgO nanocomposite (10 wt%) (B).
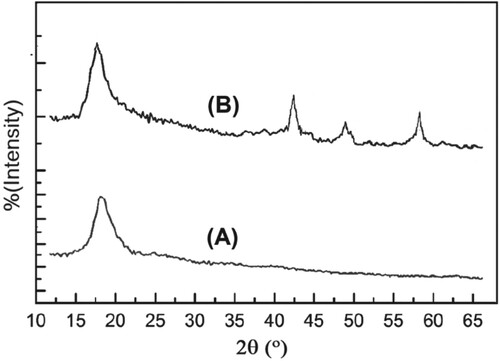
It is clear that, in agreement with the results that have reported previously [Citation23], there is no marked change in the characteristic peak of CS by interaction with MgO particles. Thus, the interaction between MgO NPs and the CS structure has no significant changes on the crystallinity of the native CS.
3.2. Dielectric properties of CS-MgO nanocomposite
Figure (A) shows the conductivity as a function of the frequency for the temperatures from 25°C to 110°C. The conductivity was calculated from the magnitudes of the real, Z′, and imaginary, Z″, parts of the impedance and the sample geometry. It is also possible to fit the Z′ vs. Z″ Nyquist plot to a circuit model to extract information pertinent to the conductivity; however, for simplicity, we postpone this to future work. The sharp increase of the conductivity at high frequencies indicates the power-law dependence of the conductivity on the frequency which may suggest variable range hopping conduction mechanism between Mg sites in CS [Citation24].
Figure 6. (A) The conductivity, σ, of CS-MgO sample as a function of the frequency for the temperatures from 25°C to 110°C. (B) The variation σ with the reciprocal of the temperature (1000/T) at f = 300 kHz.
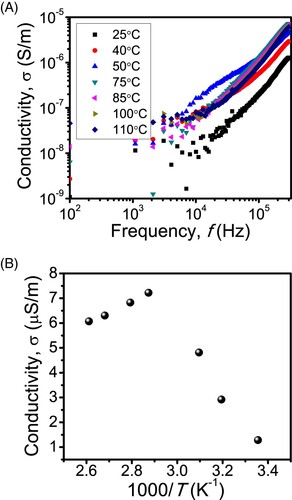
The conductivity may thus follow the following power-law relation: [Citation15,Citation25–27]
(1)
(1) where σDC is the DC conductivity,
is the angular frequency (
) at which σ = 2 σDC and the exponent n
1 for mixture of translation and hopping conduction, and n > 1 for localized variable range hopping between the sites. [Citation28] Our fitting to the curves in Figure (A) using Equation (1) shows that n > 1 for all temperatures. However, the log
vs 1000/T (Figure ) does not show the expected linear reduction of log
with decreasing T. In other words,
may not follow the exponential temperature dependence common in materials that exhibit variable hopping conduction between impeded sites.
Figure 7. The dependence of ωp (the angular frequency (ω = ) at which
= 2
) on reciprocal of temperature, T.
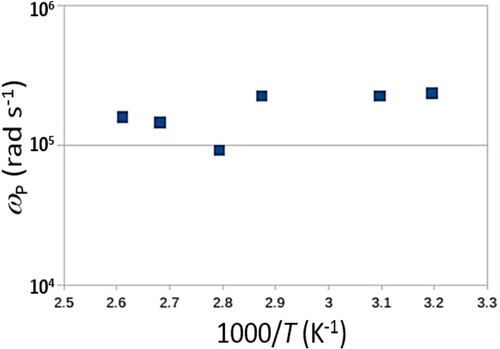
Figure (B) shows the Arrhenius plot of σ versus the reciprocal of the temperature (1000/T) at f = 300 kHz, where, interestingly, we observe two slopes corresponding to negative and positive activation energies at, respectively, low- and high-temperature ranges. The former activation energy is associated with spontaneous carrier transport at low temperatures, while the later may arise from a reduction in the carrier concentration giving rise to electric-field stimulated carrier transport at high temperatures.
Figures (A–C) are, respectively, the dielectric constant (΢), imaginary dielectric and dielectric loss (tan δ = ∈′/∈′) of the material as a function of the frequency (f) with the temperature as a parameter. Clearly, the variation of conductivity (Figure (A)) with temperature conforms to the plots of ϵ′ with frequency, which is more obvious at low frequencies. For example, the overall ϵ′ and σ values increase with increasing temperature specifically at low-temperature range. No relaxation peaks, as an indication of Debye relaxation of charge polarization within the material, are observed in the tan δ vs. f or ∈′ vs. f behaviours. Instead ΢ and tan δ sharply increased as f reduces within the low-frequency range, suggesting polarization and space charge formation at the sample-electrode interface. Since this is a relatively large area interface, it has a large capacitance and hence a relatively large time constant for the polarization process of charges within the interface caused by the AC signal. Thus, those charges cannot follow the electric field oscillation at a high frequency where processes with smaller time constants would emerge.
Figure 8. (A) The dielectric constant (∈′), (B) imaginary dielectric constant (∈′), (C) and the dielectric loss (tan δ = ∈′/∈′) of the material as a function of the frequency (f) with the temperature as a parameter.
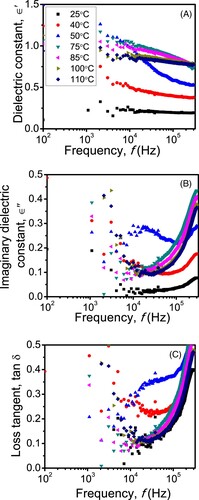
The observed increase in ∈′ and tan δ with the temperature (Figure ) may be associated with the formation of free ions or charge carries due, for instance, to the ionic dissociation of the material’s ionic composition. The degree of ionic conductivity can further be assessed from the electric modulus studies [Citation29,Citation30] as shown in Figure (A,B).
Figure 9. (A) The real (M′) and (B) imaginary (M″) moduli for the sample versus the frequency (f) at various temperatures.
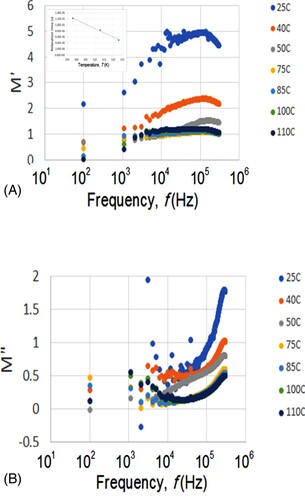
They showed the real (M′) and imaginary (M″) moduli versus the frequency (f) at various temperatures. They were calculated from M′ = ∈′/(∈′2+∈″ 2) and M″ = ∈′/(∈′2+∈″ 2). For example, for f = 300 kHz and T = 110°C in Figure (A,B), we have ∈′ = 0.779 and ∈′ = 0.366, giving rise to M′ = 1.04 and M″ = 0.494 as shown in Figure (A,B). Both M′ and M″ increase with increasing frequency. For example, M′ exhibits peaks within the high-frequency range, suggesting the existence of ionic conduction. These peaks shift towards higher frequency as the temperature increases. This is illustrated in the inset of Figure (A) for the relaxation time (reciprocal of peak frequency) as a function of the temperature for the frequency ranges where the peaks are visible in M′.
3.3. Optical properties of CS-MgO nanocomposite
Figure shows the wavelength dependence of the absorption spectra for the CS and CS-MgO NPs samples used where the absorption increases by mixing MgO NPs within the CS.
Figure 10. The optical absorbance spectra of CS and Cs-MgO samples.
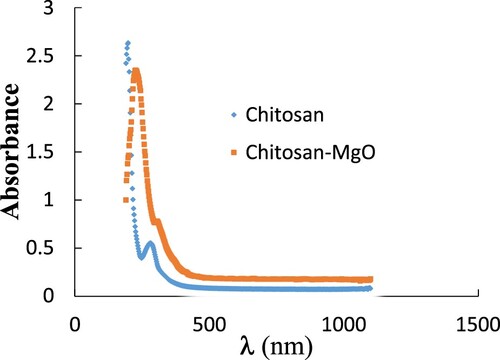
The maximum absorption wavelength λm for the CS appears at 270 nm with the maximum absorption 0.50, while for the CS-MgO film λm = 225 nm at maximum absorption 2.35 which exhibits a higher absorption than that of the pure CS film and attributed to the π-π*-transitions [Citation31].
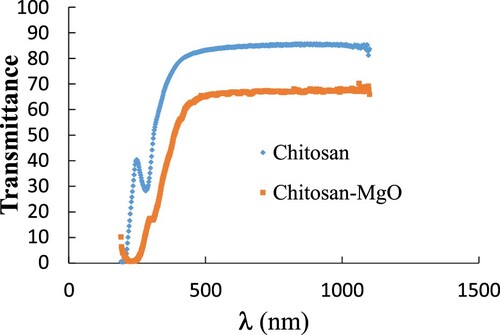
Also, Figure shows the wavelength dependence of the transmission spectra of the CS and Cs-MgO NPs used. It was shown that at wavelengths longer than 350 nm CS becomes highly transparent more than 85%, while CS-MgO become highly transparent more than 60% with small redshift. This decreasing in the transmission of CS-MgO film may be arising from the observed increase in the crystallization of the sample. It was reported that the UV-shielding ability of MgO NPs significantly decreased the UV transmission through the CS-MgO film which means that the UV protection for the CS was improved by blend MgO nanoparticles [Citation32].
Figure 11. The optical transmittance spectra of CS and Cs-MgO samples.
3.3.1. Energy bandgap
The absorption coefficient can be used to determine the optical energy bandgap of the materials where the absorption coefficient (α) can be calculated by using [Citation33]:
(2)
(2) where A is the absorbance and t is the sample thickness used. The energy bandgap Eg was measured by using the absorption coefficient α as the following equation [Citation34–36]:
(3)
(3) where h is the Planck’s constant, ν is the frequency of the incident light, B is a constant and n is an index which can be assumed to have values of 1/2, 3/2, 2 and 3, depending on the nature of the electronic transition responsible for the absorption.
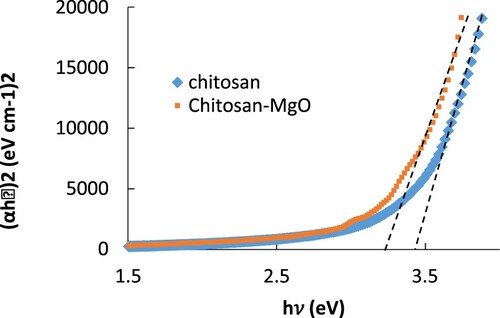
It was found that the best fit was obtained when n is equal to 2 which represent the process of allowed indirect transition. From Equation (3), the optical energy gap Eg of CS and CS-MgO samples can be obtained as shown in Figure , by plotting relation of (αhν)2 with photon energy (hν). The extrapolation of the straight-line portion of the energy axis (hν) gives the energy band gaps for the samples. From Figure , the energy bandgaps were equal to 3.7 and 3.4 eV for pure CS and CS-MgO films, respectively. It was observed that the values of Eg decrease by blending MgO NPs with CS which can be used in many applications such as solar energy and organic photovoltaic after adding MgO NPs.
Figure 12. The plot of (αhν)2 versus photon energy (hν) of CS and Cs-MgO samples.
3.3.2. Refractive index measurement
Refractive index plays an important role in the material science and various optical technologies. Refractive index can be measured by knowing transmittance and reflectance of the materials by using UV–VIS spectrophotometer. At normal incidence, the transmittance T is related to index of refraction by the Fresnel Equations as follows [Citation37]:
(4)
(4) where n is the refractive index of the sample and ni is the refractive index of the medium (ni = 1 for air) then:
(5)
(5) The solving of this equation leads to [Citation38]:
(6)
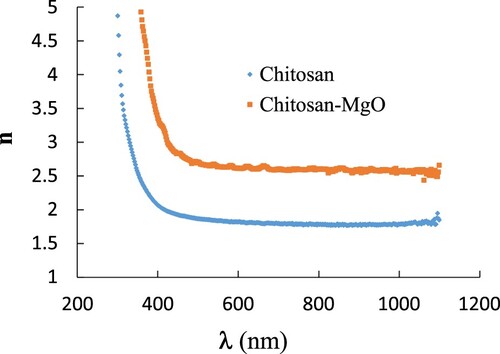
(6) By using Equation (6), the values of refractive index were obtained for the samples used. Figure shows the dispersion relation between the refractive index and wavelength for pure CS and CS-MgO NPs sample. As shown in Figure , a noticeable change in the refractive index was occurred due to the doped MgO NPs for CS where the refractive index increases for CS-MgO film. The doping of MgO NPs through the CS host makes the sample denser in nature and changes in the crystallinity and internal microstructure of the material which leads to high refractive index according to Lorentz–Lorenz formula [Citation39,Citation40]. The high refractive index of CS-MgO film can be qualifying it to use in optoelectronic equipment such as waveguides and light-emitting diodes [Citation41].
Figure 13: The refractive index dispersion with wavelengths for CS and CS-MgO films.
4. Conclusion
CS-MgO nanocomposite film has been synthesized by incorporating MgO molecules within the CS matrix using a simple solution cast method. The chemical structure of the hybrid material was characterized by studying FTIR and SEM micrographs. Improvement in the crystallinity due to incorporation of MgO NPs has been verified from the XRD patterns. The temperature dependence of the dielectric properties of the nanocomposite film has indicated the presence of (thermally assisted) variable range hopping between Mg sites within the film. The optical properties of the hybrid film were also investigated. The optical properties of the hybrid film were also investigated. The transmission of CS-MgO film decreasing due to the observed increase in the crystallization and the UV protection for the CS was improved by blend MgO NPs. Also the value of energy bandgap decreases by blending MgO NPs within CS material which can be used in many optical applications. In addition to that, the values of refractive index were increased noticeably for CS-MgO nanocomposite than the pure CS film as a result of the changes in the crystallinity and internal microstructure occurs.
Acknowledgements
Both Dr Khaled Khalil and Dr Ali Habib suggested the plan of the article. Dr Khaled Khalil prepared the nanocomposite film and both of them interpreted the analysis and characterization part. Dr Mohammed Khalafalla measured and explained the dielectric properties. Dr Ayman Zaki measured the optical properties and explained the obtained data.
Disclosure statement
This work has no conflict of interest with other works.
References
- Vilela C, Pinto RJB, Pinto S, et al. Polysaccharides-Based Hybrids with Metal Nanoparticles. In Polysaccharide Based Hybrid Materials (pp. 9-30). Springer, Cham. 2018. p. 9–30. doi:10.1007/978-3-030-00347-0_2.
- Kickelbick Guido. Concepts for the incorporation of inorganic building blocks into organic polymers on a nanoscale. Progress in polymer science. 2003;28(1):83–114. doi:10.1016/s0079-6700(02)00019-9.
- Xu T. Ion exchange membranes: state of their development and perspective. J Memb Sci. 2005;263(1-2):1–29. doi:10.1016/j.memsci.2005.05.002.
- Dash M, Chiellini F, Ottenbrite RM, et al. Chitosan – a versatile semi-synthetic polymer in biomedical applications. Prog Polym Sci. 2011;36(8):981–1014. doi:10.1016/j.progpolymsci.2011.02.001.
- Varma AJ, Deshpande SV, Kennedy JF. Metal complexation by chitosan and its derivatives: a review. Carbohydr Polym. 2004;55(1):77–93. doi:10.1016/j.carbpol.2003.08.005.
- Yang D, Li J, Jiang Z, et al. Chitosan/TiO2 nanocomposite pervaporation membranes for ethanol dehydration. Chem Eng Sci. 2009;64(13):3130–3137. doi:10.1016/j.ces.2009.03.042.
- Khalil KD, Ibrahim EI, Al-Sagheer FA. A novel, efficient, and recyclable biocatalyst for Michael addition reactions and its iron(iii) complex as promoter for alkyl oxidation reactions. Catal Sci Technol. 2016;6(5):1410–1416. doi:10.1039/c5cy01034a.
- Khalil KD, Riyadh SM, Gomha SM, et al. Synthesis, characterization and application of copper oxide chitosan nanocomposite for green regioselective synthesis of [1,2,3] triazoles. Int. J. Biol. Macromol. 2019;130:928–937.
- Riyadh SM, Khalil KD, Bashal AH. Structural properties and catalytic activity of binary poly (vinyl alcohol)/Al2O3 nanocomposite film for synthesis of thiazoles. Catalysts. 2020;10(1):100, doi:10.3390/catal10010100.
- Riyadh SM, Khalil KD, Aljuhani A. Chitosan-MgO nanocomposite: one pot preparation and its utility as an ecofriendly biocatalyst in the synthesis of thiazoles and [1,3,4]thiadiazoles. Nanomaterials. 2018;8:928, doi:10.3390/nano8110928.
- Wang JA, Novaro O, Bokhimi X, et al. Structural defects and acidic and basic sites in sol-gel MgO. J Phys Chem B. 1997;101:7448–7451.
- Ding Y, Zhang G, Wu H, et al. Nanoscale magnesium hydroxide and magnesium oxide powders: Control over size, shape, and structure via hydrothermal synthesis. Chem. Mater. 2001;13:435–440.
- Shukla SK, Parashar GK, Mishra AP, et al. Nano-like magnesium oxide films and its significance in optical fiber humidity sensor. Sensors Actuat B Chem. 2004;98(5).
- Ho I-C, Xu Y, Mackenzie JD. Electrical and optical properties of MgO thin film prepared by sol-gel technique. J Solgel Sci Technol. 1997;9(3):295–301. doi:10.1007/bf02437193.
- Polat O, Coskun M, Coskun FM, et al. Influence of transition element Os substitution on the structural and electrical features of perovskite structure LaCr1- xOsxO3. Mater Res Bull. 2020;124:110759–110777.
- Coskun M, Polat O, Coskun FM, et al. The impact of Ir doping on the electrical properties of YbFe 1- x Ir x O 3 perovskite-oxide compounds. J Mater Sci: Mater Electron. 2020;31(2):1731–1744.
- Polat O, Durmus Z, Coskun FM, et al. Engineering the band gap of LaCrO 3 doping with transition metals (Co, Pd, and Ir). J Mater Sci. 2018;53(5):3544–3556.
- Polat O, Coskun FM, Coskun M, et al. Tailoring the band gap of ferroelectric YMnO 3 through tuning the Os doping level. J Mater Sci: Mater Electron. 2019;30(4):3443–3451.
- Polat O, Coskun M, Coskun FM, et al. Electrical characterization of Ir doped rare-earth orthoferrite YbFeO3. J Alloys Compd. 2019;787:1212–1224.
- Polata O, Caglar M, Coskun FM, et al. An experimental investigation: The impact of cobalt doping on optical properties of YbFeO3-? thin film. Mater Res Bull. 2019;119:110567–75.
- Polat O, Caglar M, Coskun FM, et al. Examination of optical properties of YbFeO3 films via doping transition element osmium. Opt Mater (Amst). 2020;105:109911.
- De Silva RT, Mantilaka MMMGPG, Ratnayake SP, et al. Nano-MgO reinforced chitosan nanocomposites for high performance packaging applications with improved mechanical, thermal and barrier properties. Carbohydr Polym. 2017;157:739–747. doi:10.1016/j.carbpol.2016.10.038.
- Praffulla SR, Bubbly SG. (2018). Synthesis and characterization of Chitosan-CuO-MgO polymer nanocomposites. doi:10.1063/1.5032503.
- El Kadib A, Primo A, Molvinger K, et al. Nanosized vanadium, tungsten and molybdenum oxide clusters grown in porous chitosan microspheres as promising hybrid materials for selective alcohol oxidation. Chem Eur J 2011;17(28):7940–7946.
- Jonscher AK. Dielectric relaxation in solids. J Phys Appl Phys 1999;32(14):R57.
- Khiar A, Puteh R, Arof A. Conductivity studies of a chitosan-based polymer electrolyte. Phys B Condens Matter. 2006;373(1):23–27.
- Jonscher A, AK J. “The universal dielectric response: A review of data and their new interpretation,” 1980.
- Hill R. Variable-range hopping. Phys Status Solidi A. 1976;34(2):601–613.
- Tian F, Ohki Y. Electric modulus powerful tool for analyzing dielectric behavior. IEEE Trans Dielectr Electr Insul. 2014;21(3):929–931.
- Coşkun M, Polat Ö, Coşkun FM, et al. The electrical modulus and other dielectric properties by the impedance spectroscopy of LaCrO 3 and LaCr 0.90 Ir 0.10 O 3 perovskites. RSC Adv 2018;8(9):4634–4648.
- Gh M, Sayed AM E, Morsi WM. Pectroscopic, thermal, and electrical properties of MgO/polyvinyl pyrrolidone/ polyvinyl alcohol nanocomposites. J Phys Chem Solids. 2018;115:238–247.
- De Silva RT, Mantilaka MMMGPG, Ratnayake SP, et al. Nano-MgO reinforced chitosan nanocomposites for high performance packaging applications with improved mechanical, thermal and barrier properties. Carbohydr Polym. 2017;157:739–747.
- Khan SA, Lal JK, Al-Ghamdi AA. Thermal annealing effect of on optical constants of vacuum evaporated Se75S25-xCdx chalcogenide thin films. Opt Laser Technol. 2010;42:839.
- Tauc J, Grigorovici R, Vencu A. Optical properties and electronic structure of amorphous germanium. Phys Status Solidi B. 1996;15:627–637.
- El-Menyawy EM, Darwish AAA, Zedan IT. Impact of annealing on the structural and optical properties of methylene green nanostructure films prepared by drop casting. Opt. Laser Technol. 2016;79:158–163.
- Bhattacharyya D, Chaudhuri S, Pal AK. Band gap and optical transitions in thin films from reflectance measurements. Vacuum. 1992;43:313–316.
- Eugene H. Optics. 4th ed. San Francisco (CO): Adelphi University; 2002, pp. 113.
- Zaki AA, Hagar M, Radwan NRE. Synthesis and optical properties of new alkylated pyridinium halides. Optik (Stuttg). 2017;139:95–103.
- Abdullah OG, Aziz SB, Omer KM, et al. Reducing the optical band gap of polyvinyl alcohol (PVA) based nanocomposite. J Mater Sci. 2015;26:5303–5309.
- Urs TG, Gowtham GK, Nandaprakash MB, et al. Determination of force constant and refractive index of a semiconducting polymer composite using UV/visible spectroscopy: a new approach. Indian J Phys. 2017;91:53–56.
- Potzsch RT, Stahl BC, Komber H, et al. High refractive index polyvinylsulfide materials prepared by selective radical mono-addition thiol–yne chemistry. Polym Chem. 2014;5:2911–2921.