
Abstract
Attempts have been taken to study stress degradation of tiemonium methylsulphate (TMS). Quantum mechanical approach was applied to investigate the structural information, protein binding affinity and pharmacokinetic properties of the TMS and degradation products. Forced degradation study revealed that TMS degraded significantly under acid hydrolysis and photolytic degradation conditions than basic, thermal or oxidative conditions. Density functional theory (DFT) with B3LYP/6-31G+ (d, p) has been employed to optimize the structures. Frontier molecular orbital features (HOMO–LUMO) gap, hardness, softness), dipole moment, atomic partial charge, electrostatic potential and thermodynamic properties (electronic energy, enthalpy, Gibb's free energy) are investigated for optimization of degradation products. Molecular docking has been performed against muscarinic acetylcholine receptor protein 5DSG to search the binding affinity and mode(s). ADMET calculation predicts that all the products are non-carcinogenic and safe for oral administration.
GRAPHICAL ABSTRACT
1. Introduction
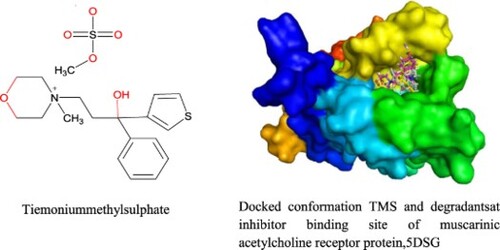
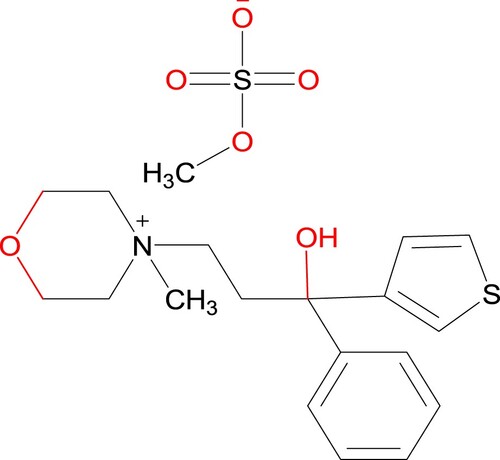
Tiemonium methylsulphate (TMS) 4-[3-Hydroxy-3-phenyl-3-(2-thienyl) propyl]−4-methyl morpholinium methylsulphate (Figure ) is quaternary ammonium antimuscarinic with peripheral effects similar to those of atropine and are used in the relief of visceral spasms. It reduces muscle spasms of the intestine, biliary system, uterus and urinary bladder. It is indicated for the pain in gastrointestinal and biliary disease in urology and gynaecology such as gastroenteritis, diarrhoea, dysentery, biliary colic, enterocolitis, cholecystytis, colonopathyes, mild cystitis and spasmodic dysmenorrhoea [Citation1]. It has been used as an antispasmodic [Citation2]. Detecting sensitivity prior to treatment still not available and during treatment even agranulocytosis development cannot be predicted. Immediately discontinue tiemonium perform emergency blood count in the event of appearance of fever and/or sore throat and/or mouth ulcers to avoid the risk of mortality. The patient will require urgent hospitalization due to adverse effects of over dose or abuse. The use of this drug is not recommended in pregnant women due to the risk of agranulocytosis related to noramidopyrine. Anticholinergic antispasmodics decrease milk secretion and diffuse into milk. Consequently, tiemonium is contraindicated in nursing mothers.
Figure 1. Structure of tiemonium methylsulphate.
However, forced degradation studies are used to facilitate the development of analytical methodology, to gain a better understanding of active pharmaceutical ingredient and drug product stability, and to provide information about degradation pathways and degradation products [Citation3]. The International Conference on Harmonization (ICH) guideline entitled “Stability testing of new drug substances and products” requires that Stress testing of the drug substance can help to identify the likely degradation products, which can in turn help to establish the degradation pathways and validate the stability-indicating power of the analytical procedures used (ICH, 2003) [Citation4]. Furthermore, the identification of the obtained degradation either in raw material or in pharmaceutical dosage forms without the interference of excipients and their degradation products makes the methods suitable for quality control analysis [Citation5].
Therefore, the present work attempts to study stress degradation of tiemonium methylsulphate identification and structural elucidation degradents. Again, the determination of thermochemical data on the basis of the “Optimization of drugs using quantum mechanical calculations” helps to predict the different thermodynamic energy and flexibility of compounds and its derivatives [Citation6]. In this study, free energy, electronic energy, enthalpy, dipole moment, electrostatic potential, HOMO–LUMO gap (Highest occupied molecular orbital–lowest unoccupied molecular orbital), hardness, softness, chemical potential and atomic partial charge have been investigated for TMS and its hydrolysis, photolysis, oxidative and thermal stressed products. Molecular docking and nonbonding calculation have been performed to understand the binding affinity, mode(s) and interaction between molecules and the amino acid residues of muscarinic acetylcholine receptor protein (5DSG). Some of the degradents show better chemical reactivity, binding affinity, nonbonding interactions and improved pharmacokinetic properties than the TMS.
2. Materials and methods
2.1. Instrumentation
A Shimadzu (Tokyo, Japan) binary low-pressure gradient system was used for the chromatographic determination of the examined analyte. Detection was achieved by an SPD-M20A Photodiode Array Detector, complied with Data acquisition software Lab Solutions-Nexera PDA by Shimadzu. The system was controlled and data were analysed, on a computer equipped with Lab solution software. The analytical column, a Kinetex, C18 (100 × 2.1 mm, 2.6 µm), was purchased from Phenomenex (Torrance, USA).
2.2. Materials
HPLC-grade methanol was supplied by SIGMA-ALDRICH (Germany), ACN was supplied by Scharlau (Scharlab S.L, Spain) and sodium dihydrogen phosphate was supplied by Applichem GmbH (Germany). Water used throughout the study was purified by the reverse osmosis method to gain high-purity water with a Milli-Q water purification system from Millipore (Millipore, Bedford, MA, USA). Purity of reference compounds was not less than 98%.
2.2.1. Preparation of standards
Stock solution of TMS was prepared at concentration level 100 ng µL−1 by dissolving an appropriate amount in methanol and was stored at 4°C, protected from light and used within 3 months. The stock solutions of drugs were further serially diluted daily before analysis with methanol to make interim mixture solutions (controlled solution) at concentrations of 0.50-10.00 ng µL−1 for the compound. Buffer: 5 mM aqueous solution of dihydrogen sodium phosphate buffer was prepared by mixing appropriate weight in Milli Q water and filtered before use.
2.2.2. Preparation of calibration curve
Calibration curves were prepared for seven concentration levels ranged from 0.50 to 10.0 ng µL−1 of the analyte. The calibration curve was constructed by plotting peak area against theoretical concentrations which were fitted by the least squares linear regression to the equation: response ratio (y) = slope (m) × concentration (x) + intercept (c). Unknown concentration of the analyte was determined with reference to the calibration equation.
2.2.3. Forced degradation study
Forced degradation study of the tiemonium methylsulphate was performed in the following conditions: acid hydrolysis (0.1N HCl, 1N HCl), basic hydrolysis (1N NaOH), heat (60–70°C for 1 h), photolytic (UV radiation), oxidation (3% hydrogen peroxide). Experiment was done according to the following procedure.
2.2.3.1. Acid hydrolysis
2.5 mL solution of standard tiemonium methylsulphate in 0.1N HCl or 1N HCl was transferred to 25 mL volumetric flask to gain a concentration of 10 µg mL−l and was shaken in an ultrasonic water bath for the period of 3 h at ambient temperature. During the ultrasonic shaking after one hour of interval up to 3 h. 10 µL of acid degradation sample was subjected to UPLC and was analysed under the optimized chromatographic conditions. In case of 1N HCl degradation additional 10 µL sample after 24 h was subjected to UPLC.
2.2.3.2. Basic hydrolysis
2.5 mL solution of standard tiemonium methylsulphate in 1N NaOH was transferred to 25 mL volumetric flask to gain a concentration of 10 µg mL−l and was shaken in an ultrasonic water bath for the period of 3 h at ambient temperature. During the ultrasonic shaking after one hour of interval up to 3 h. 10 µL of degradation sample was subjected to UPLC and was analysed under the optimized chromatographic conditions.
2.2.3.3. Photo degradation
2.5 mL solution of standard tiemonium methylsulphate in water was transferred to 25 mL volumetric flask to gain a concentration of 10 µg mL−l and was placed in photo-stability chamber (UV-light) for the period of 3 h at ambient temperature. After one hour of interval up to 3 h. 10 µL of degradation sample was subjected to UPLC and was analysed under the optimized chromatographic conditions.
2.2.3.4. Oxidative degradation
2.5 mL solution of standard tiemonium methylsulphate in 3% H2O2 was transferred to 25 mL volumetric flask to gain a concentration of 10 µg mL−l and was stored at room temperature for the period of 3 h. After one hour of interval up to 3 h 10 µL of degradation sample was subjected to UPLC and was analysed under the optimized chromatographic conditions.
2.2.3.5. Thermal degradation
2.5 mL solution of standard tiemonium methylsulphate in water was transferred to three different 25 mL volumetric flasks to gain a concentration of 10 µg mL−l were exposed to heat at 50°C, 60°C and 80°C for 1 h. 10 µL of degradation sample was subjected to UPLC and was analysed under the optimized chromatographic conditions.
2.3. Chromatographic conditions
Determination of residue of tiemonium methylsulphates after degradation was performed by the previously validated UPLC method validated in terms of ICH [Citation6] analytical performance parameters; precision, accuracy, specificity, limit of detection, limit of quantitation, linearity and range, suitability and robustness.
2.4. Computational method
2.4.1. Optimization of geometry
Thermodynamic parameters (electronic energy, enthalpy, Gibb’s free energy), frontier molecular orbital features (HOMO–LUMO gap, hardness, softness, chemical potential), dipole moment, atomic partial charge and molecular electrostatic potential properties can be calculated precisely by utilizing quantum mechanical (QM) methods. All the structures were optimized by using density functional theory (DFT) employing Becke’s (B) [Citation7] three-parameter hybrid model, Lee, Yang and Parr’s (LYP) correlation functional [Citation8] in Gaussian 09 programme package [Citation9] under Pople’s 6-31G +(d,p) basis set [Citation10]. Initial geometry of TMS was taken from the online structure database named ChemSpider [Citation11]. Dipole moment, electronic energy, enthalpy, free energy, electrostatic potential and atomic partial charge are calculated for all the molecules.
Frontier molecular orbital features HOMO, LUMO were calculated at the same level of theory. For each of the molecules, hardness (η) and softness (S) were calculated from the energies of frontier HOMOs and LUMOs considering Parr and Pearson interpretation [Citation12] of DFT and Koopmans theorem [Citation13] on the correlation of ionization potential (I) and electron affinities (E) with HOMO and LUMO energy (ϵ). The following equations are used to calculate hardness (η) and softness (S); η = [ϵLUMO − ϵHOMO]/2; S = 1/ η.
2.4.2. Protein preparation for molecular docking
Crystal structure of the protein was collected from online Protein Data Bank (PDB) database (PDB ID: 5DSG) [Citation13]. Swiss-Pdb viewer software (version 4.1.0) used for energy minimization of the protein, because the structure has some issues related to improper bond order, side chains geometry and missing hydrogen (s) [Citation14]. PyMol (version 1.3) software packages were used to erase all hetero atoms and water molecules before molecular docking [Citation15]. All the optimized structures were subjected to molecular docking study against (M4) muscarinic acetylcholine receptor protein (5DSG). Finally, docking was performed considering the protein as macromolecule and optimized structures as ligand by utilizing PyRx software (version 0.8) [Citation16]. Accelrys Discovery Studio (version 4.1) was utilized [Citation17] to analyse the docking result and search the interactions between ligands and amino acid residues of target protein.
2.4.3. Visualization and analysis of docking results
Molecular docking is an important tool to predict the binding affinity and mode(s) [Citation18]. In this analysis, rigid docking was performed where, all rotatable bonds were converted into non-rotatable with the centre grid box size 64.84, 73.29 and 57.94 Å along x, y and z directions respectively. Non-bonded interaction was performed to visualize and interpret the hydrogen bond interactions, electrostatic interactions and hydrophobic interactions of the best pose of drugs with respected protein [Citation19].
2.4.4. Pharmacokinetic parameters
Absorption, distribution, metabolism, excretion, toxicity (ADMET) calculations and carcinogenic properties were predicted by utilizing AdmetSAR online database [Citation20]. Structure Data File (SDF) and Simplified molecular-input line-entry system (SMILES) strings were utilized throughout the generation process
3. Results and discussion
3.1. Chromatographic estimation of residual TMS
The validated UPLC method developed previously [Citation21] was applied to residue of TMS after degradation. Method validation parameters are shown in Table . Figure shows the chromatogram tiemonium methylsulphate under experimental condition.
Figure 2. Relative decrease (%) of tiemonium methylsulphate in a. acid hydrolysis, b. alkaline hydrolysis, c. oxidative degradation, d. photolytic degradation, e. thermal degradation.
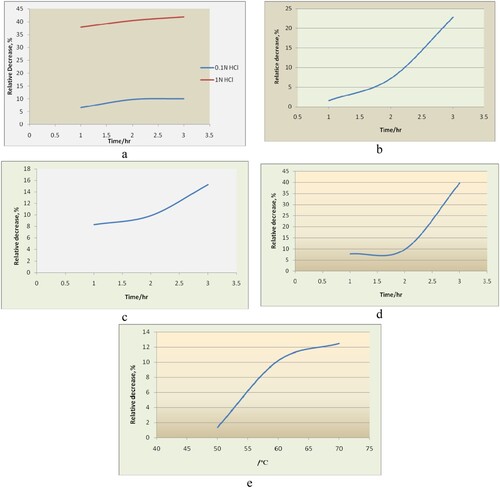
Table 1. Validation performance of the proposed UPLC method.
Forced degradation studies of the bulk drug sample were performed using the following conditions: acid hydrolysis (0.1N HCl, 1.0 N HCl), basic hydrolysis (1.0 N NaOH), heat (50–70°C for 1 h), photolytic (UV radiation for 3 h) and oxidation (3% hydrogen peroxide). Peak purity test was carried out for tiemonium methylsulphate by using UV detector. The stressed samples so prepared were injected in the UPLC column and chromatograms were obtained using preliminarily optimized mobile phase [Citation21]. Percentage degradation of tiemonium methylsulphate under various stress conditions was calculated and listed in Table .
Table 2. Relative decrease (%) of tiemonium methylsulphate under various stress conditions.
3.1.1. Acid hydrolysis
In the acid degradation study of tiemonium methylsulphate showed no additional peak. In 0.1N HCl, the relative decrease (%) of initial concentration is maximum 10% after 3 h. Significant decrease (%) has been found in acid hydrolysis at 1.0N HCl up to 98.5% after 24 h of shaking at room temperature. Relative decrease (%) in both acid concentrations has been plotted against the time as shown in Figure (a). In both acid concentrations, relative decrease happened proportionally with time for the period of 2 h.
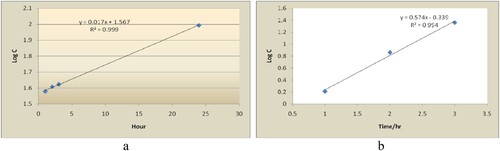
Figure 3. Degradation profile of tiemonium methylsulphate in a. acid (1N HCl), b. base (1N NaOH) hydrolytic degradation.
3.1.2. Alkali hydrolysis
In the base degradation study of tiemonium methylsulphate showed no additional peak. In 1N NaOH, relative decrease (%) of initial concentration reaches to the maximum 24% after 3 h of shaking at room temperature. Relative decrease (%) in both basic concentrations has been plotted against the time as shown in Figure (b). Up to first 1.5 h relative decrease happened slowly but after then it happened almost steeply with time up to 3 h hydrolysis.
3.1.3. Oxidative degradation
In the oxidative degradation study of tiemonium methylsulphate showed no additional peak. In 3% H2O2 degradation, relative decrease (%) of initial concentration reaches to the maximum 15% after 3 h of shaking at room temperature. Relative decrease (%) in tiemonium methylsulphate concentration has been plotted against the time as shown in Figure (c). Relative decrease (%) happened almost linearly up to 5 h and after then it runs proportionally with time.
3.1.4. Photo degradation
Photolytic studies were carried out by exposure of tiemonium methylsulphate in water to UV light (photo-stability chamber) for a period of 3 h. This photo degradation sample was analysed under the optimized chromatographic conditions. In the photo degradation study, tiemonium methylsulphate showed no additional peaks. Relative decrease (%) of tiemonium methylsulphate has been plotted against the time as shown in Figure (d). Up to 2 h relative decrease goes linearly and then it jumped proportionally with time and reaches to 40% after the period of 3 h. Differences between means were not less than 40%, and these bigger differences are generally considered clinically very important.
3.1.5. Thermal degradation
Thermal degradation was performed by keeping tiemonium methylsulphate in water in oven at three different temperatures from 50°C to 70°C for a period of 1 h. Over the study period, sample concentrations stored at either temperature retained not more than 87% of the initial tiemonium methylsulphate concentration. Relative decrease (%) has been plotted against the time as shown in Figure (e). with the increase in temperature, degradation increases proportionally with time but after 60°C it goes slowly. Results revealed that the amount of degradation was insignificant.
The decrease in the concentration of tiemonium methylsulphate at different time (hours) are represented in the above table and Figure (a–e). Degradation results indicated that tiemonium methylsulphate degraded significantly under acid hydrolysis and photolytic conditions and marginally in basic hydrolysis and oxidative conditions. Forced degradation study revealed that tiemonium methylsulphate degraded insignificantly under thermal conditions. In 0.1N acid hydrolysis and thermal conditions, degradation was not so significant and comparable. It was degraded marginally in oxidative conditions. In base hydrolysis degradation was less significant than acid hydrolysis. But in photolytic condition tiemonium methylsulphate shows significant degradation after 2 h. In the stress conditions of degradation study additional peak of degraded product was shown at the monitoring weave length of 320 nm but they were not identified.
3.2. Time dependent degradation kinetics
For the measurement of degradation profile of tiemonium methylsulphate was performed. Measurement was done up to 24 h in acid (1N HCl) hydrolysis whereas in base (1N NaOH) hydrolysis it was done for the period of 3 h. Log C (C= % decrease) vs. time (hour) curve (Figure (a,b)) was constructed for the degradations. These data were fit significantly better by a first-order rate. Different kinetics parameters like apparent first-order rate constant (k) and half-life (t1/2, time for 50% potency left) were calculated and tabulated in Table . From the degradation kinetics data, it can be concluded that tiemonium methylsulphate is susceptible to acidic than alkaline degradation.
Figure 4. Optimized structures of all drugs (TMS, T1, T2, T3 and T4) with B3LYP/6-31+G(d,p) theory.
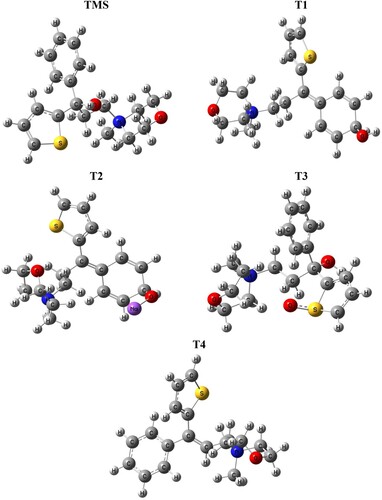
3.3. Computational chemistry study
From literature study [Citation22,Citation23] four degradation products are identified which are shown in the following Scheme 1. The optimized structure of TMS and its degradents are labelled from TMS to T4 sequentially presented in Figure . The image of the frontier molecular orbitals of TMS and T2 is displaying in Figure . The stoichiometry, electronic energy, enthalpy, free energy and dipole moment of all degradants are reported in Table . The HOMO and LUMO energies, gap, hardness and softness of all degradants are presented in Table . Table included the binding energy and nonbonding interaction of TMS and its derivatives with 5DSG after rigid docking. Selected pharmacokinetics parameters are reported in Table . Molecular electrostatic potential map of all molecules (TMS, T1, T2, T3 and T4) has been shown in Figure . The partial charges of TMS and T2 are given in Figures and .
Figure 5. Frontier molecular orbitals (HOMO and LUMO) of TMS, T1, T2, T3 and T4.
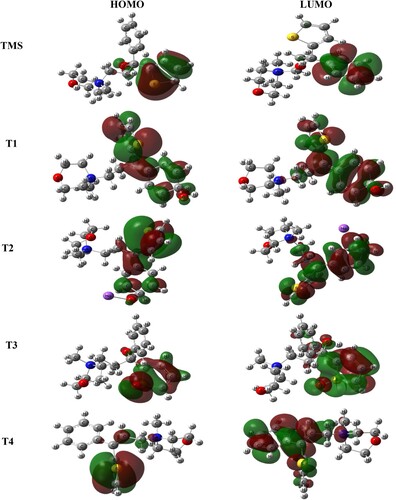
Figure 6. Molecular electrostatic potential map of all drugs (TMS, T1, T2, T3 and T4).
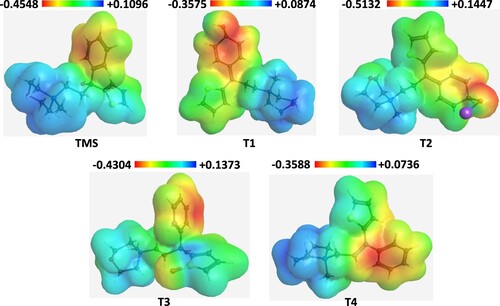
Figure 7. Graphs of atomic charges of TMS calculated with Mullekin and NBO methods.
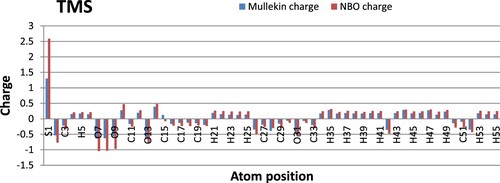
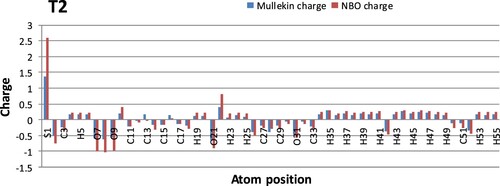
Figure 8. Graphs of atomic charges of T2 calculated with Mullekin and NBO methods.
Scheme 1. Degradation products of tiemonium methylsulphate at different condition.
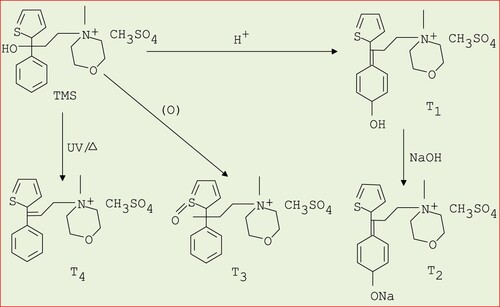
Table 3. The stoichiometry, electronic energy, enthalpy, Gibbs free energy in Hartree and dipole moment (Debye) of TMS and its derivatives.
Table 4. Energy (eV) of HOMO, LUMO, HOMO-LUMO Gap, hardness and softness of all derivatives.
Table 5. Binding energy and nonbonding interaction of TMS and its derivatives with 5DSG after rigid docking.
Table 6. Selected pharmacokinetic parameters of TMS and its analogues (probability values related to each of the parameters are given in the parenthesis).
3.3.1. Thermo-chemical analysis
TMS and its degradents significantly influence the structural properties including thermal energy, partial charge distribution and dipole moment. After modification more negative values are found for T2 and T3 compared TMS.
These results indicate that after degradation T2 and T3 structures become more stable than the parent structure (Table ). Free energy is a more pivotal standard to represents the interaction of binding partners where both the sign and magnitude are important to express the possibility of bimolecular events occurring [Citation24]. The negative values of free energies (Table ) means the binding will occur spontaneously without any extra energy expenditure. A significant changes are observed for T2 and T3 suggesting the molecules energetically and configurationally more preferable. The highest free energy change is observed for T2. The free energy of the structure changes from −2042.229 Hartree to −2203.957 Hartree. However, in case of T3 (−2108.044 Hartree) this value is also changed significantly.
The calculated dipole moments were increased for T2 and T3 then the parent drug. The polar nature of a molecule increases with the increase of dipole moment. The dipole moment of TMS is found 11.08 Debye, and here all degradents except T1 shows increased dipole moment (Table ). Large increased is observed in T3 (19.69 Debye). Elevated dipole moment can promote hydrogen bond and non-bonded interactions in drug receptor complexes which in turn can lead to increased binding affinity [Citation25]. Therefore, for T2 and T3 increased dipole moment resulted in an increased binding affinity against receptor protein.
3.3.2. Frontier molecular orbital analysis
From frontier molecular orbital theory, it is known that HOMO (highest occupied molecular orbital) and LUMO (lowest unoccupied molecular orbital) play an important role in chemical reactions. The chemical hardness and softness of a molecule is related to the HOMO–LUMO gap. Because of large HOMO–LUMO energy gap (Figure ) the molecule shows high kinetic stability and low chemical reactivity [Citation26]. A small HOMO–LUMO energy gap is important for low chemical stability because the addition of electrons to a high-lying LUMO and/or removal of electrons from a low-lying HOMO are energetically favourable in any potential reaction [Citation27]. HOMO–LUMO gap as well as hardness and softness were calculated for all the drugs (Table ). In this investigation, it is found that drug T2 has the lowest HOMO–LUMO gap and the highest softness, which may contribute to show higher chemical activity than TMS and degradents. A decreased HOMO–LUMO gap in most of the degradents promotes softness which makes them relatively more polarizable and chemically more reactive.
3.3.3. Electrostatic potential analysis
Molecular electrostatic potential (MEP) was calculated at B3LYP/6-31G+(d,p) level of theory to forecast the reactive sites for electrophilic and nucleophilic attack of all optimized structures. It also helps to interpret the biological recognition process and hydrogen bonding interaction [Citation28]. Red colour represents the maximum negative region which preferred site for electrophilic attack, blue colour indicates the maximum positive region which preferred site for nucleophilic attack and green colour represents the region of zero potential. MEP displays molecular size, shape as well as positive, negative and neutral electrostatic potential regions simultaneously in terms of colour grading. It is seen from the MEP map, region having the negative potential are over electronegative atom (oxygen atoms) and having positive potential are over hydrogen atoms. Here, the maximum negative potentiality is −0.5132 a.u. (deep red) and positive potentiality is +0.1447 a.u. (deep blue) were observed in T2 molecule. Figure provides a visual representation of chemical active site and comparative reactivity of atoms.
3.3.4. Atomic partial charge
Polarity of chemical bond often motivates the structure and reactivity [Citation29]. Partial charge of a molecule is another important factor and a number of different methods have been applied for assigning partial charge to the atoms of a molecule, including both quantum chemical and empirical schemes [Citation30]. Two different methods (Mullekin and NBO) are used here to compute the atomic partial charges of TMS and T2 (Figure , 8). In both molecules S-1, S-10 show positive charges and O-7, O-8, O-9 show negative charges in both methods. A significant change was found at S-10 in T3 molecule. Again, C-15 in TMS and C-13 atoms in T1 and T2 show slightly positive charge with the Mullekin method but negative values are observed in the case of NBO method.
3.3.5. Molecular docking and non-bonding interaction analysis
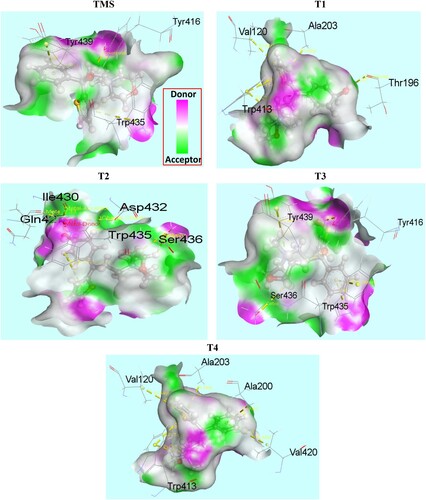
Molecular docking has been performed to study the interaction between degradents and the amino acid residues of muscarinic acetylcholine receptor protein (5DSG). Muscarinic acetylcholine receptors are G-protein-coupled receptors that regulate many vital functions of the central and peripheral nervous systems. In particular, it has emerged as attractive drug targets for treatments of neurological disorders, such as Alzheimer’s disease and schizophrenia. The binding affinity and nonbonding interaction of all drug-receptors complexes are summarized in Table . Docked conformation of all structure at inhibitor binding site of prepared protein chain, 5DSG has been shown in Figure . Figure shows the nonbonding interactions of TMS and its degradents with 5DSG generated by Discovery Studio. The binding affinity of TMS is −7.2 kcal/mol, where all the degradation products have improved binding affinity. A significant improvement is observed in T1 (−9.2 kcal/mol) and T4 (−9.6 kcal/mol). The improved interactions not only increase the binding affinity but also improve the binding specialty in different magnitude. Hydrogen bond surface of 5DSG with all degradents (TMS, T1, T2, T3 and T4) has been represented by Figure . Hydrogen bond is essential for DNA structure in biological system. Hydrogen bond with a distance <2.3 Å are also important to enhance the binding properties [Citation31–33]. Improved hydrogen bonding observed in T1 and T3. Some effective conventional hydrogen bond are observe in TMS (Tyr416), T1 (Thr196) and T3 (Tyr416). Similarly, some carbon hydrogen bonds are observed in T1 (Asp112), T2 (Ser436) and T3 (Ser436). In T1 and T4 compound, Pi-alkyl (Val120, Val420, Ala200 and Ala203), Pi-cation (Tyr113, Trp413) and Pi-pi T shaped (Trp413) interactions are observed which significantly increase the binding affinity [Citation34]. A special type metal acceptor interaction (Na- Gln427, Na-Ile430) was found in T2 compound and Pi-pi stacked interaction was observed in TMS, T2, T3 with Tyr439, Asp432 and Trp435 amino acid residues respectively.
Figure 9. Docked conformation of all structure at inhibitor binding site of prepared protein chain, 5DSG.
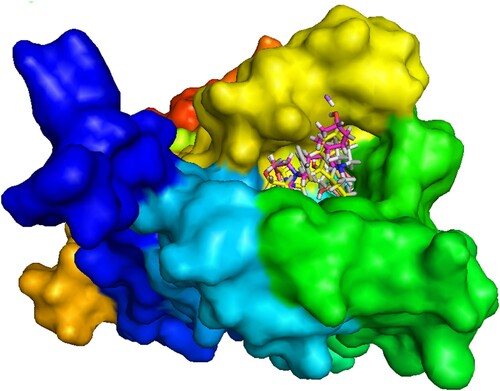
Figure 10. Nonbonding interactions of TMS and its analogues with 5DSG generated by Discovery Studio.
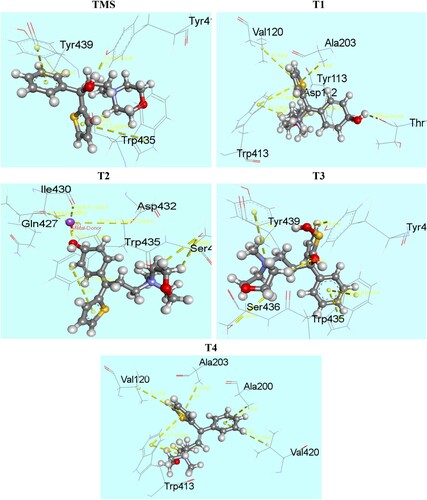
Figure 11. Hydrogen bond surface of 5DSG with all drugs (TMS, T1, T2, T3 and T4),
3.3.6. Pharmacokinetic properties of TMS and its modified derivatives
AdmetSAR calculation predicts all degradents are non-carcinogenic. So, the modified degradents are expected to be safe for biological use. All drugs are P-glycoprotein non-inhibitor. P-glycoprotein inhibition can block the absorption, permeability and retention of the degradents [Citation35]. Selected pharmacokinetic parameters of TMS and its degradents are shown in Table . All drugs show positive response for blood brain barrier (BBB) criteria, predicting that drugs will go through BBB. Moreover, all the analogues show improved human intestinal absorption value. Rat acute toxicity of all drugs is almost same as TMS. So, all degradents show almost similar median lethal dose (LD50) values as parent drug (TMS). Therefore, more study of this aspect is necessary.
4. Conclusion
Degradation behaviour of TMS under hydrolysis (acid, base and neutral), oxidation, photolysis and thermal stress conditions and the inherent stability of the degadents were studied. Degradation study revealed that TMS degraded significantly under acid hydrolysis and photolytic degradation conditions. Degradation was less significant and comparable in basic and oxidative conditions. Rather degradation was insignificant in thermal condition. Computational study identified T2 and T3 are thermally more stable with improved dipole moment. At the same time T1, T2 and T4 have the lower HOMO–LUMO gap with higher chemical softness which suggesting their better chemical reactivity than parent drug, TMS. In addition T2 have improved electrostatic potentiality due to the presence of highly reactive metal atom. ADMET data predicts that all the degradents are non-carcinogenic and safe for oral administration. From molecular docking simulation, all the degradants bind at the same binding pocket and have better binding affinity than the TMS. Therefore, the degradants can be work as more potential anti-muscarinic agent. In addition R2 have improved electrostatic potentiality due to the presence of highly reactive atoms. ADMET data predicts that all the degradants are non-carcinogenic and safe for oral administration. From molecular docking simulation it is shown that all the degradants bind at the same binding pocket and have better binding affinity than the TMS. Therefore, the degradants can work as more potential anti-muscarinic agent.
Acknowledgement
Authors would like to acknowledge Research and Publication Cell, University of Chittagong, Bangladesh for allocating partial financial aid to undergo this research project.
Disclosure statement
No potential conflict of interest was reported by the author(s).
Additional information
Funding
References
- Bejjani A, Nsouli B, Zahraman K, et al. Swift quantification of fenofibrate and tiemonium methylsulfate active ingredients in solid drugs using particle induced X-ray emission. Adv Mater Res. 2011;324:318–323.
- Sweetman MSC. The complete drug reference. 36th ed. London: The Pharmaceutical Press; 2009. 2198–2199.
- Roge AB, Tarte MM, Shendarkar KPS, et al. Forced degradation study: an important tool in drug development. Asian J Pharm Res. 2013;3:198–201.
- International Conference on Harmonization (ICH) for registration of pharmaceuticals for human use. 2003. Stability testing of new drug substances and products, ICH-Q1A(R2).
- Wu Y. The use of liquid chromatography–mass spectrometry for the identification of drug degradation products in pharmaceutical formulations. J Biomed Chromatogr. 2000;14:384–396.
- ICH Harmonized Tripartite. (1996). Validation of analytical procedures: text and methodology Q2 (R1), current step 4 version, parent guidelines on methodology dated November 6 1996, incorporated In: International Conference on Harmonisation, Geneva, Switzerland, 2005.
- Becke AD. Density-functional exchange-energy approximation with correct asymptotic behavior. Phys Rev A. 1988;38:3098–3100.
- Lee C, Yang W, Parr RG. Development of the Colle-Salvetti correlation-energy formula into a functional of the electron density. Phys Rev B. 1988;37:785–789.
- Pauwels E. Uncovering radiation chemistry in the solid state through periodic density-functional calculations: confrontation with experimental results and beyond. In: A Lund, M Shiotani, editors. Appl. EPR Radiat. Res. Cham: Springer International; 2014. p. 667–702.
- Kruse H, Goerigk L, Grimme S. Why the standard B3LYP/6-31G model chemistry should not be used in DFT calculations of molecular thermochemistry: understanding and correcting the problem. J Org Chem. 2012;77:10824–10834.
- Pence HE, Williams A. Chemspider: an online chemical information resource. J Chem Educ. 2010;87:1123–1124.
- Pearson RG. The HSAB principle – more quantitative aspects. Inorganica Chim Acta. 1995;240:93–98.
- Lucido MJ, Orlando BJ, Vecchio AJ, et al. Crystal structure of aspirin-acetylated human cyclooxygenase-2: insight into the formation of products with reversed stereochemistry. Biochemistry. 2016;55:1226–1238.
- Guex N, Peitsch MC. SWISS-MODEL and the Swiss-Pdb viewer: an environment for comparative protein modeling. Electrophoresis. 1997;18:2714–2723.
- Delano WL. The PyMOL molecular graphics system. San Carlos (CA): De-Lano Scientific; 2002; http://www.pymol.org.
- Dallakyan S, Olson AJ. Small-molecule library screening by docking with PyRx. In: JE Hempel, CH Williams, CC Hong, editors. Chemical biology: methods and protocols. New York, NY: Springer New York; 2015. p. 243–250.
- Version A.D.S., 4.0, Accelrys, San Diego, USA, 2017.
- Morris GM, Lim-Wilby M. Molecular docking. In: A Kukol, editor. Molecular modeling of proteins. Totowa, NJ: Humana Press; 2008. p. 365–382.
- Studio D. Accelrys Inc, San Diego, CA, USA. 2013.
- Cheng F, Li W, Zhou Y, et al. admetSAR: a comprehensive source and free tool for assessment of chemical ADMET properties. J Chem Inf Model. 2012;52:3099–3105.
- Uddin MN, Uddin M, Kabir T, et al. New validated UPLC method for the determination of tiemonium methyl sulphate in pharmaceutical and biosamples. Pharm Pharmacol Int J. 2017;5(2):117–126.
- Ramadan NK, Abd El Halim LM, El Sanabary HFA, et al. Stability indicating chromatographic methods for the determination of tiemonium methyl sulphate. Int J Adv Res. 2014;2:366–376.
- Zaazaa HE, Abbas SS, El Sherif ZA, et al. Stability indicating spectrophotometric methods for determination of tiemonium methyl sulphate in the presence of its degradation products. J Appl Pharm Sci. 2014;4:33–45.
- Garbett NC, Chaires JB. Thermodynamic studies for drug design and screening. Expert Opin Drug Discov. 2012;7:299–314.
- Lien EJ, Guo Z-R, Li R-L, et al. Use of dipole moment as a parameter in drug-receptor interaction and quantitative structure-activity relationship studies. J Pharm Sci. 1982;71:641–655.
- Aihara J. Reduced HOMO−LUMO gap as an index of kinetic stability for polycyclic aromatic hydrocarbons. J Phys Chem A. 1999;103:7487–7495.
- Aihara J. Correlation found between the HOMO-LUMO energy separation and the chemical reactivity at the most reactive site for isolated-pentagon isomers of fullerenes. Phys. Chem. 2000;2:3121–3125.
- Politzer P, Murray JS. Electrostatic potential analysis of dibenzo-p-dioxins and structurally similar systems in relation to their biological activities, 1990.
- Heinz H, Suter UW. Atomic charges for Classical Simulations of polar systems. J Phys Chem B. 2004;108:18341–18352.
- Gross KC, Seybold PG, Hadad CM. Comparison of different atomic charge schemes for predicting pKa variations in substituted anilines and phenols. Int J Quant Chem. 2002;90:445–458.
- Bissantz C, Kuhn B, Stahl M. A medicinal chemist’s guide to molecular interactions. J Med Chem. 2010;53:5061–5084.
- Zhurkin VB, Tolstorukov MY, Xu F, et al. The role of hydrogen-bonds in drug binding. In: DNA conform transcription. Boston, MA: Springer US; 2005. p. 18–34.
- Wade RC, Goodford PJ. The role of hydrogen-bonds in drug binding. Prog Clin Biol Res. 1989;289:433–444.
- Uzzaman M, Uddin MN. Optimization of structures, biochemical properties of ketorolac and its degradation products based on computational studies. DARU J Pharm Sci. 2019; doi:10.1007/s40199-019-00243-w.
- Amin ML. P-glycoprotein inhibition for optimal drug delivery. Drug Target Insights. 2013;7:27.