
Abstract
This study aimed to evaluate the relationship between tumour-necrosis factor-alpha (TNF-α), interleukin (IL)-18, IL-23, IL-35 and Heilcobacter (H) pylori infection with T2DM. A total of 25 healthy subjects and 102 confirmed T2DM patients were enrolled in this study. Diabetic patients were subdivided into six groups according to antidiabetic therapy. Diabetic non-treated patients exhibited a significant elevation in H. Pylori- Ig-G, TNF-α, IL-18, and IL-23 levels, but a noticeable decrease in IL-35 expression was observed compared to healthy controls. Antidiabetic therapy induced a significant decrease in the level of glycosylated hemoglobin (HbA1c), TNF-α, IL-18 and IL-23, while IL-35 expression was upregulated compared to diabetic controls. The results exhibited a positive correlation between H. pylori and HbA1c%, TNF-α, IL-18, and IL-23 values, and also between HbA1c% and TNF-α, IL-18 and IL-23 levels. Therefore, antidiabetic therapy decreases significantly the hyperglycemic state and circulating level of inflammatory cytokines which reflects their potential anti-inflammatory effects.
1. Introduction
Diabetes mellitus (DM) is a global public health concern of the twenty-first century. DM is a metabolic dysfunction characterized by persistent hyperglycemia along with disorders in carbohydrate, protein and fat metabolism that are generally the result of insulin availability and need imbalance [Citation1]. Recently, the worldwide prevalence of diabetes is estimated to be 463 million people (9.3%) and is projected to increase to 578 million people (10.2%) by 2030 [Citation2]. Type 2 diabetes mellitus (T2DM) is an inflammatory metabolic disorder and many cytokines have been implicated in its pathophysiology [Citation3]. Therefore, pro-inflammatory cytokines not only affect insulin resistance but also directly contribute to apoptosis of β-cells which ultimately leads to the progress of T2DM. Notably, a positive correlation was recorded between adipocyte-tumour necrosis factor-alpha (TNFα) expression and hyperinsulinemia levels [Citation4]. Elevated level of IL-18 was obviously associated with increased risk of diabetes, independent of common risks like obesity and adipokines [Citation5]. Moreover, Kalninova et al. [Citation6] observed a beneficial effect of treatment with anti-diabetic agents plus insulin on the levels of inflammatory biomarkers like TNF-α, IL-8, and TAG compared to insulin treatment alone. Regarding T2DM patients, Hasnain et al. [Citation7] observed elevation in proinflammatory cytokines, such as IL-23 which enhances β-cell oxidative stress in the pancreatic islets. It is noteworthy that the serum level of IL-35, a novel anti-inflammatory cytokine, was markedly reduced in patients with proliferative diabetic retinopathy [Citation8].
Helicobacter (H) pylori infects approximately 50% of the human population worldwide and the infection is more highly in developing countries [Citation9]. Kayar et al. [Citation10] found a noticeable correlation between infection of H. pylori and insulin resistance, inflammation status, metabolic syndrome and diabetic complications. Also, Rafat et al. [Citation11] identified increased frequency of H. pylori-seropositive in T2DM patients which suggested a possible association between infection of H. pylori and T2DM. Importantly, infection of H. pylori has been linked to higher levels of C- reactive protein (CRP) and TNF-α [Citation12]. Additionally, several cytokines levels including, TNF-α, interferon-gamma (IFN-γ), IL-6, IL-1, IL-10, IL-17, IL-8 and IL-18 in H. pylori-seropositive subjects were increased markedly relative to the healthy group [Citation13]. To the best of our knowledge, few investigations have addressed the role of cytokines expression, the infection of H. pylori and glycemic status in T2DM patients. Therefore, the current study aims to explore the correlation between cytokines like TNF-α, IL-18, IL-23 and IL-35 with H. pylori infection in type 2 diabetic patients.
2. Subjects, materials and methods
2.1. Patients
A cohort of 102 volunteer patients that proven T2DM (mean age 57.8 years) was included in this study. All the participants were subjects who were followed up by the diabetic section, General Institution of Healthy Insurance, Beni-Suef, Egypt. The research protocol was carried out in accordance with the Helsinki Declaration and guidelines for good practice. Informed written consent should be obtained from all participants after the ethical committee of the institutional review board was approved the research protocol (BS-FS-2017-10).
Healthy controls enrolled are free of type I and type 2 diabetes mellitus. While enrolled patients are subjects who have been diagnosed as T2DM according to the criteria of WHO 1999 (all diabetic participants were ≥4.5 years post-diagnosis). For all enrolled subjects (healthy subjects and T2DM patients), key exclusion criteria included endocrine dysfunction, autoimmune disorders as well as respiratory, kidney, liver, cerebrovascular and heart diseases. Furthermore, pregnant and lactating women as well as patients with medical conditions such as malignancies and alcohol abuse were excluded.
2.2. Experimental design
This study included 127 participants of both sexes; 25 healthy subjects and 102 T2DM patients. From 102 T2DM patients, 87 patients were under treatment of antidiabetic therapies. T2DM patients classified into six groups according to antidiabetic therapy as follows:
Group I: Healthy control group (n=25).
Group 2: Diabetics (recent diagnosed)-untreated patients (n=15).
Group 3: Diabetic patients treated with metformin (n=15).
Group 4: Diabetic patients treated with glimepiride (n=18).
Group 5: Diabetic patients treated with metformin plus glimepiride (n=15).
Group 6: Diabetic patients treated with metformin plus insulin (n=19).
Group 7: Diabetic patients treated with insulin (n=20).
Blood samples have been taken from overnight fasting participants. After an incubation time of 30 min at room temperature, blood samples were centrifuged for separation of the serum in plain-tubes. Sera were quickly separated, divided, and then stored at −40°C. For immediate estimation of glucose level, the second blood sample was taken on potassium fluoride. The third part of the blood sample was taken on EDTA for measuring HbA1c% and cytokine expressions.
2.3. Laboratory assay
Blood glucose level and fasting insulin levels were estimated using kits obtained from Reactivos Spinrect, Spain. Blood glycosylated hemoglobin percentage was measured by reagent kits purchased from Stanbio Company (Texas). Serum TNF-α was determined using a standard sandwich enzyme-linked immune-sorbent assay (ELISA) Kit obtained from R&D Systems (USA) as advised by the manufacturer. H. pylori infection was diagnosed by stool antigen detection sample and serological antibodies concentration [Citation14].
2.4. RNA isolation and qRT-PCR
Blood samples of subjects of all groups were used individually to extract total RNA via TRIzol Reagent (MBI Fermentas, Germany), and cDNA synthesis has been handled using the High-Capacity cDNA Reverse Transcription Kit (Invitrogen, Germany) along with manufacturer’s instructions. Real-time PCR was carried out in a 20 μL system having 10 μL of 1x SsoFast EvaGreen Supermix (Bio-Rad, Hercules, CA, USA), 2 μL of cDNA, 6 μL of RNase/DNase-free water, and 500 nM of the primer pair sequences: IL-18: F: 5′-GGGGTACCATGGCTG CTGAACCAGTAGAAG-3′ and R:5′-CCGCTCGAGAGCTAGTCTTCGTTTTGAACAGTG-3′ (XM 011542805.1); IL-23: F: 5′-TGCAAAGGATCCACCAGGGTCTGA-3′ and R: 5′-TAGGTGCCATCCTTGAGCTGCTGC-3′ (XM 011538477.2); IL-35 F: 5′-TCC TCC CTT GAA GAA CCG GA-3′ and R: 5′-TGA CAA CGG TTT GGA GGG AC-3′ (NM 001354582.1); β–actin F: 5-CTGTCTGGCGGCACCACCAT-3 and R: 5-GCAACTAAGTCATAGTCCGC-3 (X00351). The thermal cycler conditions were as follows: 30 s at 95°C, then 40 cycles of 5 s at 95°C and 10 s at 60°C. For each reaction, a 65–95 °C ramp was performed with a melting curve study. With each process, the threshold duration at which the fluorescent signal exceeded an arbitrarily defined threshold close to the middle of the log-linear amplification step was estimated, and the relative amount of mRNA was estimated. The amplification data will be analyzed by using manufacturer's programme through using Livak and Schmittgen methods [Citation15] and the variables were normalized to β-actin.
2.5. Statistical analysis
The result values were presented as mean ± standard error. Data were analyzed using SPSS version 20 for Windows (IBM Corp., 2011), the data were analyzed. All statistical difference among groups was carried out by the one-way analysis of variance (ANOVA), followed by Duncan′s method for post hoc analysis. Correlation analysis was estimated by Pearson correlation coefficients method between different studied parameters. P < 0.05 values have been considered statistically significant.
3. Results
The characteristics of all subjects have been presented clearly in table . All diabetic groups revealed a significant (P< 0.001) elevation in BMI values compared with healthy controls. HbA1c% was significantly (P<0.001) elevated in diabetic non-treated patients when compared with healthy controls. However, treatment with antidiabetic therapies (metformin mono-or dual) revealed a noticeable attenuation in HbA1c% relative to diabetic non-treated patients as represented in table1.
Table 1. The demographic data and glycated hemoglobin of healthy controls, diabetic non-treated and diabetics treated groups.
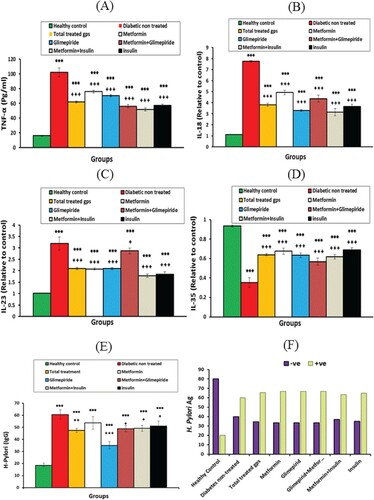
TNF-α level, IL-18 and IL-23 mRNA expression exhibited a significant (P<0.001) increase in the diabetic non-treated group compared with the healthy group. Treatment with antidiabetic therapies showed decreased levels of tested cytokines relative to the diabetic non-treated group (Figure ). However, IL-35 mRNA expression exhibited an opposite behavioural pattern through significant (P<0.001) down-regulated expression in the diabetic non-treated group. However, IL-35 mRNA expression was upregulated markedly (P<0.001) after antidiabetic treatments compared with the diabetic non-treated group (Figure ). Otherwise, H. Pylori IgG exhibited a significant (P < 0.001) elevation in all diabetic groups compared with healthy controls. Among stool samples of study participants, H. pylori Ag was recorded 60% positive in diabetic non-treated patients, while diabetic treated groups exhibited higher frequencies of H. Pylori Ag positive (63.2% - 66.7%) compared with 20% of the healthy control group (Figure ). These results indicated that antidiabetic therapies had no impact on H. pylori Ag concentrations in patients of treated groups.
Figure 1. The levels of (A) TNF-α concentration, (B) IL-18 mRNA expression, (C) IL-23 mRNA expression, (D) IL-35 mRNA expression, (E) H. Pylori IgG concentration, (F) H. Pylori (Ag)% of healthy controls, diabetic non-treated group and diabetic treated groups. Values were considered significantly different at *P< 0.05, **P< 0.01 and ***P< 0.001 versus healthy controls; and +P< 0.05 and +++P < 0.001 versus diabetic non-treated group. IL; interleukin, TNF-α.; tumour necrosis factor-alpha, Met.: metformin, Glim.: glimepiride.
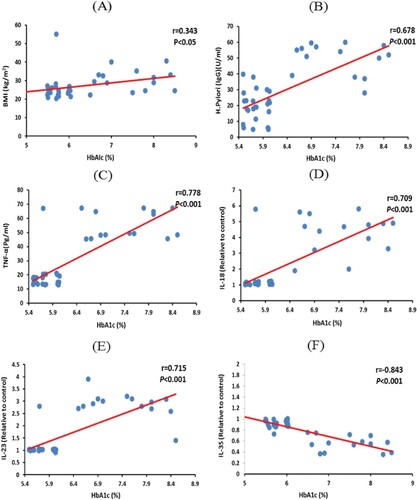
Among metformin plus glimepiride-treated group, the recorded values in T2DM patients showed a negative correlation between H. Pylori IgG and IL-35 values (−0.823; P < 0.001). In addition, the results revealed a positive correlation between H. Pylori-IgG and BMI (0.451; P < 0.01), HbA1c (0.678; P < 0.001), TNF-α (0.735; P < 0.001), IL-18 (0.734; P < 0.001) and IL-23 values (0.792; P < 0.001) (Figure ). Moreover, HbA1c% revealed a negative correlation with IL-35 values (−0.843; P < 0.001). While, HbA1c% showed a positive correlated with BMI (0.343; P< 0.05), H. Pylori IgG (0.678; P < 0.001), TNF-α (0.778; P < 0.001), IL-18 (0.709; P < 0.001) and IL-23 values (0.715; P < 0.001) (Figure ).
Figure 2. Correlations between H. Pylori IgG level with (A) BMI, (B) HbA1c, (C) TNFα, (D) IL-18, (E) IL-23, and (F) IL-35 values among metformin plus glimepiride treated group. Correlation was significant ** at the 0.01 level, *** at the 0.001 level. IL; interleukin, BMI: body mass index, TNF-α.; tumour necrosis factor-alpha, HbA1c: glycated hemoglobin.
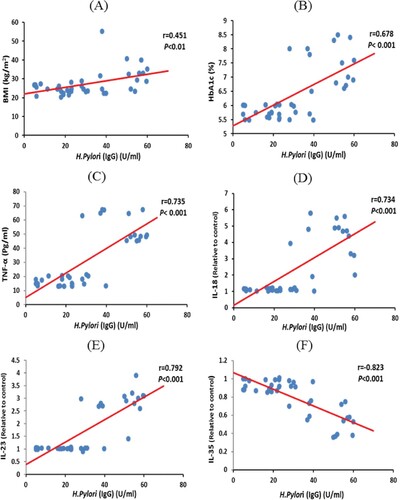
Figure 3. Correlations between HbA1c% with (A) BMI, (B) H. Pylori-IgG, (C) TNF-α, (D) IL-18, (E) IL-23, (F) IL-35 values among metformin plus glimepiride treated group. Correlation was significant * at the 0.05 level, *** at the 0.001 level. TNF-α.; tumour necrosis factor-alpha, HbA1c: glycated hemoglobin, IL; interleukin, BMI: body mass index.
4. Discussion
Few published articles have been discussed the influence of cytokines in the glycemic status of T2DM patients with coincidental H. pylori infection. Thus, our study investigates the relationship between three proinflammatory cytokines (TNF-α, IL-18, and IL-23) plus one anti-inflammatory cytokine (IL-35) and H. Pylori infection in T2DM patients. Several studies showed a noticeable association between infection of H. pylori and insulin resistance, as well as T2DM [Citation11,Citation16]. Chronic low-grade inflammation leads to insulin resistance and T2DM. In metabolic tissues, the aggregation of active innate immune-cells ultimately leads to the activation of pro-inflammatory cytokines such as IL-1β and TNFα, which induce insulin resistance and β-cell injury [Citation17]. Interestingly, H. pylori intestinal lipopolysaccharides were correlated with the stimulation of Toll-like receptors, resulting in energy harvesting, fat deposition and activate the innate immune system which inducing insulin resistance [Citation18]. Regarding the current investigation, H. Pylori infection of diabetic patients showed a positive correlation with HbA1c% (the marker of glycemic status). Treatments of diabetic patients with antidiabetic drugs (metformin mono-and dual therapies) decrease markedly the elevated levels of HbA1c% compared to the diabetic non-treated group. Notably, in parallel with the current results, Hsieh et al. [Citation19] concluded that chronic H. Pylori infection was associated with the increase in HbA1c% and the higher incidence of T2DM. One possible mechanism which could clarify the association between HbA1c% and H. Pylori infection was linked to H. pylori activity in the metabolic homeostasis of the host through influencing the gastric hormones like leptin and ghrelin [Citation20]. H. pylori infection significantly increased plasma leptin levels, while plasma ghrelin levels were significantly lower than that of H. pylori-negative patients [Citation21]. Leptin concentrations showed correlation with insulin level and the degree of insulin sensitivity which reflect the role of leptin in the pathophysiology of insulin resistance and T2DM [Citation22]. Moreover, leptin levels elevation can induce a chronic sub-inflammatory state that can play a central role in the development of the hyperglycemic state [Citation23]. Notably, leptin also is highly effective in normalizing fasting plasma glucose in animal models of T2DM [Citation24] and greatly improves insulin sensitivity, hyperglycemic state and restored glucose homeostasis in lipodystrophic humans [Citation25].
The current study showed that TNF-α protein level exhibited a significant (P<0.001) increase in diabetic non-treated patients compared with the healthy group. However, treatment with antidiabetic therapies showed depletion in cytokine levels relative to diabetic controls. Furthermore, positive correlations between TNF-α level and each of H. Pylori infection and HbA1c% were recorded. TNF-α is one of the key pro-inflammatory cytokines that contribute to the development of insulin resistance and T2DM through activating low-grade inflammation by releasing a number of molecular mediators. Also, TNF-α decreases the glucose transporter-4 (GLUT4) and serine phosphorylation expression of insulin receptor substrate-1 (IRS-1) which are key enzymes for insulin synthesis [Citation26]. The correlation between H. Pylori infection and inflammatory cytokines was demonstrated by several investigations. Notably, in parallel to the current results, H. Pylori infection caused elevation in the levels of serum TNF-α [Citation27]. Also, nuclear factor (NF)-κB (regulating inflammatory responses) has increased markedly with increase in the secretion of TNF-α in H. pylori-associated gastritis [Citation28]. Interestingly, numerous inflammatory biomarkers including, interleukins, TNF-α and NF-κB, could be used to monitor the development of gastritis and help to develop novel anti-inflammatory drugs [Citation29].
Moreover, IL-18, one of the IL-1 superfamily cytokine, regulates innate and acquired immune response and is functionally related to enhancing IFN-γ formation in natural killer cells and CD4 T help 1 lymphocyte. Also, IL-18 attenuates the response of cells Th2 and Th17 and the behaviour of CD8 cytotoxic cells [Citation30]. Sakai et al. [Citation13] revealed that H. pylori infection stimulates the secretion of IL-18 in the gastric mucosa causing severe inflammation in the stomach. Additionally, in biopsies of patients infected with H. pylori, the expression of IL-18 was markedly increased compared with healthy individuals. Also, IL18 expression can be used as a biomarker of the efficacy of treatments on H. pylori eradication [Citation29]. Elevated concentrations of IL-18 are correlated with increased risk of diabetes, independently from obesity, adipokine levels and increased concentration of proinflammatory cytokines [Citation5]. Interestingly, in accordance with our results, Ballak et al. [Citation31] exhibited that plasma IL-18 levels have been increased noticeably in obese and T2DM patients. Furthermore, recently diagnosed T2DM patients reported higher levels of IL-18 relative to healthy individuals [Citation32]. In this regard, the present work showed a noticeable increase in blood IL-18 mRNA expression of diabetic patients compared with healthy controls. Furthermore, IL-18 expression showed a positive correlation with H. Pylori infection and HbA1c% in T2DM patients. Importantly, our data revealed that treatment with anti-hyperglycemic therapies showed depletion in IL-18 mRNA expression relative to diabetic control which reflecting the close relationship between hyperglycemia and IL-18 mRNA expression.
The pro-inflammatory cytokines of Th17 cells (like IL-17, IL-22, and IL-23) have a vital role in the infection of H. pylori as well as gastritis. Actually, IL-23 affects both T cells and non-T cell types with subsequent stimulating inflammatory processes, as well as to induce Th17 cell expansion [Citation33]. In the current study, IL-23 expression had the same pattern of IL-18 expression through increase blood IL-23 mRNA expression obviously in diabetics compared with the healthy group. However, administration of the antidiabetic drugs induced a significant reduction in IL-23 expression compared with diabetic controls. Also, IL-23 expression was correlated positively with H. Pylori infection and HbA1c% in T2DM patients. In consistence with the present findings, Fatima et al. [Citation34] concluded that blood IL-23 expression of aged T2DM patients had been increased significantly compared with healthy subjects. Also, IL-23 expression mediated in dendritic cells and macrophages after co-culture with H. pylori was increased obviously in humans and animal models after H. pylori infection [Citation35]. Hasnain et al. [Citation7] reported that antibody neutralization of IL-23 or IL-24 partially reduced β-cell endoplasmic reticulum stress and improved glucose tolerance in obese mice. Consistently, a substantial increase in IL-23 level and TNF-α expression in H. pylori-seropositive patients have been recorded; confirming the contribution of Th-17 cells in the pathophysiology of H. pylori infection and gastric inflammation [Citation36]. Furthermore, IL-23 has expressed markedly in gastric mucosa infected with H. pylori, which could help to maintain the production of IL-17[Citation37]. Notably, Franco et al. [Citation38] concluded that substantially higher concentrations of pro-inflammatory cytokines have been identified in poorly controlled diabetic patients, suggesting that glycemic status can be impacted the immune response. The influence of proinflammatory cytokine, TNF-α, IL-18 and IL-23 in T2DM with H. pylori infection are demonstrated in the current study. Actually, the regulate pathways of IL-18 and IL-23 expression in T2DM-H. pylori patients, however, need further study.
IL-35 is an anti-inflammatory and immunosuppressive cytokine, produced by T regulatory cells, can regulate inflammatory responses during infections [Citation39]. In addition, the anti-inflammatory activity of IL-35 is conducted by enhancing regulatory B cells, and inhibiting macrophages and effector T cells [Citation40]. Consistently, diminished IL-35 is primarily associated with chronic infection [Citation41] and type 1 diabetes mellitus [Citation42]. Also, a low concentration of IL-35 was influenced in the progression of peptic ulcer of patients infected with H. pylori [Citation43]. However, IL-35-mediated downregulation is effective to inhibit developed β-cell autoimmunity and encourage the use of IL-35 in T1DM treatment and other T-cell-mediated autoimmune diseases [Citation44]. Importantly, the relation between IL-35 and T1DM was studded previously, but the studies addressed the relationship between IL-35 and T2DM or H. pylori were scarce. The present study showed a significant depletion in blood IL-35 mRNA expression in diabetic non-treated patients, while treatment with the antidiabetic therapies increased significantly IL-35 mRNA expression compared with diabetic controls. Additionally, IL-35 mRNA expression showed a negative correlation with infection of H. Pylori and HbA1c% in T2DM patients. The anti-inflammatory immunosuppressive activity of IL-35 can alleviate metabolic and infectious diseases. Therefore, further investigations are required to understand the role of IL-35 in the pathophysiology and treatment of T2DM and other inflammatory diseases. Also, understanding the role of cytokines; TNF-α, IL-23, and IL-18, in pathogenicity of T2DM and H. pylori infection has been crucial in creating novel anti-inflammatory agents for T2DM complications and infectious diseases.
One limitation of the current study is related to the number of patients in each group. The other limitation is lacking determination of other related novel proinflammatory cytokines and duration of treatments of each drug-related to diabetic or H. pylori infection.
In conclusion, this study offers new insights into the mechanisms of inflammatory processes related to T2DM pathophysiology. The results confirmed the highly prevalent of H. pylori infection among T2DM patients relative to the healthy group. Treatment with metformin mono-and dual therapies decreased significantly the circulating levels of proinflammatory cytokines which reflect their anti-inflammatory potential in addition to their hypoglycemic action. The anti-inflammatory-immunosuppressive properties of IL-35 may help researchers to suggest effective therapy for mitigating infectious and metabolic diseases.
Disclosure statement
No potential conflict of interest was reported by the author(s).
References
- Vieira R, Souto SB, Sánchez-López E, et al. Sugar-Lowering drugs for Type 2 diabetes mellitus and metabolic syndrome-review of classical and new compounds: part-I. Pharmaceuticals (Basel). 2019;12(4):152. doi:10.3390/ph12040152.
- Saeedi P, Petersohn I, Salpea P, et al. Global and regional diabetes prevalence estimates for 2019 and projections for 2030 and 2045: results from the International diabetes federation diabetes Atlas, 9th edition. Diabetes Res Clin Pract. 2019;157:107843. doi:10.1016/j.diabres.2019.107843.
- Francisco CO, Catai AM, Moura-Tonello SC, et al. Cytokine profile and lymphocyte subsets in type 2 diabetes. Braz J Med Biol Res. 2016;49(4):e5062. doi:10.1590/1414-431X20155062.
- Hivert MF, Sullivan LM, Fox CS, et al. Associations of adiponectin, resistin, and tumor necrosis factor-α with insulin resistance. J Clin Endocrinol & Metab. 2008;93(8):3165–3172.
- Hivert MF, Sun Q, Shrader P, et al. Circulating IL-18 and the risk of type 2 diabetes in women. Diabetologia. 2009;52(10):2101–2108.
- Kalninova J, Jakus V, Glejtkova M, et al. Impact of glycemic control on advanced glycation and inflammation in overweight and obese patients with type 2 diabetes mellitus. Bratisl Lek Listy. 2014;115(8):457–468. doi:10.4149/bll_2014_089.
- Hasnain SZ, Borg DJ, Harcourt BE, et al. Glycemic control in diabetes is restored by therapeutic manipulation of cytokines that regulate beta cell stress. Nat Med. 2014;20(12):1417–1426.
- Yan A, You H, Zhang X. Levels of interleukin 27 and interleukin 35 in the serum and Vitreous of patients with proliferative diabetic retinopathy. Ocul Immunol Inflamm. 2018;26(2):273–279.
- World Gastroenterology Organisation. World gastroenterology organisation global guideline: Helicobacter pylori in developing countries. J Clin Gastroenterol. 2011;45(5):383–388.
- Kayar Y, Pamukçu Ö, Eroğlu H, et al. Relationship between Helicobacter pylori infections in diabetic patients and inflammations, metabolic syndrome, and complications. J Int Chronic Dis. 2015;2015:290128. doi:10.1155/2015/290128.
- Rafat MN, Azeem HA, Antably A, et al. Prevalence of Helicobacter pylori infection in patients with type 2 diabetes mellitus. AAMJ. 2015;13:4.
- Hosseininasab Nodoushan SA, Nabavi A. The Interaction of Helicobacter pylori infection and Type 2 diabetes mellitus. Adv Biomed Res. 2019;8:15. doi:10.4103/abr.abr_37_18.
- Bagheri N, Taghikhani A, Rahimian G, et al. Association between virulence factors of helicobacter pylori and gastric mucosal interleukin-18 mRNA expression in dyspeptic patients. Microb Pathog. 2013;65:7–13.
- Mentis A, Lehours P, Mégraud F. Epidemiology and diagnosis of Helicobacter pylori infection. Helicobacter. 2015;20(1):1–7.
- Livak KJ, Schmittgen TD. Analysis of relative gene expression data using real-time quantitative PCR and the 2(-Delta Delta C(T)) method. Methods. 2001;25(4):402–408.
- Gen R, Demir M, Ataseven H. Effect of Helicobacter pylori eradication on insulin resistance, serum lipids and low-grade inflammation. South Med J. 2010;103:190–196.
- Odegaard JI, Chawla A. Connecting type 1 and type 2 diabetes through innate immunity. Cold Spring Harb Perspect Med. 2012;2(3):a007724. doi:10.1101/cshperspect.a007724.
- Manco M, Putignani L, Bottazzo GF, et al. Lipopolysaccharides, and innate immunity in the pathogenesis of obesity and cardiovascular risk. Endocr Rev. 2010;31(6):817–844.
- Hsieh MC, Wang SW, Hsieh YT, et al. Helicobacter pylori infection associated with high HbA1c and type 2 diabetes. Eur J Clin Inves. 2013;43(9):949–956.
- Francois F, Roper J, Joseph N, et al. The effect of H. pylori eradication on meal associated changes in plasma ghrelin and leptin. BMC Gastroent. 2011;11:37.
- Kasai C, Sugimoto K, Moritani I, et al. Changes in plasma ghrelin and leptin levels in patients with peptic ulcer and gastritis following eradication of Helicobacter pylori infection. BMC Gastroenterol. 2016;16(1):119.
- Taghdir M, Djazayeri A, Djalali M, et al. Relationships of serum leptin concentration with insulin, glucose, HbA1c levels and insulin resistance in overweight post-menopausal diabetic women. ARYA Atheroscler J. 2010;5(4):175–180.
- Sarr O, Strohm RJ, MacDonald TL, et al. Subcutaneous and visceral adipose tissue secretions from extremely obese men and women both acutely suppress muscle insulin signaling. Int J Mol Sci. 2017;18(5):pii: E959.
- Cummings BP, Bettaieb A, Graham JL, et al. Subcutaneous administration of leptin normalizes fasting plasma glucose in obese type 2 diabetic UCD-T2DM rats. Proc Natl Acad Sci U S A. 2011;108(35):14670–14675.
- Oral EA, Simha V, Ruiz E, et al. Leptin-replacement therapy for lipodystrophy. N Engl J Med. 2002;346(8):570–578.
- Akash MSH, Rehman K, Liaqat A. Tumor necrosis factor-alpha: role in development of insulin resistance and Pathogenesis of Type 2 diabetes mellitus. J Cell Biochem. 2018;119:105–110.
- Russo F, Jirillo E, Clemente C, et al. Circulating cytokines and gastrin levels in a symptomatic subject infected by Helicobacter pylori. Immunopharmacol Immunotoxicol. 2001;23(1):13–24.
- Tang CL, Hao B, Zhang GX, et al. Helicobacter pylori tumor necrosis factor-α inducing protein promotes cytokine expression via nuclear factor-κB. World J Gastroenterol. 2013;19(3):399–403.
- Agarwal BB, Shishodia S, Sandur SK, et al. Inflammation and cancer: how hot is the link? Biochem Pharmacol. 2006;72:1605–1621.
- Wawrocki S, Druszczynska M, Kowalewicz-Kulbat M, et al. Interleukin 18 (IL-18) as a target for immune intervention. Acta Biochim Pol. 2016;63(1):59–63.
- Ballak DB, Stienstra R, Tack CJ, et al. IL-1 family members in the pathogenesis and treatment of metabolic disease: focus on adipose tissue inflammation and insulin resistance. Cytokine. 2015;75:280–290.
- Esposito K, Nappo F, Giugliano F, et al. Cytokine milieu tends toward inflammation in type 2 diabetes. Diabetes Care. 2003;26:1647. doi:10.2337/diacare.26.5.1647.
- Sedda S, Bevivino G, Monteleone G. Targeting IL-23 in Crohn's disease. Expert Rev Clin Immunol. 2018;14(11):907–913.
- Fatima N, Faisal SM, Zubair S, et al. Emerging role of interleukins IL-23/IL-17 axis and biochemical markers in the pathogenesis of Type 2 diabetes: association with age and gender in human subjects. Int J Biol Macromol. 2017;07:155.
- Horvath DJ Jr, Washington MK, Cope VA, et al. IL-23 Contributes to control of chronic Helicobacter pylori infection and the development of T Helper responses in a Mouse Model. Front Immunol. 2012;3:56.
- Arachchi PS, Fernando N, Weerasekera MM, et al. Proinflammatory cytokine IL-17 shows a significant association with Helicobacter pylori infection and Disease Severity. Gastroenterol Res Pract. 2017;2017:6265150. doi:10.1155/2017/6265150.
- Caruso R, Fina D, Paoluzi OA, et al. IL-23-mediated regulation of IL-17 production in Helicobacter pylori-infected gastric mucosa. Eur J Immunol. 2008;38(2):470–478.
- Franco MM, Moraes MM, Daurte PM, et al. Glycemic control and the production of cytokines in diabetic patients with chronic periodontal disease. RGO Rev Gaúch Odontol. 2015;63(4):432–438.
- Huang A, Cheng L, He M, et al. Interleukin-35 on B cell and T cell induction and regulation. J Inflamm. 2017;14:16.
- Hu D. Role of anti-inflammatory cytokines IL-35 and IL-37 in asthma. Inflamm. 2017;40:697–707.
- Bello RO, Chin VK, Abd Rachman IMF, et al. The role, involvement and function(s) of interleukin-35 and interleukin-37 in Disease Pathogenesis. Int J Mol Sci. 2018;19(4):1149.
- Singh K, Kadesjö E, Lindroos J, et al. Interleukin-35 administration counteracts established murine type 1 diabetes–possible involvement of regulatory T cells. Sci Rep. 2015;5:12633. doi:10.1038/srep12633.
- Bassagh A, Abasi MH, Larussa T, et al. Diminished circulating concentration of interleukin-35 in Helicobacter pylori-infected patients with peptic ulcer: Its association with FOXP3 gene polymorphism, bacterial virulence factor CagA, and gender of patients. Helicobacter. 2018;23:e12501. doi:10.1111/hel.12501.
- Manzoor F, Johnson MC, Li C, et al. β-cell-specific IL-35 therapy suppresses ongoing autoimmune diabetes in NOD mice. Eur J Immunol. 2017;47(1):144–154.