
Abstract
The integration of remotely sensed data allowed the successful characterization of the hydrothermal alteration zones of the Abu–Gaharish area in the Central Eastern Desert of Egypt using image transformation techniques. The integration of several evidential maps highlighted the plausible areas with high concentrations of argillic and phyllic, key hydrothermal minerals that reflect the intensity of hydrothermal effects and the probable sites of ore bodies. The excellent prospective zone identified in the map occupies around 1.39% of the study area. Kaolinite–smectite minerals with correlation scores of around 0.97 were consistent with areas of hydrothermal alteration and mining activities; however, propylitic minerals were confined to basic metavolcanics and serpentinites. The resulting predictive map was assessed using existing mining data with significant consistency; therefore, field verification is essential. The overall results showed that remotely sensed data represent a valuable mapping tool for geological and mineral resources reconnaissance in the arid regions
1. Introduction
Satellite remote sensing provides valuable spatial and temporal information on the Earth's resources. Since NASA’s first Landsat satellite was launched in 1972, key advances have been made in the field of geological reconnaissance. Mineral resources originating from hydrothermal activity have been identified using remotely-sensed data. The variable spatial, radiometric, and spectral resolution of modern remote sensing data presents opportunities for targeting potential areas for new mineral prospects [Citation1–9]. Hydrothermal activity occurring through fracture/fault zones modifies the physical and chemical properties of the country rock [Citation10]. The characterization of hydrothermal alteration zones (HAZs) and their grade is important for identifying potential areas of mineral resources [Citation1,Citation11–13], as the metals have a tendency to occur in the most highly altered rocks [Citation10].
Several studies have been performed using optical Near Infrared (NIR) and Shortwave Infrared (SWIR) remote sensing data to identify HAZs [Citation12,Citation14,Citation15,Citation2,Citation16–21]. Landsat data have long been successfully employed for locating HAZs [Citation12,Citation15,Citation22,Citation23]. However, the launch of the Advanced Spaceborne Thermal Emission and Reflection Radiometer (ASTER) satellite in 1999 allowed the identification of key hydrothermal minerals [Citation5,Citation8,Citation18,Citation20,Citation21,Citation24]. Compared to other multispectral data, the spectral, spatial and radiometric resolution of ASTER data is superior [Citation8,Citation25,Citation26].
In the last two decades, ASTER data have been successfully used to identify HAZs for mineral resources prospecting [Citation1,Citation3,Citation8,Citation20,Citation21,Citation27–32]. As ASTER was the first multispectral spaceborne sensor capable of identifying OH-bearing minerals using its 14 spectral bands, particularly those minerals within the SWIR region [Citation8,Citation9,Citation25], the characterization of key hydrothermally altered mineral assemblages and the definition of the geometry of the HAZs using ASTER data was found to be effective for identifying potential areas of mineral resources [Citation8,Citation31,Citation33]. SWIR data has allowed the identification of specific categories of hydrothermal minerals, such as phyllosilicates, clays, carbonates, and sulfates, depending on their spectral signatures [Citation9].
Several approaches, such as principal component analysis (PCA), the use of band ratios, relative absorption band depth (RBD; [Citation34]) and mineral indices [Citation2,Citation16,Citation27], and spectral analysis have been employed to analyse multispectral data. Band ratios have been used to analyse the spectral characteristics between bands and to minimize topographic influences [Citation14,Citation15,Citation28,Citation35,Citation36]. Hydrothermally altered mineral assemblages can be categorized based on the intensity of the hydrothermal activity [Citation8,Citation28,Citation31–33,Citation37]. Sub-pixel spectral classifications can therefore be assigned to specific key hydrothermal minerals that relate to propylitic (epidote, chlorite, calcite), phyllic (muscovite, sericite, illite), argillic (montmorillonite, kaolinite, dickite), and advanced argillic (alunite–pyrophyllite) zones of alteration.
Geographic Information System (GIS) tools have been used to produce integrative maps through digital overlay methods [Citation8,Citation38,Citation39]. Knowledge-driven approaches integrating multicriteria decision-making depending on expert judgement have also been used to produce predictive maps [Citation40–42]. Such approaches employs ranked binary evidential maps. Several evidential maps can therefore be combined to obtain prospective maps [Citation41].
In this study, we tested the application of these data and remote sensing approaches for the identification of HAZs in the study area of the Central Eastern Desert (CED), which is characterized by a dry environmental setting and a lack of vegetation. As no remote sensing exploration information is available regarding the Abu–Gaharish Au–Cu–W prospect, the analysis of ASTER data was necessary to enable the future mapping of the spatial distribution of HAZs in the area, as well as the identification of the key hydrothermal minerals indicating the nature of the mineral resources prospects.
2. Geological setting of the study area
The Abu–Gaharish area belongs to the Arabian–Nubian Shield (ANS), which covers approximately 53 km2 from northeast Africa to Arabia, between the latitudes 26°21′16.45′′ and 26° 25′19.53′′ N, and longitudes 33° 36′ 25.94′′ and 33° 40′ 50.43′′ E (Figure ). The study area is located south of the boundary between the North Eastern Desert (NED) and the Central Eastern Desert (CED) of Egypt (Figure a). This belt is composed of Neoproterozoic island-arc volcanic and volcano-sedimentary rocks, which are part of an ophiolitic complex that was intruded by granitoids.
Figure 1. (a) Location of the study area within the CED of Egypt (red box). The Arabian–Nubian Shield is coloured in light red. (b) Geological map of the study area (after [Citation43]) showing the main lithological units.
![Figure 1. (a) Location of the study area within the CED of Egypt (red box). The Arabian–Nubian Shield is coloured in light red. (b) Geological map of the study area (after [Citation43]) showing the main lithological units.](/cms/asset/ef7a5a99-6675-4438-9555-f1473df34ef6/tusc_a_1825184_f0001_oc.jpg)
The geological map of Conoco [Citation43] shows that the study area comprises mainly calc-alkaline granitoids, named “Older Granites (750–610 Ma; [Citation44,Citation45])” and “Younger Granites” (610–550 Ma; [Citation45–47]). The “Younger” or “Pink Granites” intruded the ophiolitic rocks, the volcano–sedimentary rocks, as well as acidic to intermediate metavolcanics and their associated pyroclastics. The Abu–Gaharish granitic rocks occupy the majority of the study area and display both NE–SW and NW–SE trends. Based on geochemical and petrographic examination carried out by Aton [Citation48], the granite pluton represents a late post-orogenic highly evolved phase of magmatic stage that is rich in Nb, W, Ta, Snand U. The pluton is crosscut by rhyolitic and aplitic dikes along with quartz veins trending NE-SW.
Mining activity has taken place during the New Kingdom 16th century BC and the 11th century BC in the study area and mining boreholes exist in various parts [Citation49]. At present, Aton Company discovered new Au (±W-Cu) mineralization at north Abu Abu–Gaharish [Citation50]. These new zones in the north extend along the eastern contact of the Gaharish granite over a strike length > 5 km in length. Such surface mineralized zone contains visible gold associated with quartz veins [Citation50] which affected by structural discontinuities, including shearing. The gold mineralization zones at Abu Gaharish are strongly structurally controlled. Noteworthy, the mineralization in the northern part that comprise plausible amount of auriferous W-Bi-Cu bearing quartz veins is consistent to areas of extensively phyllic to argillic alteration zones that most likely consist of felsic volcanics in contact with the Abu-Gaharish granite and extends along the granitic contact (NNE-SSW, NE-SW). The contact between the granite pluton of Abu-Gaharish and metavolcanic rocks to east also contain Au (±W-Bi) mineralization and the granite pluton itself as well through sheeted veins of quartz. The mineralization zone that extends NE through metavolcanics is rich in W (wolframite and scheelite); however, many areas at north and west of the main mineralization zone are rich in gold.
The southern area hosts two prospects, including the main zone. In the last few decades, tungsten ores such as scheelite and wolframite have been exploited in Abu–Gaharish quartz veins. The areas of mineralization are also located close to the contact zone between the coarse-grained pink granite stocks and the Hammamat wall rock [Citation49]. Noteworthy, the Hammamat clastics (610–585 Ma; [Citation51]) comprise siltstones, greywacke and siltstones and conglomerates greywacke that were affected by contact metamorphism. Noteworthy, the wadi sediments cover wide parts of the pluton, so the granites appear like granitic “islands”. The Aton [Citation1] report revealed mineralization in this granite and below the wadi sediments using Ground Penetration Radar (GPR) geophysical survey.
3. Data and methods
In this study, we used Landsat-8 Operational Land Imager (OLI) data, which consists of visible near infrared (VNIR), shortwave infrared (SWIR), and thermal infrared (TIR) data. Six bands, including bands 2, 3, 4, 5, 6, and 7, with a 30 m resolution, were processed and combined. Band ratios 7/5, 4/5 and 6/7 were utilized to characterize the lithologies and hydrothermally altered areas.
ASTER data was collected on-board the TERRA spacecraft in December 1999 by NASA and METI (the Ministry of Economic Trade and Industry of Japan). The spectral channels of ASTER were acquired from the NASA Land Processes Distributed Active Archive Center (LP DAAC). Three categories of spectral information were collected, including three VNIR bands, six SWIR bands and four TIR bands. The SWIR bands were transformed into valuable information using ENVI v.5.4. The ASTER SWIR spectral bands that recorded electromagnetic radiation between the wavelengths of ∼1.60 and 2.45 µm were used to discriminate between the absorption signatures of different groups of hydrothermal minerals, including Fe/Mg-OH, Al-OH, and CO3 [Citation26].
One scene from the ASTER cloud-free level (in HDF file format, 1B bands acquired on 7 October 2007) was analysed in the area of interest. This level of processed radiance recorded at the sensor (in Wm−2·sr−1·µm−1) is derived from level 1A by correcting the geometric distortion and applying the radiometric coefficient. The pre-processing step included cross-talk improvements and orthorectification of bands. The data was geo-registered to zone 36 of the Universal Transverse Mercator (UTM) World Geodetic System 1984 (WGS84) using ENVI software. In order to standardize and minimize the disturbances due to the atmosphere, altitude, sensors and sun radiance, a log-residual algorithm was applied to the SWIR bands [Citation20,Citation52]. This allowed the composition of the target rock units to be identified from the data, by matching the defined endmembers to known signatures from the spectral library of the United States Geological Survey (USGS). This procedure was followed to define the hydrothermal alteration minerals in the study area using SWIR data for mineral characterization [Citation8,Citation20,Citation31,Citation53].
False colour combination methods, PCA, band ratios, and spectral analysis were used to delineate the zones of hydrothermal alteration using ENVI 5. The PCA approach is a statistical method used to transform a number of related spectral bands into a smaller number of uncorrelated spectral channels. This approach has frequently been applied for detecting HAZs [Citation1,Citation18,Citation32] and was employed to identify which PC image could be used to predict the occurrence of specific minerals, on the basis of loading eigenvectors of the particular spectral channels. Mineral indices such as the OH-bearing altered minerals Index (OHI), and the Kaolinite Index (KAI), [Citation2,Citation16] were extracted using the ASTER Level-1B radiance from the sensor data, as follows: OHI = [band 7/band 6] × [band 4/band 6]; and, KAI = [band 4/band 5] × [band 8/band 6].
The identification of minerals was performed by sub-pixel spectral mapping to distinguish mixed pixels from rejected pixels. Through this approach, the minerals present were defined from the map on the basis of the spectral signature of the end-member, by matching with the signatures of reference minerals in the spectral library [Citation18,Citation20]. The Minimum Noise Fraction (MNF) transformation [Citation54] was applied to obtain a pixel purity index in order to extract the highest number of spectrally pure pixels from the input MNF data. These results were used to define end-members using multidimensional visualization for spectral classification, to guide the mineral characterization.
The Shuttle Radar Topography Mission (SRTM) consisted of an interferometric radar system that flew onboard the space shuttle Endeavour during an 11-day mission in February 2000 ([Citation55,Citation56]). The recording wavelength was around 5.6 cm. The mission produced a high-quality global digital elevation model (DEM) at a resolution of 1 arc second (∼30 m). This DEM was used in this study to visualize the topography of the terrain and extract the lineaments cutting through the area. A hillshaded relief image derived from the SRTM was extracted using Arc GIS v.10.5 software to highlight the lineaments of interest. A sun azimuth of 315° and an altitude angle of 30° were applied to the DEM to visualize the terrain.
The processed data were georeferenced to zone 36 of the Universal Transverse Mercator (UTM) World Geodetic system 1984 (WGS 84) and saved, visualized and combined using ArcGIS v.10.5.
4. Results
4.1. Remote sensing
Using Kufman Landsat-8 OLI band ratios 7/5, 5/4, 6/7 in R, G, and B, respectively, the granitoids rocks were revealed in cyan; the metavolcanics (MV) in reddish-orange; the basic metavolcanics, serpentinites (Sp), and metasediments (MS) in blue; and the areas of hydrothermal alteration in light cyan (Figure a). The intrusive basic rocks to the south and north of the granitoid pluton were most likely depicted in blue colour with rounded boundaries. Band ratio 6/7 highlighted the OH-bearing minerals, such as kaolinite–smectite, micas and amphiboles [Citation36], whereas band ratios 7/5 and 5/4 revealed the iron-rich lithologies. These band ratios allowed the distinction between the granitoids and the surrounding rocks (Figure a).
Figure 2. (a) Band ratios 7/5, 5/4 and 6/7 in R, G and B characterize the granites in cyan, metavolcanics (MV) in red, metasedimens (MS) and Serpentinites (Sp) in blue; (b) SRTM DEM (with 30 m spatial resolution) showing the boundary of the Abu–Gaharish granitic pluton (dashed line); (c) Hillshade relief map following the application of a sun azimuth of 315° and an altitude angle of 30o; (d) Lineament density map overlain with lineament/fault line traces (black lines).
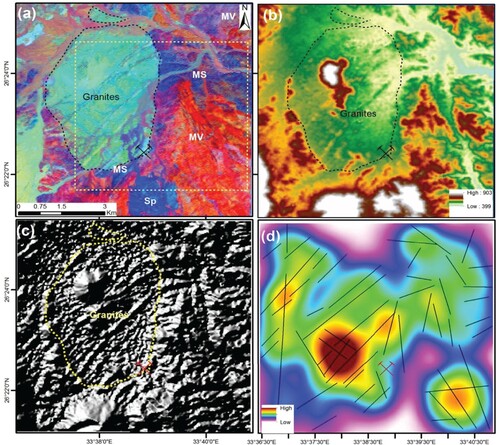
Data processing and interpretation of the SRTM DEM revealed topographic features that range from ∼400 to 900 m above sea level in the study area (Figure b). The maximum elevations are associated with metavolcanics, serpentinites, and metasediments (MS) as well as the northwestern part of the granitic pluton, the southern part of the metavolcanics/serpentinites (Sp), and the metasediments that surround the Abu–Gaharish granites. The results of the hillshade analysis improved the visualization of boundaries and emphasized the topographic characteristics of the lineaments in the area (Figure c). These lineaments mainly trend NE–SW and comprise fractures/fault zones and dikes of felsic and mafic composition. The lineament density map shows that the lineaments predominantly occur within the Abu–Gaharish granites compared to the surrounding rock units (Figure d).
Particular band ratios of ASTER data were used to characterize the lithologies, HAZs and mineral composition of the rocks in the study area. Applying the KAI [Citation2], MNF3 and band ratios 7/6 revealed areas of hydrothermal alteration in white tones that dominates the central part of the image, the northwest corner, and the gold mining area (Figure a). The pink colour indicated the granitoids and the dark blue colour indicated the basic metavolcanics. Band ratio 7/6 was used to identify zones enriched in white mica (sericite). The results of this combination of band ratios were subdivided into six classes based on the grade of the hydrothermal alteration (Figure b), with six representing a high grade and one representing low grade alteration. The resulting map shows areas of potential hydrothermal alteration in red (Figure b).
Figure 3. Images showing the results of various combinations of band ratios. (a) KAI, MNF3 and 7/6 in R, G and B; (b) Categorization of combined KAI, MNF3 and 7/6 ratio; (c) MNF3, 4/6 and 7/6 in R, G and B; (d) Categorization of combined MNF3, 4/6 and 7/6 ratios; (e) 5 + 7/6, OHI and KAI in R, G and B; (f) Categorization of combined 5 + 7/6, OHI and KAI values; (g) 4/5, 4/7 and 4/6 in R, G and B; (h) Categorization of combined 4/5, 4/7 and 4/6 values; (i) Negated PC3 (of bands 5, 6, 7), PC2 (of bands 4, 5, 6) and band 4; (j) Categorization of combined negated PC3 (of bands 5, 6, 7), PC2 (of bands 4, 5, 6) and band 4 values; (k) (5 + 7)/6, (4 × 7)/(8 × 8) and (4 + 6)/5 in R, G and B; (l) Categorization of combined (5 + 7)/6, (4 × 7)/(8 × 8) and (4 + 6)/5 values.
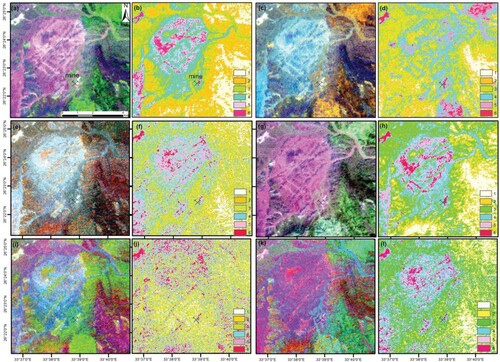
The combination of band ratios MNF3, 4/6 and 7/6 in R, G, and B, respectively, highlighted the contrast between hydrothermally altered and unaltered rocks (Figure c). The highest values of band ratios 4/6 and 7/6 indicated phyllic zones [Citation26], with high grade hydrothermal alteration shown in white. These areas are located in the northeast and northwest corners of the study area as well as in the south. Band ratio 7/6 was used to identify zones enriched in white mica. The results of this analysis were classified into six grades of hydrothermal alteration (Figure d).
In order to discriminate between potential areas of argillic and phyllic alteration, band ratio 5 + 7/6, OHI and KAI were combined in R, G and B. This allowed areas enriched in aluminum hydroxide (Al-OH) minerals to be identified, via band ratio 5 + 7/6, as shown in white in Figure (e). The categorization of these combined values showed that the areas of higher hydrothermal alteration are consistent with structural features associated with granitic rocks (Figure f).
The combination of band ratios 4/5, 4/7, and 4/6 in R, G, and B, allowed the identification HAZs as well as the discrimination of granites, metavolcanics, and serpentinites (in pink, green, and cyan, respectively, Figure g). Band ratios 4/5 and 4/7 clearly improved the recognition of argillic and phyllic alteration, respectively [Citation9]. The categorization of these combined values into six grades of alteration is shown in Figure (h). The results of this combination are very similar to the composite of KAI, MNF3 and 7/6 (Figure a).
Bands 4, 5, and 6 were selected for principal component analysis for argillic alteration mapping. The obtained eigenvector values of the selected band transformation process are shown in Table . The analysis of eigenvector loadings showed that PC2 reflects a positive loading of band 4 (0.329) and a negative loading of bands 5 (−0.630628) and 6 (−0.702617). This observation is consistent with the existence of kaolinite and alunite, which are the dominant argillic alteration minerals that usually display negative signatures in ASTER bands 5 and 6.
Table 1. Selective principal component analysis of argillic and phyllic zones.
Bands 5, 6, and 7 were used to characterize phyllic alteration zones through PCA, and the eigenvector loadings are listed in Table . The eigenvector loadings for band 6 are positive (0.653785), whereas the loadings for band 5 are negative (−0.7502) and band 7 has a very small positive loading close to zero (0.098815). This analysis shows that the phyllic zone, consisting of illite/muscovite (sericite), is marked by a significant negative Al-OH signature in ASTER band 6. Phyllic alteration zones are therefore displayed in the darkest pixels. These pixels can be inverted to be bright by multiplying by −1.
The contrast between metasediments and metavolcanics was highlighted by the combination of the negated PC3 of bands 5, 6, and 7, PC2 of bands 4, 5, and 6, and band 4 of the ASTER data (Figure i). Several zones of mixed argillic and phyllic alteration were observed in the southeastern and northwestern parts of the study area, which could represent potential prospective zones. The categorization of these combined values into six grades of hydrothermal alteration is shown in Figure (j).
The band operation (4 × 7)/(8 × 8) was used to emphasize areas with both argillic and phyllic alteration [Citation9] whereas operation (4 + 6)/5 highlighted argillic areas rich in kaolinite [Citation57]. Operation (5 + 7)/6 was used as an indicator for phyllic alteration. The combination of (5 + 7)/6, (4 × 7)/(8 × 8) and (4 + 6)/5 in R, G and B allowed the granites to be identified and shown in blue, the serpentinites and metasediments in green and the metavolcanics in magenta (Figure k). The granites are cut by mafic dikes shown in green. In addition to discriminating between the different lithologies in the study area, this combination also highlighted areas of hydrothermal alteration, shown in white in Figures (k and l).
4.2. Prospective mapping using GIS
In the present study several datasets were combined using GIS smart tools for exploring potential areas of mineral resources. In the last few decades, remote sensing techniques have provided digital data/images that have helped progress data integration and fusion approaches [Citation39,Citation41]. In this study, we combined the evidential maps using a multiclass overlay method known as the knowledge-driven multi-criteria technique, which has been used in many reconnaissance studies [Citation8,Citation58]. In this overlay method, each target map was given a weight matching the probably grade of hydrothermal alteration and each single thematic map was sorted into zones based on the grade of hydrothermal alteration. A numeric rank ranging from 1 to 6 was given to each zone (Figure ), where 6 is the highest plausible grade of hydrothermal alteration, and 1 is the lowest or indicates an absence of alteration [Citation58]. The combination process takes into account the fact that each evidential map is a binary map containing prospective and non-prospective pixels. The meeting of many prospective vectors in any region of the map therefore increases the effective grade in that zone. The higher the values, the higher the prospect of finding mineral resources associated with hydrothermal activity.
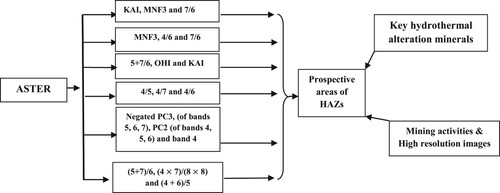
The band ratios, Minimum Noise Fraction image and mineral indices that highlighted the HAZs (Figure a–l) were therefore integrated for the purpose of prospective mapping. Each composite map was sub-divided into six zones ranging from very low grade or absent alteration (1) to very high grade alteration (6). The maps were then merged to define the areas of optimum potential hydrothermal grade. The results of this process are mineral predictive maps showing the potential areas of mineral resources (Figure a).
Figure 4. Flow-chart depicts the integrated data for delineating areas of prospective hydrothermal alteration zones.
The resulting prospective map of hydrothermal alteration (Figure a) subdivides the study area into seven prospective zones using the Natural Breaks Classification method in ArcGIS software packages that initiated to optimize collection of a set of values into classes of similar characteristics called “natural classes”. These zones including excellent, very good, good, moderate, low, very low and bare/absent prospects that covering about 1.39, 5.81, 16.31, 26, 25, 20.95, and 4.46% of the study area. Moreover, the potentiality values of the aforementioned classes are ranging from 15–18, 13–15, 11–13, 9–11, 7–9, 4–7, and 3–4, respectively.
Figure 5. (a) Prospective mineral map showing the potential hydrothermal alteration zones derived from ASTER data. The dashed black polygon enlarged in Figures (b and c); (b) Prospective area around the Abu–Gaharish mine overlain by yellow points representing the presence of the kaolinite–smectite mineral group; (c) Subset of the potential hydrothermal alteration map showing red pixels that indicate a high grade hydrothermal alteration, which is consistent with the green points derived from the scatter plot in panel g, indicating Al-OH minerals; (d, e) Obtained pixel spectra for blue and magenta points, and reference spectral curves from the USGS mineral spectral library that match brucite and talc, respectively; (f) Obtained pixel spectrum from the yellow points, and the corresponding reference spectral curve from the USGS mineral spectral library that matches kaolinite–smectite; (g) Binary scatter plot showing band ratios (5 + 7)/6 vs. 5/7 [Citation59].
![Figure 5. (a) Prospective mineral map showing the potential hydrothermal alteration zones derived from ASTER data. The dashed black polygon enlarged in Figures 5(b and c); (b) Prospective area around the Abu–Gaharish mine overlain by yellow points representing the presence of the kaolinite–smectite mineral group; (c) Subset of the potential hydrothermal alteration map showing red pixels that indicate a high grade hydrothermal alteration, which is consistent with the green points derived from the scatter plot in panel g, indicating Al-OH minerals; (d, e) Obtained pixel spectra for blue and magenta points, and reference spectral curves from the USGS mineral spectral library that match brucite and talc, respectively; (f) Obtained pixel spectrum from the yellow points, and the corresponding reference spectral curve from the USGS mineral spectral library that matches kaolinite–smectite; (g) Binary scatter plot showing band ratios (5 + 7)/6 vs. 5/7 [Citation59].](/cms/asset/a0be809a-0f5d-493b-beaa-9ec7d47e5729/tusc_a_1825184_f0005_oc.jpg)
In the southern and central parts of the prospective map, the zone of high grade hydrothermal alteration is consistent with the Abu–Gaharish mining area, where many mining and borehole drilling activities were conducted by Aton [Citation48,Citation50]. The alteration in the central area (Figure a) occurs along fracture/fault zones within the granite pluton that require further field investigations. Moreover, in the northwestern corner of the predictive map, a potentially high-grade area elongated in a NE–SW direction requires further field investigations.
The prospective map showing the target areas for hydrothermal alteration identified using GIS techniques is shown in Figure (a). These areas potentially host Al-OH minerals. A binary scatter plot showing band ratios (5 + 7)/6 (a proxy for the Al-OH content) vs. 5/7 (a proxy for Mg-OH content) [Citation59] helped to identify the potential zones of Al-OH alteration as those that occupied the uppermost right-hand section of the binary plot, whereas the lowermost left-hand section highlighted the areas lacking Al-OH minerals (Figure g). This plot showed that the area corresponding to high grade prospects (Figure c) is consistent with pixels that indicate enrichment in Al-OH [Citation59]. The green points that have a higher Al-OH content are those that are consistent with the area of potential hydrothermal alteration (Figure c). However, green points corresponding to areas with a lack of Al_OH content in the right-hand section of Figure (c) consist of basic metavolcanics, as indicated by higher Mg-OH contents. The green points extracted from plotting band ratios 5 + 7/6 vs. 5/7 are consistent to the red pixels that reveal the higher Al-OH content Figure (c).
The key hydrothermal alteration minerals distributed in the study area were identified by obtaining end-members by applying wizard sub-pixel classification of SWIR ASTER data bands. These end-members were correlated with records from the USGS mineral spectral library, using the Spectral Angle Mapper (SAM), Spectral Feature Fitting (SFF), and Binary Encoding (BE) methods, and results are shown in Figure (d–f). The obtained key hydrothermal end-member maps were overlain on the prospective map in order to verify the location of prospective minerals (Figure a–c).
To identify the key hydrothermal minerals, the obtained spectral curves were correlated with records from the USGS spectral library, with the highest correlation score representing the most likely probability. Through this process, we identified the spectra of three important minerals resulting from propylitic and argillic alteration. The first displays an absorption feature close to a wavelength of 2.335 µm, which most likely correlates with minerals bearing Mg-OH, such as chlorite and talc. The most probable candidate was found to be talc, with a correlation score of 0.944. The zone hosting this mineral lies within the basic metavolcanics and other related rocks in the southeastern part of the prospective map. The occurrences of this mineral are indicated with magenta dots in Figure (a). The second mineral end-member displays an intense absorption feature close to a wavelength of 2.335 µm and was found in an area comprising basic metavolcanics and serpentinites. This mineral is likely to be antigorite or brucite, with a correlation score of 0.849.
The third mineral endmember corresponds to areas of high grade hydrothermal alteration in the mining areas and at the northwestern corner of the map (Figure a–c). This mineral displays a significant absorption feature close to a wavelength of 2.209 µm, which corresponds to the known spectrum of kaolinite–smectite, with a correlation score of 0.961. Zones featuring these minerals likely reflect areas of argillic alteration (Figure b, f) as absorption features close to 2.205 µm are characteristic of kaolinite, montmorillonite, illite and sericite [Citation20,Citation32].
5. Discussion
The results of this study yielded a discrimination map illustrating the occurrence of granitoid rocks that are shown in greenish cyan, metasediments shown in reddish-orange, basic metavolcanics, metasediments and serpentinites shown in blue, and areas of hydrothermal alteration shown in light cyan. Band ratio 6/7 was effective in highlighting OH-bearing minerals, such as kaolinite–smectite, micas and amphiboles [Citation36]. In addition, band ratios 7/5 and 5/4 revealed the Fe-rich rock units in the study area, such as the basic metavolcanics that are shown in red.
The deposition of minerals in hydrothermal systems can result from diverse processes that cause changes in the physical and chemical characteristics of hydrothermal fluids and minimize metal solubility [Citation39]. Our analysis and interpretation of Landsat-OLI and ASTER data revealed HAZs along fracture/fault zones as well as along the eastern contact between the granite and the metavolcanics. The alteration products consist dominantly of argillic and propylitic zones. The hydrothermally altered minerals show a high reflectance in band 4 and a significant negative signature in band 6 of the ASTER data. The grade of hydrothermal alteration can be used as a guide for targeting the mineralization zones [Citation32]. In the area of the interest, the argillic zone was previously the target of mining activities.
The ASTER data provided a reasonably data-rich basis for locating potential areas of hydrothermal alteration, through image transformation techniques. GIS approaches also yielded a very good consistency between prospective zones and mineralized zones. Using the combined kaolinite index ([band 4/band 5] × [band 8/band 6]), MNF3 and band ratio 7/6, hydrothermal alteration zones were highlighted in white tones (Figure a), whilst granitoids were displayed in pink. The kaolinite index [Citation2,Citation16] was used in this composite image to highlight areas that have prospective amounts of kaolinite and as an indication of argillic alteration zones. This combination successfully defined the prospective areas comprising high grade hydrothermal alteration and displayed these zones in white tones.
The combination of MNF3 and band ratios 4/6 and 7/6 in R, G and B also helped to identify potential areas of hydrothermal alteration. This combination provided better results for locating alteration zones characterized by Al-OH minerals (Figure c, d). Band ratio 4/6 produced reliable results in terms of locating occurrences of argillic minerals such as kaolinite, which is characterized by a spectrum with two significant absorption features, in band 5 and (especially) in band 6 [Citation5,Citation60]. Band ratio 4/6 also allowed the identification of occurrences of white mica, which displays a prominent reflectance in band 4 and significant absorption in band 6 (Figure c, g), allowing areas of argillic and phyllic alteration to be highlighted [Citation5]. In addition, band ratio 7/6 (Figure a, c, e) revealed the occurrence of a white mica (sericite) alteration that can be recognized through the prominent absorption feature in band 6 [Citation61].
The combination of the band ratio 5 + 7/6 with OHI and KAI in R, G and B also provided good results for identifying aluminum hydroxide-bearing minerals in the central part of the transformed image (Figure e, f), which appear as bright pixels. As phyllic minerals show a strong Al-OH absorption at a wavelength of around 2.20 µm (ASTER band 6), and bands 5 and 7 are found at the absorption flanks of band 6, the absorption Relative Band Depth (RBD) was computed as (5 + 7)/6 [Citation59,Citation62]. The use of the RBD in this combination allowed HAZs to be identified [Citation28,Citation34] as this band ratio revealed the occurrence of Al-OH minerals (Figure e, f), such as Al–smectite, muscovite, sericite, and illite [Citation59,Citation62,Citation63]. The use of the mineral indices of Ninomiya [Citation2,Citation16] in this combination maximized the extracted information.
The argillic minerals were identified through the presence of a double absorption feature close to bands 5 (2.16 µm) and 6 (2.20 µm), whereas the Fe-OH minerals such as jarosite and/or Fe–sericite were identified in band 7. In addition, phyllic zones rich in illite– sericite yielded a single prominent negative signature at a wavelength of 2.205 µm (band 6) [Citation5]. The combination of band ratios 4/5, 4/7, and 4/6 in R, G, and B therefore revealed the location of hydrothermal alteration zone in white tones (Figure g, h). Using this combination, the granitoids appear in pink and the metavolcanics, metasediments and serpentines are shown in green.
Gathering this remotely-sensed information (Figure ) regarding the hydrothermal alteration in the study area using GIS techniques, locations for the occurrence of HAZs were provided (Figure a). This information therefore revealed the locations of prospective areas for mineral resources derived from hydrothermal activity, as the economic aggregates of metals such as Au, W, and Cu in the Abu–Gaharish area are most likely related to zones of intense hydrothermal alteration (Figures a, Figure ). This is because HAZs are a potential location for the occurrence of base and precious metal deposits [Citation10]. These zones are located in the central part of the study area, as well as near the southern contact between the granites and the metasediments and to the northwest of the Abu–Gaharish granites (Figure a).
Figure 6. (a) Modified geological map showing information from remote sensing data and from Klem and Klem [Citation49]; (b) Subset of the study area showing the mining zone (dashed rectangle in panel a), as depicted from high resolution GeoEye data.
![Figure 6. (a) Modified geological map showing information from remote sensing data and from Klem and Klem [Citation49]; (b) Subset of the study area showing the mining zone (dashed rectangle in panel a), as depicted from high resolution GeoEye data.](/cms/asset/2724f12b-95ad-4344-b5b3-d546d59c6d53/tusc_a_1825184_f0006_oc.jpg)
Although the use of combinations of band ratios, mineral indices and RBD successfully characterized the nature and location of the HAZs, certain key minerals were challenging to identify. Spectral analysis curves were therefore used to identify specific minerals [Citation18,Citation20,Citation31]. These revealed three types of hydrothermal alteration minerals, including kaolinite–smectite, talc and brucite, which belong to argillic and propylitic zones. Propylitic zones are characterized by the presence of Mg-OH and CO3 mineral species, and host chlorite, epidote and calcite with absorption signatures matching ASTER band 8 [Citation9,Citation26,Citation30,Citation32,Citation64]. Talc and brucite were also identified within the basic metavolcanics and serpentinites that surround the granites (Figure a, d, e). In addition, the identification of the kaolinite–smectite group of minerals, which contain Al-OH, indicated the potential areas for prospective mineral resources related to hydrothermal alteration. Brucite is a magnesium hydroxide that is commonly associated with serpentinites. A binary plot of band ratios (5 + 7)/6 (indicating minerals bearing Al-OH) vs. 5/7 (indicating Mg-OH and carbonate minerals such as chlorite, epidote, and amphiboles; [Citation59]) was effective in discriminating between the areas hosting and lacking Al-OH minerals. Pixels located on the right side of this binary plot were consistent with areas of potential hydrothermal alteration (Figure c, g), hosting minerals of the kaolinite–smectite group, and therefore correspond to potential ore bodies.
The recent field investigation of the Gaharish area conducted by Aton [Citation50] revealed the presence of quartz veins bearing Au and W–Bi–Cu in an area of significant argillic and phyllic alteration within a thick section of felsic volcanics close to the boundary with the Gaharish granite. The mineralization along the granitic pluton contact suggests an intrusion-related style of gold mineralization [Citation48]. By comparing the results of our study with the existing geological map (Figures and ), most of the ore mineralization was observed to occur within the most areas of high hydrothermal intensity. This is because the hydrothermal ore body probably located in areas of high intensity of hydrothermal alteration [Citation8,Citation42]. The presence of mineralized zones along the contact of the granite pluton and country rocks and sheeted quartz veins cutting the granite itself and country rocks revealed the existence of multiphase of mineralizations that need further field investigations in the future.
Conclusions
The Abu–Gaharish area of the CED of Egypt is largely composed of granitoids, metavolcanics, and metasediments. Image transformation techniques using Landsat-8 OLI and ASTER data represent a powerful and cost-effective approach for application during the reconnaissance stage of mineral exploration. The use of band ratios and mineral indices for ASTER data through GIS spatial analysis techniques allowed the identification of the location of high grade hydrothermal alteration zones. This was achieved by combining ranked thematic predictor maps. The spatial distribution of hydrothermal alteration minerals in the study area consists of three potential prospective areas. The first area is located in the south of the study area and is consistent with the existing mining area of Abu–Gaharish, which constitutes the new Aton company prospect. The second area is located in the northwestern corner, extending in a NE–SW direction, and is probably related to felsic dikes with quartz veins. The third area is clearly associated with fracture/fault zones within the granites. The examination of spectra allowed key hydrothermal minerals to be identified, including kaolinite–smectite, talc and brucite, revealing the existence of both argillic and propylitic alteration zones. The areas enriched in kaolinite–smectite are restricted to areas with a high prospective potential.
Acknowledgements
The authors are very grateful for the very helpful suggestions made by the editors and anonymous reviewers, which helped us to improve the manuscript. The authors are grateful to the Deanship of Scientific Research, King Saud University for funding through Vice Deanship of Scientific Research Chairs and RSSU at King Saud University for their technical support.
Disclosure statement
No potential conflict of interest was reported by the author(s).
References
- Crosta AP, Souza-Filho CR, Azevedo F, et al. Targeting key alteration minerals in epithermal deposits in Patagonia, Argentina, using ASTER imagery and principal component analysis. Int. J. Remote Sens. 2003;24:4233–4240. doi: 10.1080/0143116031000152291
- Ninomiya Y. (2003a). A stabilized vegetation index and several mineralogic indices defined for ASTER VNIR and SWIR data. Proc. IEEE 2003 International Geoscience and Remote Sensing Symposium (IGARSS'03) Vol. 3, Toulouse, France, 21–25 July 2003, pp. 1552–1554.
- Galvao LS, Filho RA, Vitorello I. Spectral discrimination of hydrothermally altered materials using ASTER short-wave infrared bands: evaluation in a tropical savannah environment. Int. J. Appl. Earth Obs. Geoinf. 2005;7:107–114. doi: 10.1016/j.jag.2004.12.003
- Bedini E. Mineral mapping in the Kap Simpson complex, central East Greenland, using HyMap and ASTER remote sensing data. Adv Space Res. 2011;47:60–73. doi: 10.1016/j.asr.2010.08.021
- Yajima T. (2014). ASTER Data Analysis Applied to Mineral Resource Exploration and Geological Mapping PhD Dissertation, Nagoya University.
- Abdelkareem M, El-Baz F. Analyses of optical images and radar data reveal structural features and predict groundwater accumulations in the central Eastern Desert of Egypt. Arab. J. Geosci. 2015;8(5):2653–2666. doi: 10.1007/s12517-014-1434-7
- Abdelkareem M, El-Baz F. Mapping hydrothermal alteration zone as a probable site of potential mineral resources in the central Eastern Desert of Egypt using remotely-sensed data. Geol. Soc. Am. abstracts with programs. 2016;48(7). doi:10.1130/abs/2016AM-282399.
- Abdelkareem M, Kamal El-Din G, Osman I. An integrated approach for mapping mineral resources in the Eastern Desert of Egypt. Int. J. Appl. Earth Obs. Geoinfo. 2018;73C:682–696. doi: 10.1016/j.jag.2018.07.005
- Testa FJ, Villanueva C, Cooke DR, et al. Lithological and hydrothermal alteration mapping of Epithermal, Porphyry and Tourmaline Breccia Districts in the Argentine Andes using ASTER Imagery. Remote Sens. 2018;10:203. doi: 10.3390/rs10020203
- Mathieu L. Quantifying hydrothermal alteration: a review of methods. Geosciences (Basel). 2018;8:245. doi: 10.3390/geosciences8070245
- Goetz AFH, Rock BN, Rowan LC. Remote sensing for exploration, an overview. Econ. Geol. 1983;78:573–590. doi: 10.2113/gsecongeo.78.4.573
- Sabins FF. Remote sensing for mineral exploration. Ore. Geol. Rev. 1999;14:157–183. doi: 10.1016/S0169-1368(99)00007-4
- Poormirzaee R, Oskouei MM. (2009). Detection minerals by advanced spectral analysis in ETM+ imagery; Proceeding of 7th Iranian Student Conference Mining Engineering, Tabriz, pp. 111–119.
- Abrams MJ, Brown D, Leple L, et al. Remote sensing of porphyry copper deposits in Southern Arizona. Econ. Geol. 1983;78:591–604. doi: 10.2113/gsecongeo.78.4.591
- Sabins FF. Remote sensing strategies for mineral exploration. In: Rencz AE, editor. Remote sensing for the earth sciences. New York: John Wiley & Sons, Inc; 1997. p. 375–447.
- Ninomiya Y. (2003b). Advanced remote lithologic mapping in ophiolite zone with ASTER multispectral thermal infrared data. Proc. IEEE 2003 International Geoscience and Remote Sensing Symposium (IGARSS'03) Vol. 3, Toulouse, France, 21– July 2003, pp. 1561–1563.
- Rowan LC, Hook SJ, Arams MJ, et al. Mapping hydrothemally altered rocks at the cuprite Nevada using the advanced spaceborne thermal emission and reflection radiometer (ASTER), a new satellite-imaging system. Econ. Geol. 2003;98:1019–1027. doi: 10.2113/gsecongeo.98.5.1019
- Zhang X, Panzer M, Duke N. Lithologic and mineral information extraction for gold exploration using ASTER data in the south Chocolate Mountains (California). J. Photogramm. Remote Sens. 2007;62:271–282. doi: 10.1016/j.isprsjprs.2007.04.004
- Azizi H, Rasouli AA, Babaei K. Using SWIR bands from ASTER for discrimination of hydrothermal alterated mineral in the northwest of Iran (SE Sanadaj city); a key for exploration of copper and gold mineralization. Res. J. Appl. Sci. 2007;2(6):763–768.
- Azizi H, Tarverdi MA, Akbarpour A. Extraction of hydrothermal alterations from ASTER SWIR data from east Zanjan, northern Iran. Adv. Space Res. 2010;46:99–109. doi: 10.1016/j.asr.2010.03.014
- Gabr S, Ghulam A, Kusky T. Detecting areas of high-potential gold mineralization using ASTER data. Ore Geol. Rev. 2010;38:59–69. doi: 10.1016/j.oregeorev.2010.05.007
- Tangestani MH, Moore F. Iron oxide and hydroxyl enhancement using the Crosta method: A case study from the Zagros belt, Fars Province, Iran. Int. J. Appl. Earth Obs. Geoinfo. 2000;2(2):140–146. doi: 10.1016/S0303-2434(00)85007-2
- Mia MB, Fujimitsu Y. Mapping hydrothermal altered mineral deposits using Landsat 7 ETM+ image in and around Kuju volcano, Kyushu, Japan. J. Earth Syst. Sci. 2012;121(4):1049–1057. doi: 10.1007/s12040-012-0211-9
- Guha A, Singh V, Parveen R, et al. Analysis of ASTER data for mapping bauxite rich pockets within high altitude lateritic bauxite, Jharkhand, India. Int. J. Appl. Earth Obs. Geoinfo. 2013;21:184–194. doi: 10.1016/j.jag.2012.08.003
- Abrams M, Hook SJ. Simulated ASTER data for geologic studies. IEEE Trans. Geosci. Remote Sens. 1995;33:692–699. doi: 10.1109/36.387584
- Mars JC, Rowan LC. Regional mapping of phyllic- and argillic-altered rocks in the Zagros magmatic arc, Iran, using Advanced Spaceborne Thermal Emission and Reflection Radiometer (ASTER) data and logical operator algorithms. Geosphere. 2006;2:161–186. doi: 10.1130/GES00044.1
- Yamaguchi Y, Naito C. Spectral indices for lithologic discrimination and mapping by using the ASTER SWIR bands. Int. J. Remote. Sens. 2003;24(22):4311–4323. doi: 10.1080/01431160110070320
- Rowan LC, Mars JC. Lithologic mapping in the Mountain Pass, California, area using advanced space-borne thermal emission and reflection radiometer (ASTER) data. Remote Sens. Environ. 2003;84:350–366. doi: 10.1016/S0034-4257(02)00127-X
- Pour BA, Hashim M, Marghany M. Using spectral mapping techniques on short wave infrared bands of ASTER remote sensing data for alteration mineral mapping in SE Iran. Int. J. Phys. Sci. 2011;6(4):917–929.
- Pour BA, Hashim M. The application of ASTER remote sensing data to porphyry copper and epithermal gold deposits. Ore Geol. Rev. 2012;44:1–9. doi: 10.1016/j.oregeorev.2011.09.009
- Hosseinjani-Zadeh M, Tangestani MH, Roldan FV, et al. Mineral exploration and alteration mapping using mixture tuned matched filtering approach on ASTER data at the central part of Dehaj-Sarduiyeh Copper belt. SE Iran. IEEE J-STARS. 2014;7(1):284–289.
- Abdelkareem M, El-Baz F. Characterizing hydrothermal alteration zones in Hamama area in the central Eastern Desert of Egypt by remotely sensed data. J Geocarto International. 2017;33(12):1307–1325. doi: 10.1080/10106049.2017.1325410
- Pour BA, Hashim M. Integrating PALSAR and ASTER data for mineral deposits exploration in tropical environments: a case study from central belt, Peninsular Malaysia. Int. J. Image Data Fusion. 2015;6(2):170–188. doi: 10.1080/19479832.2014.985619
- Crowley JK, Brickey DW, Rowan LC. Airborne imaging spectrometer data of the Ruby Mountains, Montana: mineral discrimination using relative absorption band depth images. Remote Sens. Environ. 1989;29(2):121–134. doi: 10.1016/0034-4257(89)90021-7
- Rowan LC, Goetz AFH, Ashley RP. Discrimination of hydrothermally altered and unaltered rocks in visible and near infrared multispectral images. Geophysics. 1977;42(3):522–535. doi: 10.1190/1.1440723
- Gupta RP. Remote sensing Geology. 2nd ed. Berlin: Springer- Verlag; 2003.
- Hezarkhani A. Hydrothermal evolution of the Sar-Cheshmeh Porphyry Cu-Mo deposit, Iran: evidence from fluid inclusions. J. Asian Earth Sci. 2006;28(4):409–422.
- Joly A, Porwal A, McCuaig TC, et al. Mineral systems approach applied to GIS-based 2D-prospectivity modelling of geological regions: insights from Western Australia. Ore Geol. Rev. 2015;71:673–702.
- Sun T, Chen F, Zhong L, et al. GIS-based mineral prospectivity mapping using machine learning methods: A case study from Tongling ore district, eastern China. Ore Geol. Rev. 2019;109:26–49.
- Carranza EJM, Hale M, Faassen C. Selection of coherent deposit-type locations and their application in data-driven mineral prospectively mapping. Ore Geol. Rev. 2008;33:536–558.
- Carranza EJM, Laborte AG. Data-driven predictive mapping of gold prospectivity, Baguio district, Philippines: application of random forests algorithm. Ore Geol. Rev. 2015;71:777–787.
- Compos LD, de Souza SM, de Sordi DA, et al. Predictive mapping of prospectivity in the Gurupi orogenic gold belt, north–northeast Brazil: an example of districtscale mineral system approach to exploration targeting. Nat. Resour. Res. 2017;26(4):1–26.
- Conoco. (1987). Geological map of Egypt, scale 1:500,000. The Egyptian General Petroleum Corporation, Cairo.
- Hashad AH. Present status of geochronological data on the Egyptian basement complex. Bull Inst. Appl. Geol. (Jeddah. 1980;3:31–46. doi:10.1016/B978-0-08-024479-2.50007-9.
- Stern RJ, Hedge CE. Geochronologic and isotopic constraints on late Precambrian crustal evolution in the Eastern Desert of Egypt. Ann. J. Sci. 1985;285:97–127.
- Moghazi AKM. Magma source and evolution of late Neoproterozoic granitoids in the Gabal El-Urf area, Eastern Desert, Egypt: geochemical and Sr–Nd isotopic constraints. Geol Mag. 1999;136(03):285–300. doi:10.1017/S0016756899002563.
- Moussa EM, Stern RJ, Manton WI, et al. SHRIMP zircon dating and Sm/Nd isotopic investigations of Neoproterozoic granitoids, Eastern Desert, Egypt. Precambrian Res. 2008;160(3):341–356. doi:10.1016/j.precamres.2007.08.006.
- Aton. (2019). Aton reports reconnaissance sampling of the Semna East area, sampling up to 9.13 g/t Au, and identifies the potential for intrusion-related gold mineralization. [cited 2010 Aug 31] Available from https://www.atonresources.com/news/2019/aton-reports-reconnaissance-sampling-of-the-semna-east-area-sampling-up-to-9.13-g-t-au-and-identifies-the-potential-for/.
- Klem R, Klem D. Gold and gold mining in ancient Egypt and Nubia: Geoarchaeology of the ancient gold mining sites in the Egyptian and Sudanese Eastern Deserts. Heidelberg: Springer; 2013. p. 649.
- Aton. (2017). Aton extends the gold mineralized zone at the Abu Gaharish prospect, and announces the discovery of new Au-W-Cu mineralization at North Gaharish. [cited 2020 Mar 3] Available from https://www.atonresources.com/news/2018/aton-confirms-the-discovery-of-a-new-zone-of-gold-mineralization-at-gaharish-north/.
- Willis KM, Stern RJ, Clauer N. Age and geochemistry of late Precambrian sediments of the Hammamat Series from the Northeastern Desert of Egypt. Precambrian Res. 1988;42(1):173–187.
- Green AA, Craig MD. (1985). Analysis of aircraft spectrometer data, with logarithmic residuals. In Proceedings of the Airborne Imaging Spectrometer Data Analysis Workshop; Vane, G., Goetz, A., Eds.; JPL: Pasadena, CA, USA; p. 111–119.
- Rouskov K, Popov K, Stoykov S, et al. (2005). Some applications of the remote sensing in geology by using of ASTER images. Scientific Conference “Space. Ecology, Safety” with international Participation 10-13 June 2005, Veina, Bulgaria 167–173.
- Boardman W, Kruse FA. Automated spectra analysis: a geologic example using AVIRIS data, north Grapevine on geologic remote sensing. Ann Arbor (MI): Environmental Research Institute of Michigan; 1994. p. 407–418.
- Farr TG, Rosen PA, Caro E, et al. The Shuttle Radar Topography Mission. Reviews of Geophysics. 2007;45(2). Doi:10.1029/2005RG000183
- Farr TG, Elachi C, Hartl P, et al. Microwave penetration and attenuation in desert soil: a field experiment with the shuttle Imaging Radar. J. IEEE Trans. Geosci. Remote Sens. 1986;4:590–594.
- Hewson R. (2002). Summary of the 22nd ASTER science meeting, Tokyo, Japan, 20–23 May 2002 [cited 2018 Jan 29]. Available from: http://www.eoc.csiro.au/reports/hewson/22aster.htm.
- Zeghouane H, Allek K, Kesraoui M. GIS-based weights of evidence modeling applied to mineral prospectivity mapping of Sn-W and rare metals in Laouni area, central Hoggar, Algeria. Arab. J. Geosci. 2016;9:373.
- Cudahy TJ, Jones M, Thomas M, et al. (2008). Next generation mineral mapping: Queensland Airborne HyMap and Satellite ASTER Surveys 2006-2008. CSIRO report P2007/364, 153 pages (http://c3dmm.csiro.au/NGMM/index.html).
- Mahdevar MR, Ketabi P, Saadatkhah N, et al. Application of ASTER SWIR data on detection of alteration zone in the Sheikhabad area, eastern Iran. Arab J. Geosci. 2015;8:5909–5919.
- Stolz TA. (2008). Geological Mapping of Orhon, Tariat, and Egiin Dawaa, Central Mongolia, through the Interpretation of Remote Sensing Data. MSc Dissertation, Wright State University.
- Cudahy TJ. (2012). Satellite ASTER Geoscience Product Notes South Australia. Version 1, 27th February, 2012 –CSIR0 report, ePublish No. p. 26.
- Hewson R, Robson D, Mauger A, et al. Using the Geoscience Australia-CSIRO ASTER maps and airborne geophysics to explore Australian geoscience. J. Spat. Sci. 2015;62(2):207–231.
- Di Tommaso I, Rubinstein N. Hydrothermal alteration mapping using ASTER data in the Infiernillo porphyry deposit, Argentina. Ore Geol. Rev. 2007;32:275–290.