
 ?Mathematical formulae have been encoded as MathML and are displayed in this HTML version using MathJax in order to improve their display. Uncheck the box to turn MathJax off. This feature requires Javascript. Click on a formula to zoom.
Abstract
Hybrid micellar liquid chromatography was used for practical determination of acid dissociation constant (pKa) of three analytes, namely, ibuprofen (IBU), naproxen (NPX) and benzoic acid (BZA). The proposed method was established based on the principle adopting the dependence of the retention time of ionizable analytes on the mobile phase pH. Simple data manipulation was carried out without the need of specialized software, allowing estimation of practically determined pKa values, which were found to be in accordance with calculated and experimentally determined values, emphasizing on the versatility and applicability of the proposed method. The present methodology carries unique features which support its utility over traditional techniques adopted for pKa determination, like its solubilizing ability, overcoming long retention times experienced in reversed phase chromatography, non-limitation to a specified chemical class and possible justification of the determined pKa values using linear regression equations.
1. Introduction
Most pharmaceutical active ingredients (PAI) carry a weak acidic or basic nature; hence, they are exposed to be ionized, where their ionization pattern depends on both the pH of their solutions and their acid dissociation constant (pKa). Ionizable fractions show enhanced solubility, while neutral forms manifest better membrane permeability. Consequently, pKa is considered as one of the principle physicochemical parameters that govern drug solubility, permeability, absorption, distribution, receptor binding and plasma protein binding [Citation1–4], which necessitate accurate determination of pKa values of various pharmaceuticals.
Potentiometric titration [Citation1,Citation5,Citation6] is considered as one of the traditional methodologies to determine dissociation constant experimentally. In spite of yielding accurate and precise values, it suffers from some limitations like the need of a relatively large amount of pure solutes and the use of buffer mixtures [Citation1,Citation7].
As an alternative, spectrophotometry has been introduced to estimate pKa values [Citation1,Citation8], offering better sensitivity than potentiometric titration, but necessitates the presence of a chromophore that is sufficiently close to the functional groups imparting the acidic or the basic nature to the analysed molecule [Citation1]. Moreover, if the purity of the analysed sample is inferior, the impurities spectra may interfere with those of the concerned PAI [Citation7–10] yielding erroneous results.
Recently, separation methods have been launched to determine pKa values, where capillary electrophoresis CE and liquid chromatography LC were the most popular applied techniques [Citation1,Citation11,Citation12]. Regarding CE, it requires limited amounts of PAI, and can handle unstable and impure compounds [Citation1,Citation13,Citation14]; meanwhile, various environmental factors may affect the obtained values, namely temperature, ionic strength and viscosity [Citation15].
Liquid chromatography, on the contrary, is considered as a powerful tool to estimate pKa values [Citation1], where neither the purity nor the available amount of the PAI is considered as an obstacle for accurate determinations [Citation1]. Upon application of LC in its reversed phase mode to determine pKa of PAI, strong retention is experienced, since the mobile phase contains large proportion of water relative to organic solvent that constitutes the main drawback of LC in this specified application [Citation1].
Water solubility of PAI is a main requisite for accurate estimation of pKa values applying any of the previously mentioned analytical methods. Regarding LC, to enhance solubility of sparingly soluble PAI, introduction of organic solvents to the aqueous mobile phase is performed [Citation1,Citation3,Citation16]. Alongi et al. stated in their review article [Citation4] that mathematical calculation of pKa values is preferred to experimental determinations, since the deprotonation-free energy changes in different solvents (1.36 kcal/moL) bring about misleading results (1 pKa unit error).
The present work studies the suitability of hybrid micellar liquid chromatography (HMLC) for accurate estimation of pKa values, taking some acidic drugs as a model example. The authors have already separated the concerned analytes with other pharmaceuticals in previously published articles [Citation17,Citation18], after detailed optimization of the separation parameters. The data obtained from these two articles were manipulated in this paper to judge the capability of HMLC to accurately estimate the pKa values of the studied drugs.
The obtained results confirm that HMLC is appropriate for this application, yielding pKa values that are comparable with both the calculated and the experimentally determined pKa values – using other techniques – for all the studied compounds.
This work takes three analytes as a model example for pKa determination, namely ibuprofen (IBU), naproxen (NPX) and benzoic acid (BZA). The first two pharmaceuticals belong to nonsteroidal anti-inflammatory drugs, while the latter is a potential impurity encountered during synthesis of pseudoephedrine.
2. Experimental
2.1. Instrumentation
Separation of all compounds was carried out using “Shimadzu SPD-20A”, supplied with 20 microlitre loop and a “SPD-20A” UV/VIS detector. The apparatus is supplied with “CTO-20A” column oven and “DGU-207” degasser unit, Kyoto, Japan. pH meter was supplied from Jenway, UK.
2.2. Materials and reagents
Benzoic acid (BZA) was imported from “Oxford Lab. Fine chemical”, India. Ibuprofen (IBU) and naproxen (NPX) were imported from Takeda Pharmaceutical and Ercopharm A/S Pharmaceutical, Norway, Denmark. Sodium dodecyl sulphate (SDS), 1-propanol (HPLC grade) and tri-ethyl amine (TEA) were purchased from Sigma-Aldrich, USA. Acetonitrile and methanol (HPLC grade) were purchased from TEDIA, Fairfield, USA. Ortho phosphoric acid (min. assay 85%) was purchased from El Nasr Pharmaceutical Chemical Company, Egypt.
2.3. Chromatographic separation conditions
The same optimum separation conditions mentioned in our previously published articles [Citation17,Citation18] were applied in this work to determine pKa values of the studied analytes. It is worth to mention that the accordance between experimentally determined pKa values applying HMLC and reported pKa values significantly depends on utilization of optimized separation conditions. Mixture of IBU and NPX was separated using a mobile phase composed of 0.075 M SDS:1-propanol in a ratio of (85:15, v/v) containing 0.3% TEA and adjusted to pH of 2.5 with 2 M O-H3PO4, using a simple gradient elution programme, where a flow rate of 1.2 mL/min was applied for 6 minutes keeping UV detection at 260 nm, and then the flow rate was increased to 2.5 mL/min accompanied by UV detection at 220 nm till the end of analysis. Regarding BZA, it was separated (from pseudoephedrine and benzaldehyde) using a mobile phase consisting of 0.1 M SDS, 10% acetonitrile and 0.3% TEA with a final pH of 3.7, using a flow rate of 1.5 mL/min and setting UV detector at 220 nm. As previously described in our early published article [Citation18], selection of pH of this mobile phase was very critical since pH values lower than 3.5 or higher than 4 resulted in the overlap between the peaks of benzoic acid and benzaldehyde. All experiments were conducted using C18 Prontosil Kromaplus column of dimensions (250× 4.6 mm), Germany, which was thermostatically kept at 50°C for IBU and NPX and 40°C for BZA.
3. Results
The main concept adopted in this study is the sigmoidal dependence of the retention time of ionizable analytes with the mobile phase pH through applying HMLC [Citation15]. This mathematical relationship could be represented as follows:
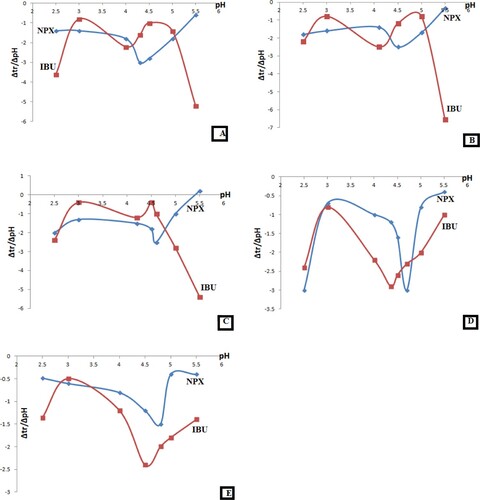
where kHA and kA are the retention factor of the acidic solute and its conjugate base, respectively, and Ka′ is the apparent acid dissociation constant, which is dependent on the surfactant concentration and percentage of organic modifier [Citation19,Citation20]. Further manipulation of the resultant sigmoid figures was performed under guidance of an early published research [Citation21] to simplify the estimation of pKa values. First-derivative diagrams were obtained by division of the difference in retention times over pH difference (Y abscissa) and plotting the resultant data vs. pH (X abscissa), for different HMLC compositions (SDS molar strength, organic modifier ratio and column temperature). Eventually, U-shaped curves are obtained, where the minimum point represents the desired pKa value [Citation21].
3.1. Effect of SDS molar strength on pKa values
Regarding IBU and NPX, different concentrations of SDS (ranging from 0.05 M to 0.18 M) were used to prepare different mobile phases, where the percentage of 1-propanol in all the prepared mobile phases was 15%, and the column temperature was thermostatically kept at 50°C. Figure (A–E) illustrates the sigmoid relation between the retention times of the studied analytes with pH at different SDS concentrations, while first-derivative curves are demonstrated in Figure (A–E). Considering the pKa to be the minimum value in the obtained U-shaped curves [Citation21], it is possible to depict the linear correlation between SDS concentration in HMLC mobile phase and pKa values of the analysed drugs (Figure 1s), which was utilized to derive linear regression analysis equations. Such equations could be applied to overcome the change in the experimentally determined pKa values accompanying the change in surfactant concentration upon utilizing HMLC. This hypothesis has been previously adopted by Manderscheid and Eichinger [Citation21] to validate the practically estimated pKa values which vary by changing the composition of the applied mobile phase [Citation21].
Figure 1. Sigmoid dependence of retention times of IBU and NPX on pH of the mobile phase at different molar strength of SDS (using 15% 1-propanol, keeping column temperature at 50°C), where A: 0.05 M SDS, B: 0.075 M SDS, C: 0.1 M SDS, D: 0.15 M SDS and E: 0.18 M SDS.
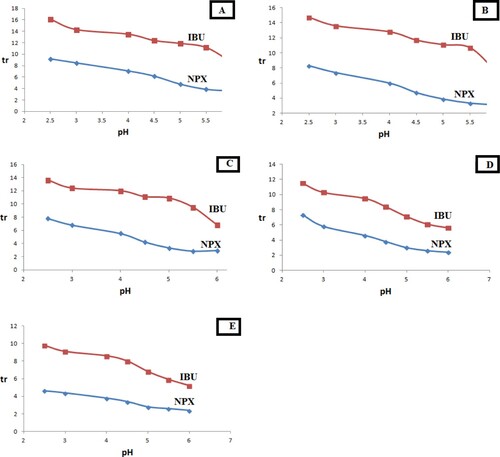
Figure 2. First-derivative curves for the dependence of the retention times of IBU and NPX on pH of the mobile phase at different molar strength of SDS (using 15% 1-propanol, keeping column temperature at 50°C), where A: 0.05 M SDS, B: 0.075 M SDS, C: 0.1 M SDS, D: 0.15 M SDS and E: 0.18 M SDS.
The derived linear regression equations were Y =3.5 X+4.19 for NPX and Y = 3.7 X+3.81 for IBU, with corresponding correlation coefficient values of 0.9306 and 0.994.
Concerning BZA, the same concept was applied to estimate the effect of SDS concentration on its pKa, where all the prepared mobile phases contain 10% acetonitrile, and the column was kept at 40°C. The sigmoid curves reflecting the correlation between the retention time of BZA and the pH at different molar strengths SDS are illustrated in Figures 2sA-2sE, with their corresponding first-derivative curves demonstrated in Figures 3sA-3sE. Eventually, the linear correlation between the pKa of BZA and SDS concentration is manifested in Figure 4s, which resulted in the linear regression equation: Y = 2.86 X+3.47 with correlation coefficient value of 0.9824.
By summarizing the obtained data in Figures 5s and 6s, it is obvious that experimentally determined pKa values gradually increase by subsequent rise in surfactant concentration upon applying HMLC, which is in accordance with the previously published reports [Citation19,Citation20].
3.2. Effect of organic modifier on pKa values
The influential effect of 1-propanol percentage on pKa values of IBU and NPX was studied over the range of (7%–15%), where 0. 075 M SDS was used in all the tested mobile phases keeping the column at 50°C. The sigmoid relation between retention times of the analytes and pH at different 1-propanol ratios could be manifested in Figures 7sA-7sD, with their corresponding first-derivative curves demonstrated in Figures 8sA-8sD; eventually Figure 9s represents the linear correlation between pKa values of IBU and NPX and 1-propanol ratio in HMLC. The resultant regression equations for IBU and NPX are Y = 0.0426X+4.72 and Y = 0.0647X+5.44, respectively, with corresponding correlation values of 0.9514 and 0.9651.
Similarly, the effect of acetonitrile ratio on the pKa of BZA could be manifested using different HMLC mobile phases each containing 0.1 M SDS, keeping the column at 40°C. Sigmoid graphs between BZA retention times and pH using different acetonitrile percentages in HMLC (Figures. 10sA-10sD) in addition to their first-derivative curves (Figures 11sA-11sD) could be represented. Linear dependence of pKa values of BZA on the ratio of acetonitrile in HMLC could be manifested in Figure 12s which resulted in the linear regression equation Y = −0.025X+3.94 having a correlation coefficient of 0.9714.
As a conclusion, Figures 13s and 14s illustrate that gradual increase in the organic modifier ratio using HMLC results in subsequent decrease in the practically determined pKa, which is in conformity with earlier reports [Citation19,Citation20].
3.3. Effect of column temperature on pKa values
It is well established that the change in pKa values of chemical compounds with temperature does not obey a certain pattern; each compound has its own response according to its acid base dissociation behaviour [Citation22]. To correlate the change in pKa values of IBU and NPX with temperature, a mobile phase composed of 0.075 M SDS:1-propanol in a ratio of (85:15, v/v) was used with different pH values, where the influence of the mobile phase pH on the retention times of the studied drugs at different column temperatures (30°C–50°C) was investigated (Figures 15sA-15s E). Derivatization of the resultant figures was carried out (Figures 16sA-16sE) to presume the correlation between IBU and NPX pKa values with column temperature (Figure 17s).
Meanwhile, the change in BZA pKa with column temperature was studied using a mobile phase containing 0.1 M SDS and 10% acetonitrile, where the relationship between pH and retention time was investigated upon changing the column temperature from 25°C to 40°C (Figures 18sA-18sD). The corresponding first-derivative figures (Figures 19sA-19sD) were then used to correlate between BZA pKa and column temperature (Figure 20s).
4. Discussion
One of the main factors that encouraged the authors to select HMLC to conduct this study is its exceptional solubilizing ability of sparingly soluble compounds. It is well-established that HMLC is formed from an aqueous solution containing a surfactant above its critical micelle concentration, leading to the formation of micelles [Citation23]. Solutes bind to micelles via electrostatic forces and/or hydrophobic interactions according to their ionization behaviour, which is determined basically according to the mobile phase pH and the analyte pKa [Citation23]. Such binding enhances the solute solubility producing an isotropic solution with a remarkable thermodynamic stability [Citation23]. Thus, the challenge of keeping a poorly soluble analyte in its solution form during pKa determination using traditional techniques (which requires continuous variation in pH) could be resolved by applying HMLC.
These facts necessitate that the selected surfactant should possess certain thermodynamic properties to yield accurate results. High degree of ionization (α), negative values for each of Gibbs free energy of micellization (ΔGm) and standard heat of micellization (ΔHm) (reflecting spontaneous micellization) are considered as the most significant characteristics. Since SDS falls among one of the surfactants that accomplish these criteria, it was selected as a model example for the preparation of HMLC mobile phase in the studied researches [Citation17,Citation18]. According to the study carried out by Ghimire et al. [Citation24], who compared the thermodynamic properties of SDS with another cationic surfactant – cetyltrimethylammonium bromide (CTAB), SDS was superior, where the corresponding values of α, ΔGm and ΔHm for SDS and CTAB were 0.48/0.26, −35.08/−49.61 KJ/mol and −14.38/−31.61 KJ/mol, respectively [Citation24].
Long retention times experienced in traditional LC could be overcome by HMLC despite consuming limited amounts of organic modifiers, where the separation mechanism in HMLC is quite complicated and completely different from the traditional reversed phase theory [Citation23].
Moreover, experimental errors in pKa determination resulting from inclusion of organic modifiers could be simply corrected by applying linear regression analysis [Citation21]. Besides, simple mathematical calculations were performed to conclude pKa values without using any specialized software programs, which is advantageous to analysts.
Additionally, the proposed method succeeded to calculate pKa of compounds belonging to different chemical classes, which suggest that HMLC could be considered as a universal tool for pKa determination of acidic compounds, without limitations to a certain chemical category.
The practically determined pKa values of the three studied analytes obtained through applying HMLC were found to be in accordance with previously determined values [Citation1,Citation25] which adopted potentiometric titration and/or LC and CE as experimental methodologies (Table ). Moreover, the obtained results were in agreement with the calculated values [Citation26] (Table ), which emphasize on the versatility of the proposed method.
Table 1. Comparison of pKa values obtained by HMLC, reported and practical values using other methodologies.
5. Conclusion
The proposed method succeeded to determine the acid dissociation constant (pKa) of some analytes applying HMLC, which was not dwelled before in the literature. HMLC demonstrated its ability to calculate pKa values for analytes belonging to different chemical classes (imparting unique solubilizing ability) and yielding pKa values in accordance with both the calculated and the experimentally determined ones, which emphasizes on its applicability. Errors in pKa values owing to mobile phase components could be easily justified applying simply deduced regression equations.
Supplemental Material
Download MS Word (876.9 KB)Disclosure statement
No potential conflict of interest was reported by the author(s).
References
- Babic S, Horvat AJM, Pavlovic DM, et al. Determination of pKa values of active pharmaceutical ingredients. Trend Anal Chem. 2007;26:1043–1061.
- Demiralay EC, Alsancak G, Ozkan SA. Determination of pKa values of nonsteroidal antiinflammatory drug-oxicams by RP–HPLC and their analysis in pharmaceutical dosage forms. J Sep Sci. 2009;32:2928–2936.
- Savić JS, Marković B, Vitnik V, et al. Determination of ionization constants (pKa) of β-hydroxy-β-arylalkanoic acids using high-pressure liquid chromatography. Kragujevac J Sci. 2018;40:103–111.
- Alongi KS, Shields GC. Theoretical calculations of acid dissociation constants: A review article. Annu Rep Comput Chem. 2010;6:113–138.
- Qiang Z, Adams C. Potentiometric determination of acid dissociation constants (pKa) for human and veterinary antibiotics. Water Res. 2004;38:2874–2890.
- Wrobel R, Chmurzynski L. Potentiometric pKa determination of standard substances in binary solvent systems. Anal Chim Acta. 2000;405:303–308.
- Andrasi M, Buglyo P, Zekany L, et al. A comparative study of capillary zone electrophoresis and pH-potentiometry for determination of dissociation constants. J Pharm Biomed Anal. 2007;44:1040–1047.
- Beltran JL, Sanli N, Fonrodona G, et al. Spectrophotometric, potentiometric, and chromatographic pKa values of polyphenolic acids in water and acetonitrile–water media. Anal Chim Acta. 2003;484:253–264.
- Evagelou V, Tsantili-Kakoulidou A, Koupparis M. Determination of the dissociation constants of the cephalosporins cefepime and cefpirome using UV spectrometry and pH potentiometry. J Pharm Biomed Anal. 2003;31:1119–1128.
- Jimenez-Lozano E, Marques I, Barron D, et al. Determination of pKa values of quinolones from mobility and spectroscopic data obtained by capillary electrophoresis and a diode array detector. Anal Chim Acta. 2002;464:37–45.
- Janoš P. Determination of equilibrium constants from chromatographic and electrophoretic measurements.J Chromatogr A. 2004;1037:15–28.
- Pool SK, Patel S, Dehring K, et al. Determination of acid dissociation constants by capillary electrophoresis. J Chromatogr A. 2004;1037:445–454.
- Wan H, Holmen A, Nagard M, et al. Rapid screening of pKa values of pharmaceuticals by pressure-assisted capillary electrophoresis combined with short-end injection. J Chromatogr A. 2002;979:369–377.
- Ornskov E, Linusson A, Folestad S. Determination of dissociation constants of labile drug compounds by capillary electrophoresis. J Pharm Biomed Anal. 2003;33:379–391.
- Pool CF. The essence of chromatography. Amsterdam: Elsevier; 2003. 623.
- Savic JS, Dilber SP, Vujic ZB, et al. Modified RP-HPLC method for the determination of the pKa values of synthesized β-hydroxy-β-arylalkanoic acids. J Serb Chem Soc. 2018;83:875–883.
- El Sherbiny D, Wahba MEK. Studying drug-drug interaction through chromatographic analysis of two mixtures offering antimicrobial synergism. J Chromatogr B. 2019;1104:1–10.
- El Sherbiny D, Wahba MEK. Analysis of some pharmaceuticals in the presence of their synthetic impurities by applying hybrid micelle liquid chromatography. Open Chem. 2020;18:377–390.
- Ruiz-Ángel MJ, Carda-Broch S, Torres-Lapasió JR, et al. Retention mechanisms in micellar liquid chromatography. J Chromatogr A. 2009;1216:1798–1814.
- Torres-Lapasio JR, Baeza-Baeza JJ, Garcia-Alverez-Coque MC. Description of the retention behavior in micellar liquid chromatography as a function of pH, surfactant and modifier concentration. J Chromatogr A. 1997;769:155–168.
- Manderscheid M, Eichinger T. Determination of pKa values by liquid chromatography. J Chromatogr Sci. 2003;41:323–326.
- Everaerts FM, Beckers JL, Verheggen TM. Isotachophoresis, theory, instrumention and applications. Amsterdam: Elsevier Scientific Publishing Co.; 1976.
- Jiménez O, Marina ML. Retention modeling in micellar liquid chromatography. J Chromatogr A. 1997;780:149–163.
- Ghimire Y, Amatya S, Shah SK, et al. Thermodynamic properties, and contact angles of CTAB and SDS in acetone–water mixtures at different temperatures. SN Appl Sci. 2020;2:1295–1314.
- Ertokus GP, Aktas AH. Potentiometric determination of pKa values of benzoic acid and substituted benzoic acid compounds in acetonitrile-water mixtures. Asian J Chem. 2009;21:3825–3835.
- Beale JM, Block JH. Organic, medicinal, and pharmaceutical chemistry. Twelfth Edition. London: Wolters Kluwer, Lippincott Williams & Wilkins; 2010.