
 ?Mathematical formulae have been encoded as MathML and are displayed in this HTML version using MathJax in order to improve their display. Uncheck the box to turn MathJax off. This feature requires Javascript. Click on a formula to zoom.
Abstract
The functional properties of polyvinyl pyrrolidone/polyvinyl alcohol (PVP/PVA) blend incorporated with non-stoichiometric tin sulphide (SnS) have been explored for optoelectronic devices. PVP/PVA blend incorporated with non-stoichiometric Sn/S ratios (1:0.8–1:1.2) of 1.0 wt.% SnS were prepared by casting method. The effect of the non-stoichiometric Sn/S ratio of SnS on the structure, optical and photoluminescent (PL) properties of the composite was examined by Fourier transform infrared, UV-visible-NIR and photoluminescence spectrophotometers. The optical band gap energy decreases, while Urbach energy increases via SnS incorporation. The lattice dielectric constant is improved about three times, while the free carriers’ concentration to the effective mass is enhanced by one order of magnitude due to SnS1.2 incorporating. PL measurements reveal that PVP/PVA blends incorporated with SnS could emit spectra in the visible region. Designing the optical and photoluminescent properties of the PVP/PVA blend reveal their role in advanced optoelectronic devices.
1. Introduction
In the last decade, polymer composites have been paying exclusive attention due to their potential role in a variety of disciplines. Polymers have gained this level of concern because of their attractive features like flexibility, abundance, and cost savings [Citation1–7]. Moreover, the ability to modify their properties qualifies them effectively to serve in many applications. This goal can be achieved by either blending several homopolymers or filling them with specific materials to match specific uses. These applications comprise optoelectronics, light emitting diodes (LEDs), photovoltaics, shielding, energy storage, bio and medical ones [Citation8–18]. Particularly, polyvinyl pyrrolidone (PVP) and polyvinyl alcohol (PVA) are greatly appreciated due to their novel characteristics over other polymers such as their eco-environmentally, biodegradability, non-toxicity and water solubility [Citation8,Citation11,Citation12,Citation19,Citation20]. Furthermore, the existence of the hydroxyl groups in the PVA structure that causes its polarity nature makes it an ideal host matrix for a lot of fillers. Additionally, its’ relative high optical transmittance for the visible and IR spectra and semi crystallinity nature are required in many applications [Citation21–24]. While the carbonyl groups and the pyrrolidone rings that exist in the PVP structure lead to a stable adhesion when used as a host matrix [Citation2]. The combination of these attractive features of PVP and PVA polymers can be achieved by blending them with an appropriate ratio. The PVP/PVA polymeric blend is qualified for advanced applications like energy storage devices and nanoelectronics [Citation5]. Naggar et al. explored the effect of Sn0.75M0.25S2 (M: metal) nanoparticles (NPs) on the structural and optical properties of PVA/PVP blend [Citation25]. Heiba group showed that the optical band gap energy of the PVA/PVP blend could be tailored by Cu/MnS embedding [Citation26]. Dhatarwal and Sengwa examined the influence of Al2O3 NPs content on the optical parameters of the PVA/PVP blend [Citation5]. They found that the optical parameter could be tailored via controlling Al2O3 NPs concentration. Sun researches group explored the effect of magnetic field on Fe3O4@TiO2 blended PVDF membranes [Citation27]. Abutalib and Rajeh showed that the band gap energy of sodium alginate/polyaniline blend could be decreased by TiO2 incorporating {Abutalib, 2020 #3953}. The incorporation effect of Ag2S in the blend of PVA/PVP refractive index and dielectric constants was carried out by Aziz group [Citation28]. Also, the concentration effect of multi-walled carbon nanotubes (MWCNTs) on the physical properties was studied by Zidan research group [Citation29]. The effect of the dispersed zinc oxide (ZnO) nanoparticles (NPs) in the PVA/PVP blend was investigated for microelectronic applications by Choudhary and Sengwa [Citation23]. Furthermore, the correlation between the cadmium chloride (CdCl2) content filled PVA/PVP blend and its’ physical properties were explored by Baraker and Lobo [Citation30]. In our previous work, the optical properties of the PVA/PVP blend were engineered by controlling the amount of tin sulphide (SnS) NPs for use in optoelectronics [Citation1]. We found that the optical bandgap of the PVA/PVP blend could be tuned from 5.02 eV to 1.15 eV as the content of SnS was upraised from 0 to 10 wt.%.
As explored above, the majority of the previously published work was focused on the effect of the fillers’ concentration on the physical properties of the PVA/PVP blend. Whereas, controlling the blend’s optical and photoluminescent properties by varying the non-stoichiometric composition ratio has not been attempted so far, based on our best literature survey. For that, this work aims to design the optical and photoluminescent properties of the PVP/PVA blend by controlling the non-stoichiometric Sn/S ratio of the filler SnS. SnS is selected for this task because of its gorgeous properties like non-toxicity, abundance, eco-environment and biocompatibility. Moreover, due to SnS bandgap (∼ 1.3 eV [Citation1]) and high absorption coefficient (∼105 cm−1 [Citation31]), it can serve as a potential filler in the PVP/PVA blend for various applications such as supercapacitors, energy storing and optoelectronic devices. Different non-stoichiometric Sn/S molar ratios (1:0.8, 1:0.9, 1:1, 1:1.1 and 1:1.2) of SnS incorporated PVP/PVA blend (wt. ratio of 25/75) have been prepared via casting technique. The effect of the non-stoichiometric Sn/S ratio on the blend’s structure, optical and PL properties has been examined by FTIR, UV-Vis-NIR and PL spectrophotometers, respectively. The obtained results reveal that the optical and PL of the PVP/PVA blend can be tuned via controlling the Sn/S molar ratio of the filler. Our findings recommend greatly the designing of PVP/PVA blend via controlling non-stoichiometric Sn/S for optoelectronics applications.
2. Methods and materials
To synthesize the non-stoichiometric Sn/S molar ratio of SnS incorporated PVP/PVP nanocomposite blends, many raw materials were obtained. Tin (II) chloride dihydrate (SnCl2.2H2O) and sodium sulfide nonahydrate (Na2S.9H2O) were purchased from Sigma-Aldrich Co. PVP powder (4 × 10⁴ g.mol.−1) and PVA granules (8.5 × 10⁴ g.mol.−1) were provided by Alfa Aesar Co. Distilled water (DW) was utilized as a solvent for all the solutions. The solution casting technique was followed to prepare the samples as discussed in our previous works [Citation2,Citation19]. Initially, 1.5 g of PVA granules were dissolved in 45 ml of distilled water at 70 oC with continuous heating and magnetic stirring for 3 h until a transparent viscous solution was found. Similarly, 0.5 g of PVP powder was dissolved in 15 ml of DW at room temperature with stirring for 3 h. Then, the previous two solutions were mixed and stirred for 3 h until a homogeneous PVP/PVA blend with a weight ratio of 25/75 was obtained. Next, two solutions (0.1M) of Sn2+ and S2− precursors were separately prepared at room temperature by dissolving the specific amounts of SnCl2 and Na2S in DW with continuous stirring. Then, the Sn2+ precursors were added slowly to the PVP/PVP blend solution with stirring for 30 min. After that, a specific S2− precursors’ ratio was added and stirred for 30 min to the previous blend solution to form the non-stoichiometric Sn/S ratio of SnS incorporated PVP/PVA (1 wt.%) composite colloidal solution. In addition to the pure PVP/PVA blend solution, five non-stoichiometric Sn/S molar ratios (1:0.8, 1:0.9, 1:1, 1:1.1 and 1:1.2) of SnS incorporated PVP/PVP composite blends were prepared. After that, all the prepared solutions were separately poured in Petri dishes and placed in an oven at 55°C for 24 h. Finally, the films were gently extracted out, labeled as Sx (x: denotes S molar ratio) and left for the next examinations.
The variations in the PVP/PVA backbone structure and the absorption bands due to the SnS filling of the non-stoichiometric Sn/S ratios were examined by a Fourier transform infrared spectrophotometer (FTIR; Shimadzu, IRAffinity-1S). The photoluminescence (PL) measurements were carried out using a PerkinElmer fluorescence spectrometer (LS 55 model) under 330 nm excitation wavelength. Also, a UV-Vis-NIR (JASCO; V-670) spectrophotometer was used to investigate the optical transmittance (T) and absorbance (A) of the prepared films over the wavelength range from 190 nm to 1400 nm. While the other optical parameters including the reflectance (R), absorption coefficient (α), extinction coefficient (K), energy bandgap (Eg) were determined as: [Citation19,Citation32–40]:
(1)
(1)
(2)
(2)
(3)
(3)
(4)
(4) where d is the samples’ thickness (���= 0.22 mm ± 0.01 mm), λ is the wavelength of the incident photons, B is a constant, h is Planck’s constant and m is a parameter relates to the kind of the electronic transitions. m takes the value of 0.5 or 2 for allowed direct or indirect allowed electron transitions respectively. While the localized electronic energy states (defects) that produced in the samples due to the non-stoichiometric Sn/S ratio were analysed using the Urbach energy (Eu) relation given as [Citation5]:
(5)
(5) Furthermore, the refractive index (n), real (εr) and imaginary (εi) dielectric constants and optical conductivity (σopt.) of the prepared films were calculated as [Citation1]:
(6)
(6)
(7)
(7)
(8)
(8)
Moreover, the single oscillator or so-called Wemple-DiDomenico (WDD) model was used to investigate the energy dispersion parameters (E0 and Ed) in the non-absorption spectra regions [Citation41–43]. While the single term Sellmeier oscillator relations were used to determine the refractive index at infinity (n), average inter-band oscillator wavelength (λ0), average oscillator strength (S0), infinite dielectric constant (ε
), lattice dielectric constant (εL) and the free carrier concentration to the effective mass ratio (N/m*) from the following equations [Citation1,Citation44–46]:
(9)
(9)
(10)
(10)
(11)
(11)
(12)
(12)
(13)
(13)
(14)
(14) where e and ε0 are the free electron charge and space dielectric constant respectively.
3. Results and discussion
3.1. FTIR analysis
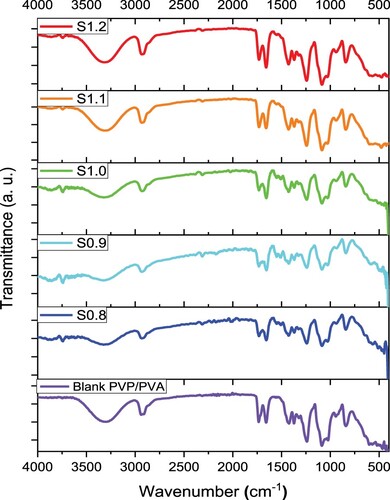
The variation in the structure of the host PVP/PVA blend due to filling with SnS of a non-stoichiometric Sn/S ratio has been explored via FTIR spectroscopy. Figure illustrates the FTIR transmittance spectra of the pure film over the scanned wavenumber range from 4000 cm−1–400 cm−1. Clear absorption bands that related to the host PVP/PVA blend and the filler SnS are noticed in the FTIR spectra. The broad absorption band located at 3302 cm−1 corresponds to the stretching vibration of O-H groups of the host PVP/PVA blend [Citation1,Citation47]. The absorption peaks detected at 2924 cm−1, 1724cm−1 and 1659 cm−1 are ascribed to the asymmetric of CH2 [Citation29], stretching of C ═ O [Citation48,Citation49], stretching of C ═ C [Citation29] vibrations of PVA, respectively. The peaks located at 1433 and 1370 cm−1 correspond to symmetric bending vibration of CH2 in PVA [Citation29] and C–H wagging vibration of PVP [Citation50], respectively. The stretching vibration of C–C gives a rise of the absorption peak at 1240 cm−1 [Citation50]. While the C–O stretching vibration of PVA results from an absorption band at 1090 cm−1 [Citation29]. The O-H bending and C–O stretching vibrations together cause the absorption band located at 1025 cm−1 [Citation51]. The band located at 940 and 832 cm−1 are ascribed to C–C stretching vibrations [Citation29,Citation51]. Whereas, the absorption bands located in the wavenumber range from 780 cm−1–400 cm−1 are ascribed to Sn-S bond stretching and O-H wagging vibrations [Citation29,Citation52]. Similar findings were reported in Ref. [Citation52]. Also, a clear shift in the absorption peak location due to the variation in the non-stoichiometric Sn/S ratio of the SnS filler. While a clear variation in the intensity of the FTIR absorption spectra confirms the interaction and complexation of the host PVP/PVA matrix with the filler as well as the effect of the non-stoichiometric Sn/S ratio as clearly noticed between 500 and 400 cm−1. This variation in the FTIR intensity originates from the resonance interaction of the sulfur vibrational modes as well as its ratio [Citation53]. Similar results related to the non-stoichiometric of Mn/S ratio were concluded by Heiba et al.[Citation35,Citation53]. The variation in the intensity of the FTIR spectra exhibits a significant variation in the optical and PL properties of the prepared incorporated films.
Figure 1. FTIR spectra of the samples.
3.2. Optical properties studies
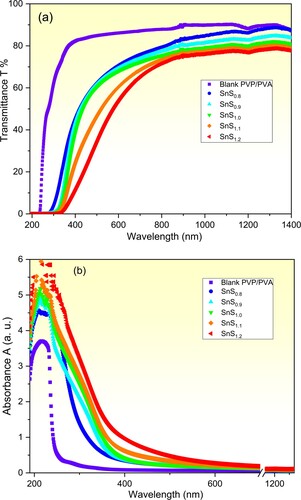
The optical transmittance (T) and absorbance (A) of the pure and SnSx incorporated PVP/PVA blend films over the wavelength range from 190 nm to 1400 nm are depicted in Figure (a) and (b) respectively. It is observed that the pure film exhibits a cut-off edge at 240 nm. While this edge is red-shifted to longer wavelengths reaching 345 nm as the non-stoichiometric ratio of Sn/S is varied from 1:0.8–1:1.2. Also, the transmittance (T) spectrum of the pure PVP/PVA film exhibits a transmittance of more than 80% in the Vis-NIR regions which is compatible with the reported data [Citation1,Citation5]. Furthermore, it is noticed that as the Sn/S non-stoichiometric ratio is raised from 1:0.8–1:1.2, the transmittance of the incorporated films decreases in the Vis-NIR regions. This tailoring of the optical transmittance by varying the non-stoichiometric Sn/S ratio of the filler SnS incorporated PVP/PVA films recommends them for new optical applications. Moreover, according to the absorbance spectra (Figure (b)), all films have an absorption peak around 212 nm that refers to π→π* inter-band electronic transitions of the pure PVP/PVA matrix [Citation54,Citation55]. While the absorption edge of the incorporated films is red-shifted to longer wavelengths due to the variation in the non-stoichiometric ratio of Sn/S of the filler from 1:0.8–1:1.2. This result implies a decrease in the optical bandgap of the incorporated film.
Figure 2. (a) The transmittance and (b) absorbance spectra of the samples.
The optical absorption coefficient (α) is an optical parameter that relates to the electronic transition due to such exciting irradiation. This property plays a dominant role in dictating the optical application of the understudied films. For that, the dependence of α value of the samples was determined using equation Equation4(4)
(4) and displayed in Figure (a). First, it is clear that the absorption of the pure film in the Vis-NIR spectra region is limited. While the absorption edge of the incorporated films is red-shifted to cover the visible spectra region as the non-stoichiometric Sn/S ratio is varied from 1: 0.8–1:1.2. Also, the optical band gap energy (Eg. Abs) values of all prepared films are deduced and listed in Table . The Eg. Abs of the pure PVP/PVA blend is 5.07 eV which is consistent with the published value [Citation5]. While Eg. Abs value of the incorporated films decreases from 3.72 eV to 2.79 eV as Sn/S ratio is varied from 1: 0.8–1:1.2 respectively. Moreover, the optical band gap energy (direct Egd and indirect Egi) of the prepared films was determined by applying Tauc’s relation (EquationEq. 4
(4)
(4) ), where m = 0.5 for the direct electronic transitions and 2 for the indirect ones. For that, plots of (αhν)2 and (αhν)0.5 values as a function of the incident photons energy are performed as presented in Figure (b) and (c) respectively. The extrapolated linear parts of the plotted curves to meet hν = 0 represent the Eg values. Table includes the obtained Egd and Egi values of the pure and different Sn/S ratios of SnS incorporated PVP/PVA films. It is observed that the Egd of the pure film equals 5.20 eV, which agrees with the reported one [Citation23]. Also, it is clear that both Egd and Egi values decrease in non-linear behaviour as the ratio of Sn/S value is increased from 1:0.8–1:1.2 as depicted in Figure . This decrease in Eg. Abs value is attributed to the increase in the defects and vacancies. Similarly, Choudhary and Sengwa concluded that Egd of the pure blend decreased via ZnO filling [Citation23]. This novel finding of tuning the bandgap of the PVP/PVA blend via non-stoichiometric control of Sn/S ratio of the filler SnS is greatly appreciated for designing optoelectronic devices.
Figure 3. Plots of the absorption coefficient (a) and Tauc’s (b and c) of pure and incorporated PVP/PVA films.
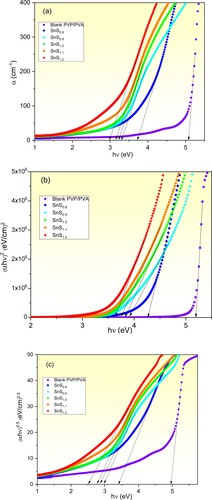
Figure 4. The dependence of Eg value of pure and incorporated PVP/PVA films on the Sn/S ratio.
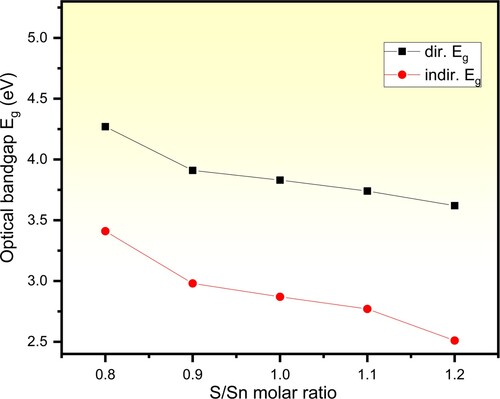
Table 1. The Eg and Eu values of pure and PVP/PVA incorporated with SnSx films.
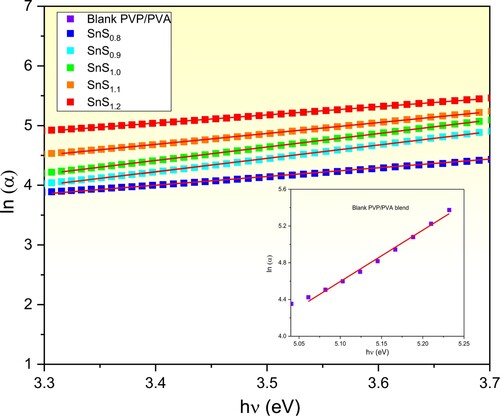
Furthermore, exploring the Urbach energy (Eu) of the films has been performed to investigate the created defects and impurities in the composite films due to incorporating with SnS of the non-stoichiometric Sn/S ratio [Citation29,Citation56,Citation57]. These defects represent the disordering degree of the samples. It is worth noting that Eu value considers the tail’s width of the localized energy states in the optical bandgap of such material [Citation5,Citation23]. These tails behave in an exponential manner as shown in equation Equation5(5)
(5) . Eu values of the samples are estimated by plotting ln (α) curves of the prepared films versus hν below the absorption edges as shown in Figure . These plots behave linearly where the slope values equal 1/Eu of the films. The estimated Eu values are also tabulated in Table . It is noticed that Eu of the pure film is 0.18 eV which is in good agreement with Ref. [Citation5]. Whereas, Eu of the incorporated films increases from 0.40 eV to 0.74 eV as the Sn/S ratio is upraised from 1:0.8–1:1.2. Similar results were reported in the literature [Citation5,Citation25,Citation58].
Figure 5. Plots of ln (α) vs hν of pure and incorporated PVP/PVA films.
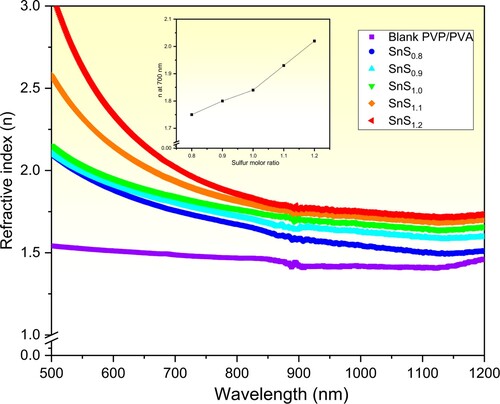
Furthermore, for dictating the possible applications of pure and incorporated PVP/PVA films in optics and optoelectronics, the refractive index (n) and dielectric parameters (εr and εi) values have been determined using equations: 6, 7 and 8 respectively. Figure illustrates the plots of the refractive index of the pure and incorporated PVP/PVA films on the incident wavelength in the non-absorbed spectra regions (λ> 500 nm). It is observed that n of the pure PVP/PVA film remains quasi-constant and behaves wavelength independently in both the Vis-NIR regions. While n of the incorporated films decreases steeply in the absorbing region and then tends to a stable status beyond that in both the visible and NIR regions. Moreover, at any specific λ, n value of the incorporated films increases as the Sn/S ratio is increased from 1:0.8–1:1.2 as displayed in the inset of Figure for n at λ = 700 nm. These results can be interpreted in terms of the increase in the reflectance due to the increase in reflecting centres as well as the increase in the density of the incorporated films as compared with the pure one [Citation8,Citation12,Citation59]. This unique conclusion of tuning the refractive index of the pure PVP/PVA blend via controlling the Sn/S ratio of the filler SnS is highly welcomed in designing optical materials for such applications. Similarly, Heiba et al. concluded that the pure PVP/PVA blend could be enhanced via filling with Cu/MnS [Citation26]. In our previous work, we found that the refractive index of the pure PVP/PVA blend could be engineered via controlling the filler SnS concentration [Citation1].
Figure 6. Plots of refractive index vs. wavelength of pure and incorporated PVP/PVA films. The inset shows n dependence on the Sn/S ratio of the filler SnS.
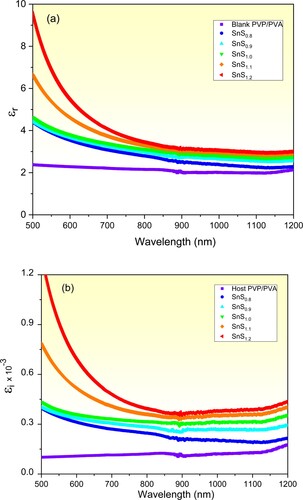
Exploring the capability of such an optical material to energy storage and loss from the incident photons can be obtained via determining its dielectric permittivity constants [Citation1,Citation60]. Figure (a) and (b) presents the dielectric permittivity constant (real εr and imaginary εi) of the pure and incorporated PVP/PVA films versus λ respectively. It is noticed that εr values follow the trend of the absorbance as illustrated in Figure (b). εr of the pure PVP/PVA film behaves independently on the incident wavelength in the non-absorption region (Vis-NIR region). While εr of the incorporated films decreases sharply as λ is increased in the Vis. region and it remains steady in the non-absorption region. Also, an increase in εr value at any certain λ as the Sn/S ratio is increased due to the increase in the absorption amount caused by the decrease in the optical bandgap of the incorporated films. While the increase in the εi values of the incorporated films as compared with the pure one is mainly attributed to the increase in the defects as shown above [Citation12,Citation60]. As a novel result, improving the dielectric permittivity of the pure PVP/PVA blend is achieved via controlling the Sn/S ratio of the filler SnS. It is worth mentioning that enhancement the dielectric constants are greatly welcomed in designing optical energy storage equipment.
Figure 7. The dielectric permittivity (a) real and (b) imaginary parts of the pure and incorporated PVP/PVA films vs. λ.
Moreover, the single oscillator energy (Eo) and the dispersive energy (Ed) are other important constants that can be determined for such an optical material [Citation41]. Both Eo and Ed values of the samples are determined in the non-absorption regions by the Wemple-DiDomenico (WD) model (Equation Equation9(9)
(9) ). To perform that, curves of (n2-1)−1 values of the prepared films are plotted as a function of (hν)2 as displayed in Figure (a). The slope values of the fitted lines and their y-axis intercepts represent −1/(E0Ed) and E0/Ed values respectively. The achieved Eo and Ed values of the pure and incorporated PVP/PVA films are included in Table . The found Eo and Ed values of the pure PVP/PVA film are 5.85 and 6.57 eV respectively, which agree with the literature [Citation5,Citation58]. Also, Eo value of the incorporated films decreases from 3.73 eV to 3.24 eV as the Sn/S ratio of the filler SnS is increased from 1:0.8–1:1.2. Whereas, Ed value of the incorporated films increases from 7.03 eV to 11.12 eV as the Sn/S ratio is increased. The decrease in Eo value is understood in terms of the shrinkage of the optical bandgap as shown in Figure . While the increase in Ed value is attributed to the increase in the defects due to the increase of the Sn/S ratio of the filler SnS [Citation43,Citation61]. Similar achievements were reported in Ref.s [Citation41,Citation62,Citation63].
Figure 8. Plots of (a) (n2-1)−1 vs. (hν)2, (b) (n2-1)−1 vs. λ−2 and (c) n2 vs. λ2 of of the pure and incorporated PVP/PVA films.
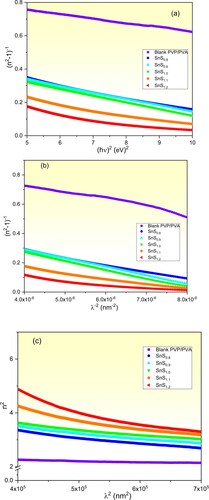
Table 2. The optical properties of pure and incorporated PVP/PVA films.
Furthermore, more optical properties of the prepared films as the inter-band oscillator wavelength (λ0), static refractive index (n), oscillator strength (S0) and infinite dielectric constant (ε
), lattice dielectric constant (εL) and the ratio of free carrier concentration to the effective mass (N/m*) can be deduced using equations 10–14. The slope values and the y-axis intercepts of the fitted lines of (n2-1)−1 plots versus λ−2 symbolize 1/S0 and
respectively as depicted in Figure (b). While the slope values and the y-axis intercepts of the fitted lines of n2 plots versus λ2 symbolize
and ��L respectively as depicted in Figure (c). The obtained values of λ0, n
, S0, ε
, εL and N/m* are also listed in Table . It is noted that these optical parameters of the pure PVP/PVA film are compatible with the reported ones [Citation64–66]. Whereas, these optical parameters are tailored by controlling the Sn/S ratio of the filler SnS. It is clear that n
, S0, ε
and εL are enhanced from 1.75, 2.13, 2.11 and 2.41–2.45, 4, 6.0 and 6.3 as the Sn/S ratio is increased from 1:0.8–1:1.2. For example, the lattice dielectric constant (εL) of the incorporated films is improved about three times as compared with that pure one. These improvements in n
, S0, ε
and εL are mainly caused by the increase in the defects and vacancies in the incorporated films. Moreover, the free carriers’ concentration to the effective mass (N/m*) are enhanced by one order of magnitude due to filling the PVP/PVA blend with SnS1.2 as compared with the pure one. This finding is a result of the free carriers caused by the filling process [Citation29]. These novel results are highly appreciated in industrial applications as storage energy and optical devices. Our results agree with the published ones [Citation64–67].
3.3. Photoluminescence studies
To dictate the possible applications of the pure and incorporated PVP/PVA films in LEDs and bio uses, the PL measurements must be performed. PL measurements present information about the intrinsic and radiative recombination processes in the prepared films [Citation25,Citation68]. Figure (a) to (f) illustrates the PL spectra of the samples with an excitation wavelength (λexc) of 330 nm at room temperature. The asymmetric behaviour of the obtained PL spectra is noticed which reveals the interaction of the emission peaks. The Gaussian fitting technique is performed to deconvolute the obtained PL spectra as illustrated in Figure . A clear variation in the peaks’ position, as well as their intensities, is detected and tabulated (Table ). As recorded in Table , three deconvoluted emission peaks at 378 nm (ultraviolet), 400 nm (violet), 427 nm (violet) are distinguished in the PL of the pure PVP/PVA film. These PL sub-peaks refer to the π* → n electronic transition in the OH group [Citation69–71]. Similar findings were reported in Ref.s [Citation25,Citation72]. Whereas, the PL spectra of the incorporated films are red-shifted as compared with the pure one. Also, new sub emission peaks are recorded in the visible spectrum region including blue, cyan and green colours. Furthermore, as the Sn/S ratio is increased from 1:0.8–1:1.2, the peak’s position of the maximum intensity shifts to longer wavelengths. These results can be interpreted in terms of the electronic transitions between sulfur vacancies and interstitial sulfur to the trap states [Citation35,Citation73,Citation74]. While the red-shift in the peaks’ position and the variation in their intensities are produced due to the increase in the defects’ density as shown above due to the increase in the Sn/S ratio of the filler SnS [Citation25,Citation75]. A schematic diagram of the electronic transition and emission of the samples is presented in Figure . Our PL findings are highly appreciated in a lot of applications.
Figure 9. PL spectra of pure and incorporated PVP/PVA films.
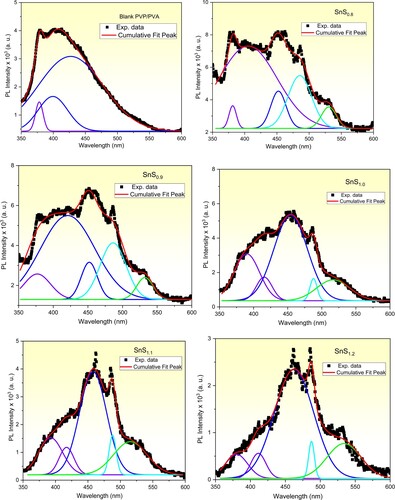
Figure 10. A schematic diagram of the electronic transitions and emissions of (a) pure and (b) SnSx incorporated PVP/PVA blends.
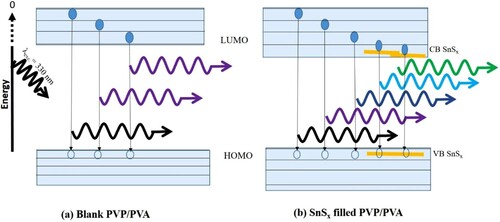
Table 3. PL peaks positions of SnSx incorporated PVP/PVA blends.
5. Conclusions
Non-stoichiometric SnS incorporated PVP/PVA (1.0 wt.%) blend were prepared by casting methods for optoelectronic applications. The FTIR, optical and photoluminescence (PL) of the pure and incorporated films have been explored. The FTIR measurements reveal the successful incorporation of the non-stoichiometric SnS in the host PVP/PVA matrix. Clear shift in the absorption peak locations as well as their intensities due to the variation in the non-stoichiometric Sn/S ratio of the SnS filler. The optical energy bandgap has been tuned from 5.20 eV (pure PVP/PVA) to 3.62 eV, while the Urbach energy is increased from 0.18 eV to 0.74 eV via filling with SnS1.2. Furthermore, the dispersive energy increases from 6.57 eV to 11.12 eV, whereas the single oscillator energy is decreased from 5.85 eV to 3.24 eV due to the non-stoichiometric SnS molar ratio. Also, the lattice dielectric constant of the incorporated films is improved about three times, whereas the free carriers’ concentration to the effective mass is enhanced by one order of magnitude due to SnS1.2 filling. Three photoluminescence (PL) emission peaks at 378 nm (ultraviolet), 400 nm (violet), 427 nm (violet) are distinguished in the PL of the pure PVP/PVA film. The PL of the PVP/PVA blend is tailored to emit spectra in the visible spectrum region;cyan, blue and green colours. The obtained findings of designing the optical and photoluminescent properties of PVP/PVA blend reveal their effective role in advanced optoelectronic.
Declaration of competing interest
The authors report no declarations of interest.
Acknowledgment
The authors thank Taif University Researchers Supporting Project number (TURSP-2020/248), Taif University, Taif, Saudi Arabia.
Disclosure statement
No potential conflict of interest was reported by the author(s).
Additional information
Funding
References
- Badawi A. Engineering the optical properties of PVA/PVP polymeric blend in situ using tin sulfide for optoelectronics. Appl Phys A. 2020;126(5):335.
- Badawi A. Enhancement of the optical properties of PVP using Zn1-xSnxS for UV-region optical applications. Appl Phys A. 2021;127(1):51.
- Badawi A, Alharthi SS. Controlling the optical and mechanical properties of polyvinyl alcohol using Ag2S semiconductor for environmentally friendly applications. Mater Sci Semicond Process. 2020;116:105139.
- Heiba ZK, Mohamed MB, Badawi A, et al. The role of Cd0.9Mg0.1S nanofillers on the structural, optical, and dielectric properties of PVA/CMC polymeric blend. Chem Phys Lett. 2021;770:138460.
- Dhatarwal P, Sengwa RJ. Investigation on the optical properties of (PVP/PVA)/Al2O3 nanocomposite films for green disposable optoelectronics. Phys B. 2021;613:412989.
- Atta A, Abdelhamied MM, Abdelreheem AM, et al. Effects of polyaniline and silver nanoparticles on the structural characteristics and electrical properties of methylcellulose polymeric films. Inorg Chem Commun. 2022;135:109085.
- Alsulami QA, Rajeh A. Structural, thermal, optical characterizations of polyaniline/polymethyl methacrylate composite doped by titanium dioxide nanoparticles as an application in optoelectronic devices. Opt Mater. 2022;123:111820.
- Badawi A, Mersal GAM, Shaltout AA, et al. Exploring the structural and optical properties of FeS filled graphene/PVA blend for environmental-friendly applications. J Polym Res. 2021;28(7):270.
- Badawi A, Alharthi SS, Mostafa NY, et al. Effect of carbon quantum dots on the optical and electrical properties of polyvinylidene fluoride polymer for optoelectronic applications. Appl Phys A. 2019;125(12):858.
- Khairy Y, Mohammed MI, Elsaeedy HI, et al. Optical and electrical properties of SnBr2-doped polyvinyl alcohol (PVA) polymeric solid electrolyte for electronic and optoelectronic applications. Optik (Stuttg). 2021;228:166129.
- Issa SAM, Zakaly HMH, Pyshkina M, et al. Structure, optical, and radiation shielding properties of PVA–BaTiO3 nanocomposite films: An experimental investigation. Radiat Phys Chem. 2021;180:109281.
- Badawi A, Alharthi SS, Assaedi H, et al. Cd0.9Co0.1S nanostructures concentration study on the structural and optical properties of SWCNTs/PVA blend. Chem Phys Lett. 2021;775:138701.
- Alharthi SS, Alzahrani A, Razvi MAN, et al. Spectroscopic and electrical properties of Ag2S/PVA nanocomposite films for visible-light optoelectronic devices. J Inorg Organomet Polym Mater. 2020;30(10):3878–3885.
- Soliman TS, Zaki MF, Hessien MM, et al. The structure and optical properties of PVA-BaTiO3 nanocomposite films. Opt Mater. 2020;111:110648. doi:10.1016/j.optmat.2020.110648.
- Badawi A, Alharthi SS. Tailoring the photoluminescent and electrical properties of tin-doped ZnS@PVP polymeric composite films for LEDs applications. Superlattices Microstruct. 2021;151C:106838.
- Al-Osaimi J, Al-Hosiny N, Abdallah S, et al. Characterization of optical, thermal and electrical properties of SWCNTs/PMMA nanocomposite films. Iran Polym J. 2014;23(6):437–443.
- Xu F, Yang Y, Liu Y, et al. Ferrite ceramic filled poly-dimethylsiloxane composite with enhanced magnetic-dielectric properties as substrate material for flexible electronics. Ceram Int. 2021;47(13):18246–18251.
- Abdeltwab E, Atta A. Influence of ZnO nanoadditives on the structural characteristics and dielectric properties of PVA. Int J Mod Phys B. 2021;35(30):2150310.
- Badawi A, Alharthi SS, Alotaibi AA, et al. Investigation of the mechanical and electrical properties of SnS filled PVP/PVA polymeric composite blends. J Polym Res. 2021;28(6):205.
- Eslam A, Ali A. Structural and electrical properties of irradiated flexible ZnO/PVA nanocomposite films. Surf Innov. 2022;0(0):1–9. doi:10.1680/jsuin.21.00045.
- El Sayed AM, Morsi WM. α-Fe2O3 /(PVA + PEG) nanocomposite films; synthesis, optical, and dielectric characterizations. J Mater Sci. 2014;49(15):5378–5387.
- Bouzidi A, Jilani W, Yahia IS, et al. Optical analysis and UV-blocking filter of cadmium iodide-doped polyvinyl alcohol polymeric composite films: synthesis and dielectric properties. J Inorg Organomet Polym Mater. 2020;30(10):3940–3952.
- Choudhary S, Sengwa RJ. Zno nanoparticles dispersed PVA–PVP blend matrix based high performance flexible nanodielectrics for multifunctional microelectronic devices. Curr Appl Phys. 2018;18(9):1041–1058.
- Abdelhamied MM, Atta A, Abdelreheem AM, et al. Oxygen ion induced variations in the structural and linear/nonlinear optical properties of the PVA/PANI/Ag nanocomposite film. Inorg Chem Commun. 2021;133:108926.
- El-naggar AM, Heiba ZK, Mohamed MB, et al. Embedding of 50%PVA/50%PVP blend with Sn0.75M0.25S2, (M = Y, Fe, Cr, V); structural and optical study. Appl Phys A. 2021;127(10):753.
- Heiba ZK, Mohamed MB, Ahmed SI, et al. Tailoring the optical properties of PVA/PVP blend by doping with Cu/MnS nanoparticles. J Vinyl Add Tech. 2021;27(2):410–418.
- Sun J, Li S, Ran Z, et al. Preparation of Fe3O4@TiO2 blended PVDF membrane by magnetic coagulation bath and its permeability and pollution resistance. J Mater Res Technol. 2020;9(3):4951–4967.
- Aziz SB, Rasheed MA, Hussein AM, et al. Fabrication of polymer blend composites based on [PVA-PVP](1−x):(Ag2S)x (0.01 ≤ x ≤ 0.03) with small optical band gaps: structural and optical properties. Mater Sci Semicond Process. 2017;71:197–203.
- Zidan HM, Abdelrazek EM, Abdelghany AM, et al. Characterization and some physical studies of PVA/PVP filled with MWCNTs. J Mater Res Technol. 2019;8(1):904–913.
- Baraker BM, Lobo B. Microstructure of cadmium chloride doped PVA/PVP blend films. Mater Today: Proc. 2018;5(1, Part 3):3036–3043.
- Badawi A, Al-Baradi AM, Atta AA, et al. Graphene/TiO2 nanocomposite electrodes sensitized with tin sulfide quantum dots for energy issues. Physica E. 2020;121:114121.
- Taha TA. Optical properties of PVC/Al2O3 nanocomposite films. Polym Bull. 2019;76(2):903–918.
- Al-Hosiny NM, Alharthi SS, Badawi A. Optical properties of solar irradiated gafchromic EBT films. J Mater Res Technol. 2021;14:1914–1920.
- Badawi A, Althobaiti MG, Alharthi SS, et al. Tailoring the optical properties of CdO nanostructures via barium doping for optical windows applications. Phys Lett A. 2021;411:127553.
- Heiba ZK, Mohamed MB, Badawi A, et al. Effect of sulfur deficiency on the structural, optical and electronic properties of MnS nanostructures. Chem Phys Lett. 2021;779:138877.
- Badawi A, Althobaiti MG. Effect of Cu-doping on the structure, FT-IR and optical properties of Titania for environmental-friendly applications. Ceram Int. 2021;47(8):11777–11785.
- Abdullah OG, Aziz SB, Rasheed MA. Structural and optical characterization of PVA:KMnO4 based solid polymer electrolyte. Results Phys. 2016;6:1103–1108.
- Badawi A, Al-Gurashi WO, Al-Baradi AM, et al. Photoacoustic spectroscopy as a non-destructive technique for optical properties measurements of nanostructures. Optik (Stuttg). 2020;201:163389.
- Badawi A, Al Otaibi AH, Albaradi AM, et al. Tailoring the energy band gap of alloyed Pb1−xZnxS quantum dots for photovoltaic applications. J Mater Sci Mater Electron. 2018;29(24):20914–20922.
- Tauc J. Amorphous and liquid semiconductors. Boston: Springer; 1974.
- Abdullah OG, Aziz SB, Omer KM, et al. Reducing the optical band gap of polyvinyl alcohol (PVA) based nanocomposite. J Mater Sci. 2015;26(7):5303–5309.
- Wemple SH, DiDomenico M. Behavior of the electronic dielectric constant in covalent and ionic materials. Phys Rev B. 1971;3(4):1338–1351.
- Atta AA, El-Nahass MM, Elsabawy KM, et al. Optical characteristics of transparent samarium oxide thin films deposited by the radio-frequency sputtering technique. Pramana. 2016;87(5):72.
- Naik R, Aparimita A, Sripan C, et al. Structural, linear and non-linear optical properties of annealed and irradiated Ag/Se heterostructure films for optoelectronic applications. Optik (Stuttg). 2019;194:162894.
- Palik ED. Handbook of optical constants of solids. Newyork: Academic Press Handbook; 1985.
- Abdelrazek EM, Ragab HM. Spectroscopic and dielectric study of iodine chloride doped PVA/PVP blend. Indian J Phys. 2015;89(6):577–585.
- Ali FM, Kershi RM, Sayed MA, et al. Evaluation of structural and optical properties of Ce3+ ions doped (PVA/PVP) composite films for new organic semiconductors. Phys B. 2018;538:160–166.
- Bhajantri RF, Ravindrachary V, Poojary B, et al. Studies on fluorescent PVA + PVP + MPDMAPP composite films. Polym Eng. Sci. 2009;49(5):903–909.
- Rajendran S, Sivakumar M, Subadevi R. Investigations on the effect of various plasticizers in PVA–PMMA solid polymer blend electrolytes. Mater Lett. 2004;58(5):641–649.
- Irfan M, Manjunath A, Mahesh SS, et al. Influence of NaF salt doping on electrical and optical properties of PVA/PVP polymer blend electrolyte films for battery application. J Mater Sci: Mater Electron. 2021;32(5):5520–5537.
- Muntaz Begum S, Ravindranadh K, Ravikumar RVSSN, et al. Structural and luminescent properties of PVA capped ZnSe nanoparticles. Mater Res Innovations. 2018;22(1):37–42.
- Javed A, Khan N, Bashir S, et al. Thickness dependent structural, electrical and optical properties of cubic SnS thin films. Mater Chem Phys. 2020;246:122831.
- Heiba ZK, Albassam AA, Mohamed MB. Effect of Zn/S non-stoichiometric ratio on the structural, optical and electronic properties of nano-ZnS. Appl Phys A. 2020;126(6):479.
- Sankhla A, Sharma R, Yadav RS, et al. Biosynthesis and characterization of cadmium sulfide nanoparticles – An emphasis of zeta potential behavior due to capping. Mater Chem Phys. 2016;170:44–51.
- Bhajantri RF, Ravindrachary V, Harisha A, et al. Microstructural studies on BaCl2 doped poly(vinyl alcohol). Polymer. 2006;47(10):3591–3598.
- Rashad M, Saudi HA, Zakaly HMH, et al. Control optical characterizations of Ta+5–doped B2O3–Si2O–CaO–BaO glasses by irradiation dose. Opt Mater. 2021;112:110613.
- Al-Baradi AM, Altowairqi FA, Atta AA, et al. Structural and optical characteristics features of RF sputtered CdS/ZnO thin films. Chin Phys B. 2020;29(8):080702.
- Soliman TS, Vshivkov SA, Elkalashy SI. Structural, linear and nonlinear optical properties of Ni nanoparticles – polyvinyl alcohol nanocomposite films for optoelectronic applications. Opt Mater. 2020;107:110037.
- Alrowaili ZA, Taha TA, El-Nasser KS, et al. Significant enhanced optical parameters of PVA-Y2O3 polymer nanocomposite films. J Inorg Organomet Polym Mater. 2021;31(7):3101–3110.
- Heiba ZK, Bakr Mohamed M, Ahmed SI. Exploring the physical propertiesn of PVA/PEG polymeric material upon doping with nano gadolinium oxide. Alexandria Eng J. 2022;61(5):3375–3383.
- Heiba ZK, Mohamed MB. Effect of annealed and Mg-doped nano ZnO on physical properties of PVA. J Mol Struct. 2019;1181:507–517.
- Muhammad FF, Aziz SB, Hussein SA. Effect of the dopant salt on the optical parameters of PVA:NaNO3 solid polymer electrolyte. J Mater Sci: Mater Electron. 2015;26(1):521–529.
- Almarashi JQM, Abdel-Kader MH. Exploring Nano-sulfide enhancements on the optical, structural and thermal properties of polymeric nanocomposites. J Inorg Organomet Polym Mater. 2020;30(8):3230–3240.
- Alhazime AA, Mohamed MB, Abdel-Kader MH. Effect of Zn1−xMgxS doping on structural, thermal and optical properties of PVA. J Inorg Organomet Polym Mater. 2019;29(2):436–443.
- Abouhaswa AS, Taha TA. Tailoring the optical and dielectric properties of PVC/CuO nanocomposites. Polym Bull. 2020;77(11):6005–6016.
- Ghanipour M, Dorranian D. Effect of Ag-nanoparticles doped in polyvinyl alcohol on the structural and optical properties of PVA films. J Nanomater. 2013;2013:897043.
- Nangia R, NK Shukla, A Sharma, Optical and structural properties of Se80Te15Bi5/PVA nanocomposite films. J Mol Struct. 2019;1177, 323-330.
- Vijai Anand K. Improved structural, optical and photoluminescence properties of EDTA capped zinc sulfide nanoparticles for optoelectronic applications. J Cluster Sci. 2021;32(1):155–161.
- Rahman Khan MM, Pal S, Hoque MM, et al. Simple Fabrication of PVA-ZnS composite films with superior photocatalytic performance: enhanced luminescence property, morphology, and thermal stability. ACS Omega. 2019;4(4):6144–6153.
- Behera M, Ram S. Intense quenching of fluorescence intensity of poly(vinyl pyrrolidone) molecules in presence of gold nanoparticles. Appl Nanosci. 2013;3(6):543–548.
- Dey KK, Kumar P, Yadav RR, et al. Cuo nanoellipsoids for superior physicochemical response of biodegradable PVA. RSC Adv. 2014;4(20):10123–10132.
- Heiba ZK, Mohamed MB, Imam NG, et al. Optical and electrical properties of quantum composite of polyvinyl alcohol matrix with CdSe quantum dots. Colloid Polym. Sci. 2016;294(2):357–365.
- Viswanath R, Bhojya Naik HS, Yashavanth Kumar GS, et al. Luminescence properties of blue���red emitting multilayer coated single structure ZnS/MnS/ZnS nanocomposites. Spectrochim Acta, Part A. 2014;125:222–227.
- An C, Tang K, Liu X, et al. Hydrothermal preparation of α-MnS nanorods from elements. J Cryst Growth. 2003;252(4):575–580.
- Hosseini-Hajivar MM, Jamali-Sheini F, Yousefi R. Microwave-assisted solvothermal synthesis and physical properties of Zn-doped MnS nanoparticles. Solid State Sci. 2019;93:31–36.