?Mathematical formulae have been encoded as MathML and are displayed in this HTML version using MathJax in order to improve their display. Uncheck the box to turn MathJax off. This feature requires Javascript. Click on a formula to zoom.
Abstract
Objective: Modelling linear accelerator (linac) photon beams using the Monte Carlo (MC) technique is presently the most precise technique with which to calculate radiotherapy beam data. Complicated treatment plans can be achieved by using the Agility multileaf collimator. The focus of this study is to model a linac, integrated with an Agility head, using EGSnrc MC code and to investigate its accuracy compared with actual measurements. Methodology: A 10-MV photon beam from an Agility head installed in an Elekta Synergy linac was simulated using BEAMnrc MC code. Various incident electron energies were used to generate percentage depth dose curves for the MC model and were compared with measurements using gamma analysis (γ). Consequently, the focal spot with different full width half-maximums (FWHMs) was used to tune dose profiles. In addition, any differences in dose profiles were further minimized using different angular divergences. Results: The electron energy of 9.6 MeV was found to represent the best match with the measurements, where the γ pass rate was 100%. For dose profile comparisons, a circular focal spot with an FWHM of 0.45 cm and an angular divergence of 0.04 produced the best match with the measurements. Conclusion: The presented MC linac model integrated with an Agility head for a 10-MV photon beam can be reliably used for dose calculations.
Keywords:
1. Introduction
Monte Carlo simulations are considered to be the most accurate method of dose calculation. In MC simulation, even in a heterogeneous media, all the aspects of electron and photon transport are taken into account [Citation1,Citation2]. In addition, modelling linear accelerator (linac) photon beams using the MC technique is presently the most accurate method with which to calculate radiotherapy beam data.
In order to accurately model any linac, the components' compositions and the geometry dimension information must be known in great detail. Such information is typically provided by the manufacturer. Occasionally, some information may be updated or corrected in certain cases, as reported by Chibani and Ma [Citation3]. Dose calculation uncertainties can be increased due to errors in component materials and compositions and geometrical errors, as well as by energy selection. However, some information is not typically provided by the manufacturer, such as the incident electron energy on the target and the production of bremsstrahlung photons. In addition, this information includes the radial intensity distribution (FWHM, or focal spot size) as well as the angular divergence of the incident electron beam on the target. Trial-and-error procedures can, in general, predict these information. It has been demonstrated by previous studies that the incident electron energy affects the percentage depth dose (PDD) matching between MC modelling and real-world measurements, while spot size and the mean angular divergence affect dose profiles [Citation4–6].
Many studies have modelled different linac types with different photon energies using various MC codes [Citation6–12]. However, different linac manufacturers have introduced different and well-designed multileaf collimators to deliver a fast and accurate radiotherapy beam, thus achieving optimal dose distribution [Citation9,Citation13–15]. Such an MLC design allows for the delivery of spatially high dose conformity and uniformity to the target volume, while significantly limiting the dose ultimately delivered to the healthy surrounding tissues. This facilitates a complicated delivery such as volumetric-modulated arc therapy (VMAT) [Citation16]. On the other hand, this makes the accurate modelling of the MLC considerably more challenging and more important.
The manufacturer Elekta (Elekta, Crawley, West Sussex, UK) produced the Agility head with an MLC which has 160 leaves of 0.5 cm width at the isocentre. Previous papers have modelled the Agility head, as installed in different Elekta linacs, by using the EGSnrc MC code, ensuring the accuracy of the MC model by tuning the missing parameters (mentioned above) [Citation6,Citation9,Citation11,Citation17]. Gholampourkashi et al. modelled an Elekta Infinity linac with Agility head, and modified the percentage compositions of the leaf provided by the manufacturer to match the measurements [Citation6]. Onizuka et al. modelled an Elekta Synergy linac with an Agility head for a 6 MV photon beam, which represented the first attempt to model the Elekta Synergy with an integrated Agility head [Citation9]. Later, Ohira et al. modelled a similar linac with an Agility head for a 6 MV photon beam [Citation17].
The focus of this study is to model and validate the Elekta Synergy linac integrated with an Agility head for a 10 MV photon beam, which is demonstrated for the first time. Firstly, the best incident electron energy match is investigated by comparing the PDDs, and then comparing the dose profiles to find the fine-tuned spot size and angular divergence. Finally, the output factors comparison for different field sizes are made between the fine-tuned MC model and the measurements.
2. Method and materials
2.1. Linear accelerator
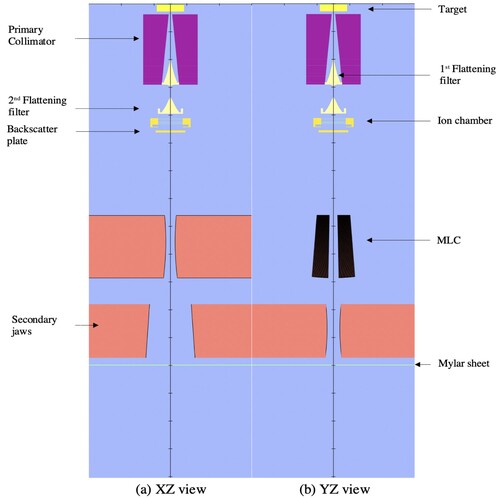
The Elekta Synergy linear accelerator at Singleton Hospital, Swansea, UK (ElektaTM, UK) was used in this study. The linac was constructed for a 10-MV photon beam. In addition, the linac is equipped with an Agility head which has an MLC consisting of 160 leaves (80 leaf pairs). The leaf thickness is 9 cm and the leaf tip is round and has a radius of 17.0 cm. The MLC is in the X-direction and there are no backup collimators, which is in contrast to the previous Elekta MLCi and MLCi2 heads [Citation16,Citation18]. The comparison of the Agility, MLCi, and MLCi2 heads has previously been investigated [Citation16,Citation18,Citation19]. The linac consists of the target, primary collimator, flattening filter, chamber, backscatter plate, MLC, Y-jaws, and Mylar sheet (see Figure in the Appendix). For a 10-MV photon beam, the primary collimator is rotated from an open port to a filtered port, thus serving as a primary collimator and an additional flattening filter. Such a geometry makes the accurate modelling of the linac considerably more challenging. The composition of the MLC was modified as suggested by Gholampourkashi et al. to match the measurements [Citation6]. The MLCE and MLCQ MC component modules were used to model the MLC and Y-jaws, respectively. The measurements were performed on a water tank using a PTW Semiflex 3D ion chamber of 0.07 cm active volume. To measure PDDs, the chamber was positioned horizontally (chamber axis parallel to the water surface) and vertically (chamber axis perpendicular to water surface) for dose profile measurements.
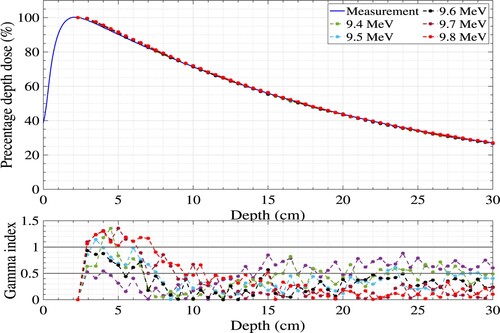
Figure 1. The measured and simulated PDD curves of the 10 MV photon beam using different electron energies (MeV) with the γ test using the 1%/1 mm criteria.
2.2. Monte Carlo simulation
The BEAMnrc MC (version 2020) code was used to model the 10 MV photon beam from the linac [Citation20]. Source number 19, in BEAMnrc user code, was used. The default values for the majority of the simulation parameters were accepted. To reduce the simulation time, different variance reduction techniques (VRTs) were used. These included range rejection, bremsstrahlung cross-section enhancement (BCSE), and directional bremsstrahlung splitting (DBS).
The DOSXYZnrc code was used to model the water tank phantom [Citation21]. The dimensions of the MC water phantom were 20.25 × 20.25 × 35 cm. In general, the voxel dimension was 0.5 cm in all directions for dose profiles. For the PDDs, the voxel size in the Z-direction was varied in the build-up region, and was 1 cm initially, which was subsequently changed to 0.6 cm centred at 2.3 cm depth, which is the depth of the maximum dose. After the build-up region, the voxel size in the Z-direction was 0.5 cm. For DOSXYZnrc simulation parameters, similar values to those mentioned by Almatani [Citation22] were used to maximize the efficiency.
2.3. Validation of the linac model
2.3.1. PDD comparison
Based on previous studies, as mentioned earlier, the PDD curves are highly sensitive to changes in the incident electron energy. Thus, the PDD comparison between the measurements and the MC model was performed using various monoenergetic electron energies (from 9 to 10 MeV). The comparison was made for a 10 × 10 cm field size with a 90 cm source-to-surface distance (SSD). The dose distributions were normalized to the dose at a 2.3 cm depth, which is the maximum dose. A gamma index (γ) analysis was used to evaluate the MC dose distributions by using the measured PDD as the reference distribution [Citation23]. The acceptance criteria for a dose difference and a distance-to-agreement of 2%/2 mm, respectively, as proposed by the AAPM [Citation24]. In addition, a more accurate set of criteria of 1%/1 mm was used.
To observe any effect on the MC PDD curves due to changing the energy of the incident electron, the focal spot was set to 0 cm in the X- and Y- directions thus collapsing the source to a pencil beam [Citation20]. In this step, the beam was parallel to the Z-axis with a mean angular divergence of 0.
2.3.2. Dose profile comparison
After finding the best electron energy match, the next step was the determination of the FWHM (Gaussian distribution in the Z-direction, also called spot size) of the incident electron beam. In this step, the comparison of the dose profiles between the fine-tuned energy with different FWHM values and the measurements was made. Such comparison was made due to the fact that, as mentioned in Section 1, the lateral dose profiles are highly sensitive to changes in FWHM. However, the range of FWHM considered was from 0.1 cm to 0.7 cm. The comparison was made for a 10 × 10 cm field size and the SSD was 90 cm. In addition, the γ analysis was made with two different criteria.
Consequently, the dose profiles using different mean angular divergences were used with the optimal FWHM, and which were compared to the measurements. Such a comparison was performed to minimize any differences in the cross-field profiles of the MC model compared with the measurements. The range of the mean angular divergence was from 0.01 to 0.3
in increments of 0.01
. The dose profiles of the fine-tuned MC model with the same SSD for a 10 × 10 cm
field size at different depths were compared with the measurements.
2.3.3. Output factor comparison
Finally, the output factors (OF) for different field sizes of the fine-tuned MC model were calculated and compared with the measurements. These included field sizes of 2 × 2, 3 × 3, 5 × 5, 15 × 15, 20 × 20, 30 × 30, and 40 × 40 cm with a constant SSD of 90 cm. The OF was defined, in this study, as the ratio of the dose at a 10 cm depth in the phantom of a given field size to that for a reference field size, in this case, 10 × 10 cm
. The SSD of 90 cm was kept constant for all field sizes.
3. Results and discussion
A MacOS with a 2.9-GHz Quad-Core Intel Core i7 with hyperthreading was used to perform all the simulations. The amount of RAM available was 16 GB. Each simulation was split into eight parallel jobs. This would speed up the simulation about 1 to 1.2 times when distributed over the four cores. The number of histories used was about 50 million to achieve a statistical uncertainty of ≤1.7% in the out-field dose region and ≤1% in the in-field dose region.
3.1. Determination of electron energy
The PDD curves of the measurement and MC simulations were compared as shown in Figure , to predict the initial electron energy that produces the bremsstrahlung radiation. The first two points, before the build-up region (< 2.3 cm), were excluded from the γ test. All energies passed the γ test for the 2%/2 mm criteria set, showing a γ index of less than 1. On the other hand, all the calculation points of only 9.6 MeV electron energy passed the γ test when using the 1%/1 mm set, as shown in Table . In addition, 85.7% of the calculation points for the 9.6 MeV electron energy were found to have γ values of less than 0.5 for the 1%/1 mm set. In terms of deviations, the largest difference was found to be −1.4% at a depth of 29 cm.
Table 1. PDD comparison using a gamma index (GI) with two criteria sets, 2%/2 mm and 1%/1 mm, for various monoenergetic energies (MeV).
Yani et al. simulated an Agility head (in an Elekta Infinity linac) using the BEAMnrc MC code [Citation11]. For a 10-MV photon beam, the best agreement with the measurements was obtained when an electron energy of 9.4 MeV was used. More recently, Almatani modelled the same energy and similar Elekta Synergy linac but with a MLCi2 head, finding that the best fit was achieved when the electron energy was set to 9.8 MeV [Citation12]. These findings differ from the results presented in this study, which may be due to differences in either the linac or the head used.
3.2. Determination of FWHM and angular divergence values
The dose profiles comparison of a 10 × 10 cm field size was performed to match the MC simulation with the measurements, thus predicting the FWHM values. Consequently, the 9.6 MeV electron energy, as previously predicted, was used to generate dose profiles with different FWHMs and parallel to the Z-axis, as shown in Figure . The dose profiles were generated at the depth of the maximum dose, i.e. 2.3 cm, and normalized to the central point dose. The difference in dose profiles decreased as the FWHMs increased from 0.35 to 0.4 cm, especially for the horns at the edge of the field. This can be observed from the γ analysis shown in Table . A circular focal spot with a FWHM 0.45 cm produced a flat profile resulting in a 97.7% and 80% of the calculation points passed the γ test when using the 2%/2 mm and 1%/1 mm criteria sets, respectively, and the largest difference was found to be −7.1 (at the high dose gradient). Beyond this FWHM, the differences in the lateral dose profiles increased, resulting in the lowest number points that passed the γ test, i.e. 84% with the 2%/2 mm set for a circular focal spot with a FWHM of 0.6 cm.
Figure 2. The measured and simulated dose profiles of the 9.6 MeV beam for a 10 × 10 cm field size at a depth of 2.3 cm using a circular focal spot with various FWHM values.
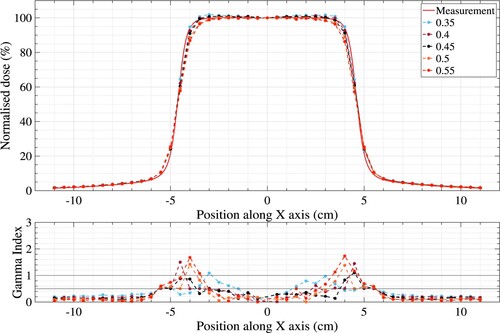
Table 2. Dose profile comparison using gamma index (GI) with two criteria sets, the 2%/2 mm and 1%/1 mm, using a circular focal spot with various FWHMs (cm).
Onizuka et al. simulated an Agility head installed in an Elekta Synergy linac [Citation9]. For a 6-MV photon beam, the best agreement between the MC model and measurements was found when 6.2 MeV was used as the incident electron energy with an elliptical spot size of 0.2 cm and 0.1 cm in the X- and Y -directions, respectively. More recently, Ohira et al. modelled similar linac with an Agility head for a 6 MV photon beam and found that a circular focal spot with an FWHM of 0.15 cm resulted in the best agreement between the MC model and the measurements [Citation17]. This is in agreement with the current finding in terms of the shape of the focal spot; however, the differences apparent in the FWHM values between these studies and the current study may be due to the operating beam energy.
Consequently, the fine-tuned electron energy, 9.6 MeV, and FWHM, 0.45 cm in both directions, was used to generate dose profiles using different mean angular divergences ranging from 0.01 to 0.3
in increments of 0.01
, as shown in Figure . Such a comparison was made to further minimize the cross-field dose differences for the 10 × 10 cm
field size. From 0.01
to 0.04
, the differences in dose profiles were minimized and decreased slightly with some fluctuations. Above 0.04
, the differences increased slightly, reaching 75.5% with the 1%/1 mm set when the mean angular divergence was set to 0.3
; accordingly, the results from 0.11
to 0.29
are not presented for the sake of brevity. As a result, the mean angular divergence of 0.04
from the Z-axis represented the best fit with the measurement, where the γ pass rate was 100% when using the 2%/2 mm set criteria, as shown in Table . The largest difference was found to be −6.9% (at the high dose gradient). As a result, the dose profiles at different depths for a 10 × 10 cm
field size of the MC model, with a circular focal spot with FWHM of 0.45 cm, and an angular divergence of 0.04
, were generated and compared with the measurements with γ index using the 2%/2 mm set criteria, as shown in Figure .
Figure 3. The measured and simulated dose profiles for a 9.6 MeV energy with an FWHM of 0.45 cm, in both directions, for a 10 × 10 cm field size using different mean angular divergences.
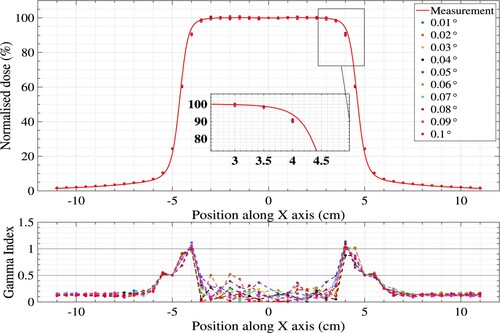
Figure 4. The measured and simulated dose profiles of the 9.6 MeV with an FWHM of 0.45, in both directions, and mean angular divergence of 0.04 for a 10 × 10 cm
field size at different depths.
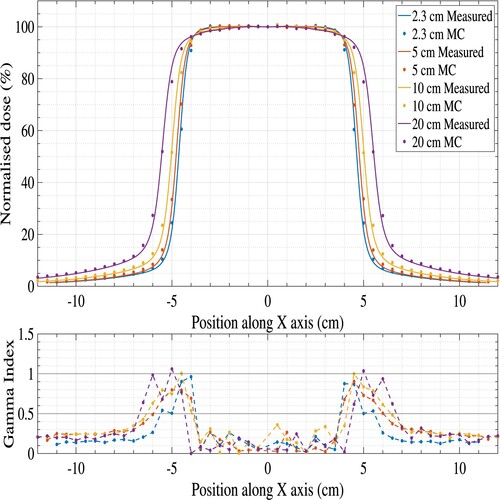
Table 3. Dose profile comparison using gamma index (GI) with two criteria sets, 2%/2 mm and 1%/1 mm, using a circular focal spot with an FWHM of 0.45 cm with different mean angular divergences.
Gholampourkashi et al. simulated an Agility head in an Elekta Infinity linac. For a 6-MV photon beam, it was shown that the best fit could be found when the beam was divergent from the Z-axis by 1.35 [Citation6]. Recently, Almatani found that a mean angular spread of 0.05
represented the best fit between the MC model and the measurements [Citation12]. This is similar to the current findings, and the differences may be due to the differences in the head geometry used in each study (MLCi2 vs. Agility).
3.3. Output factors comparison
Finally, the fine-tuned MC model, where the electron energy was 9.6 MeV and a circular focal spot with an FWHM of 0.45 cm and a mean angular divergence of 0.04, was used to calculate the OFs for different field sizes and compared with the measurements. Table shows the differences in OF, which is defined in Section 2.3.3, of the measurement and MC for different field sizes. The smallest difference was about 0.28% for the 20 × 20 cm
field size while the largest difference was −1.5% for the 2 × 2 cm
field size. Therefore, the MC model resulted in a good agreement with the measurements.
Table 4. Output factor differences between the measurements and fine-tuned MC model for different field sizes.
Yani et al. (2020) simulated the Elekta Infinity linac (with Agility head) and investigated the difference in the OFs between the MC and the measurements for different field sizes using a PTW Semiflex 3D ion chamber [Citation11]. For a 10-MV photon beam, the largest difference, 5.29%, was found when using a 2 × 2 cm field size. This difference may be due to the fact that charged particle equilibrium (CPE) is not achieved with such a combination of high energy and small field size due to the large range of the secondary charged particles produced. However, this difference is larger than the difference in the presented study for the same field size.
4. Conclusion
The MC model of Agility head installed in the Elekta Synergy linear accelerator presented in this study can be used for dose calculations. For a 10-MV photon beam, the electron energy of 9.6 MeV with a circular focal spot width FWHM of 0.45 cm and mean angular divergence of 0.04 from the Z-axis passed the γ test using the 2%/2 mm criteria set, where the γ pass rate was 100%. In terms of output factor comparison, the model achieved an accuracy of between 0.28% and −1.5%. Therefore, as a result, radiotherapy treatment plans (field size
) that can be generated by the Agility MLC can be reliably simulated using the BEAMnrc MC code.
Disclosure statement
No potential conflict of interest was reported by the author(s).
References
- Andreo P. Monte Carlo techniques in medical radiation physics. Phys Med Biol. 1991;36(7):861–920. https://doi.org/10.1088/0031-9155/36/7/001.
- Seco J, Verhaegen F. Monte Carlo techniques in radiation therapy. Boca Raton: CRC Press; 2013.
- Chibani O, Ma C-MC. On the discrepancies between Monte Carlo dose calculations and measurements for the 18MV varian photon beam. Med Phys. 2007;34(4):1206–1216. https://doi.org/10.1118/1.2712414.
- Sheikh-Bagheri D, Rogers DWO. Monte Carlo calculation of nine megavoltage photon beam spectra using the BEAM code. Med Phys. 2002;29(3):391–402. https://doi.org/10.1118/1.1445413.
- Almberg SS, Frengen J, Kylling A, et al. Monte Carlo linear accelerator simulation of megavoltage photon beams: independent determination of initial beam parameters. Med Phys. 2011;39(1):40–47. https://doi.org/10.1118/1.3668315.
- Gholampourkashi S, Cygler JE, Belec J, et al. Monte Carlo and analytic modeling of an Elekta infinity linac with agility MLC: investigating the significance of accurate model parameters for small radiation fields. J Appl Clinical Med Phys. 2018;20(1):55–67https://doi.org/10.1002/acm2.12485.
- Lewis RD, Ryde SJS, Hancock DA, et al. An MCNP-based model of a linear accelerator x-ray beam. Phys Med Biol. 1999;44(5):1219–1230. https://doi.org/10.1088/0031-9155/44/5/010.
- Efendi M, Chittrakarn T, Bhongsuwan T. Monte Carlo simulation of 6 MV flattening filter free photon beam of true beam STx LINAC at songklanagarind hospital. Sains Malaysiana. 2017;46(9):1407–1411. https://doi.org/10.17576/jsm-2017-4609-08.
- Onizuka R, Araki F, Ohno T. Monte Carlo dose verification of VMAT treatment plans using Elekta agility 160-leaf MLC. Phys Med. 2018;51:22–31. https://doi.org/10.1016/j.ejmp.2018.06.003.
- Brualla L, Rodriguez M, Sempau J, et al. PENELOPE/PRIMO-calculated photon and electron spectra from clinical accelerators. Radiat Oncol. 2019;14(1):6. https://doi.org/10.1186/s13014-018-1186-8.
- Yani S, Budiansah I, Rhani MF, et al. Monte Carlo model and output factors of elekta infinityTM 6 and 10 MV photon beam. Rep Practical Oncol Radiother. 2020;25(4):470–478. https://doi.org/10.1016/j.rpor.2020.03.021.
- Almatani T. Validation of a 10 MV photon beam Elekta Synergy linear accelerator using the BEAMnrc MC code. J King Saud University – Sci. 2021;33(4):101406. https://doi.org/10.1016/j.jksus.2021.101406.
- Tacke MB, Nill S, Häring P, et al. 6 MV dosimetric characterization of the 160 MLCTM, the new siemens multileaf collimator. Med Phys. 2008;35(5):1634–1642. https://doi.org/10.1118/1.2889782.
- Borges C, Zarza-Moreno M, Heath E, et al. Monte Carlo modeling and simulations of the high definition (HD120) micro MLC and validation against measurements for a 6 MV beam. Med Phys. 2011;39(1):415–423. https://doi.org/10.1118/1.3671935.
- Kielar KN, Mok E, Hsu A, et al. Verification of dosimetric accuracy on the truebeam STx: rounded leaf effect of the high definition MLC. Med Phys. 2012;39(10):6360–6371. https://doi.org/10.1118/1.4752444.
- Bedford JL, Thomas MDR, Smyth G. Beam modeling and VMAT performance with the agility 160-leaf multileaf collimator. J Appl Clinical Med Phys. 2013;14(2):172–185. https://doi.org/10.1120/jacmp.v14i2.4136.
- Ohira S, Takegawa H, Miyazaki M, et al. Monte Carlo modeling of the agility MLC for IMRT and VMAT calculations. In Vivo (Brooklyn). 2020;34(5):2371–2380. https://doi.org/10.21873/invivo.12050.
- Kantz S, Söhn M, Troeller A, et al. Impact of MLC properties and IMRT technique in meningioma and head-and-neck treatments. Radiat Oncol. 2015;10(1):184. https://doi.org/10.1186/s13014-015-0447-z.
- Rønde HS, Mortensen B. EP-1498: beam matching of linacs with elekta agility and MLCi2 heads – energy, profiles, and output factors. Radiother Oncol. 2014;111:S160. https://doi.org/10.1016/s0167-8140(15)31616-9.
- Rogers DWO, Walters B, Kawrakow I. BEAMnrc users manual. NRC Rep. PIRS 509. 2009.
- Walters B, Kawrakow I, Rogers D. DOSXYZnrc users manual. NRC Rep. PIRS. 794. 2005.
- Almatani T. Optimisation of variance reduction techniques in EGSnrc Monte Carlo for a 6 MV photon beam of an Elekta synergy linear accelerator. J King Saud University – Sci. 2021;33(4):101421. https://doi.org/10.1016/j.jksus.2021.101421.
- Low DA, Harms WB, Mutic S, et al. A technique for the quantitative evaluation of dose distributions. Med Phys. 1998;25(5):656–661. https://doi.org/10.1118/1.598248.
- Chetty IJ, Curran B, Cygler JE, et al. Report of the AAPM task group no. 105: issues associated with clinical implementation of Monte Carlo-based photon and electron external beam treatment planning. Med Phys. 2007;34(12):4818–4853. https://doi.org/10.1118/1.2795842.
Appendix
Figure A1. Components of the MC model of the linac head from two different viewpoints.