
 ?Mathematical formulae have been encoded as MathML and are displayed in this HTML version using MathJax in order to improve their display. Uncheck the box to turn MathJax off. This feature requires Javascript. Click on a formula to zoom.
Abstract
Due to the significant share of the induction motors (IMs) in global electricity consumption, the study of the IM in different power supply regimes is the aim of this work. In practice, these electrical receivers are not supplied from ideal voltage systems, therefore the power quality (PQ) is an important aspect in analysing the operation of this type of motors. We proposed a methodology for analysing the effects of unbalanced distorted voltages not only on the technical parameters of the IM but also on the power supply as well as on the driven mechanical system. We identified some dependencies, in analytical forms, between the sizes of interest and the considered PQ disturbances. The results showed that the supply voltage disturbances have significant effects on the induction motor, both electrically and mechanically. These effects are amplified if the IM is running at loads below 50% of the rated load.
1. Introduction
Power Quality (PQ) is an important aspect regarding the electromechanical receivers due to the significant share of these receivers in general electricity consumption. Electric motors and the systems they drive are the largest electrical end-use. It is estimated that the electric motor-driven systems (EMDS) account for more than half of the electricity consumed worldwide [Citation1].
Induction motors (IMs) account for around 70% of the energy consumption of industry worldwide; thus, improving their efficiency will reduce the global consumption of electricity. There is a huge potential for energy efficiency in EMDS – around 30% of EMDS electricity use could be saved cost-effectively – which would reduce total global electricity demand by about 10% [Citation2].
The mechanical speed of the IM is directly coupled to the frequency of the supply voltage, which limits its flexibility when supplied directly from the grid. Only about 25% of the installed IMs are supplied from power converters [Citation3]. For IMs supplied directly from the grid, it is important to establish the tolerability limits for the different PQ disturbances, and to identify those disturbances leading to power losses, both in the machine itself and in the power grid.
The voltage unbalance represents a condition in which the three-phase voltages (or currents) differ in amplitude or displaced from their normal 120˚ phase relationship or both [Citation4]. This is a common situation in three-phase systems, and the operation of an IM is affected by the positive and negative sequence components. The negative sequence currents create a flux rotating in the direction opposite to the rotor. This flux causes increased heating, additional losses, and additional torque operating in the opposite direction to the torque produced by the positive sequence flux [Citation4].
Harmonics is another common phenomenon in power systems. A harmonic is defined as a component with a frequency that is an integer multiple of the fundamental frequency [Citation4]. Rotating machines are exposed to thermal effects from harmonics. Additional torque ripples are induced by the interaction between the fundamental component of the air gap flux and the harmonics currents, of the positive and negative sequences [Citation5].
There are many studies about reducing losses and increasing the efficiency of the IM. For instance, the increasing of the IM efficiency can be achieved at every design parameter of the machine, and the PQ of the power supply should also be considered. The impact of voltage unbalance on the performance of the IMs and the systems they drive was studied [Citation6–11].
The effect of two voltage unbalance conditions on the losses in the core of the IM was analysed [Citation12]. The results showed that the positive sequence voltage level has more influence on the core losses of the IM than the voltage unbalance. Whereas the effects of the positive, negative, and zero components on the torque and efficiency of the three-phase IM were evaluated [Citation13]. Moreover, the effects on the operation performance of an IM for different unbalanced situations, considering both the negative and positive sequences are analysed [Citation14–16].
There was a procedure presented [Citation17] that was based on the equivalent circuits with losses segregation and using a bacterial foraging algorithm (BFA). The additional harmonic losses of the IM with the machine initial efficiency rating are evaluated in [Citation18,Citation19]. It was found that the increase in losses is higher in the SCIM IE3 than in the SCIM IE1. The derating factors for IM when supplied with harmonics are studied in Ref. [Citation20]. They stated that for lower loading of the IM, the derating factors, like the NEMA MG1 or the IEC 60034-17, can underestimate the losses.
Prior research cover algorithms for efficiency estimation of IMs operating with unbalanced and distorted voltages [Citation21,Citation22]. In addition, the effects of harmonics and voltage unbalance on the useful life of electrical motors are presented using a simplified equivalent circuit to calculate the additional heat losses caused by power supply distortions [Citation23]. The electromagnetic loss properties of the induction motor under unbalanced and distorted supply voltage were studied also [Citation24].
Another study presented a comparison of the life expectancy of IE2, IE3, and IE4 Class motors under the distorted unbalanced power supply [Citation25]. They stated that the high-efficiency motors offer an increased level of reliability and reduced maintenance requirements. The effects of voltage unbalance and harmonics on the losses of the IMs in different efficiency classes were studied [Citation26]. It was concluded that the losses of the IM due to voltage unbalance and harmonics are greater in the higher efficiency class of IMs.
However, many of the above-mentioned studies that are based on practical experiments usually have the percent voltage unbalance or harmonic content introduced by a programmable power supply. Even if the practical setups for simulating the mentioned disturbances are chosen to reproduce common situations encountered in industry, it is not enough to achieve a systematic simulation of the PQ disturbances, considered.
In our previous work [Citation27], we analysed the harmonic consequences on the IM. The harmonic distortion of stator current, the electromagnetic torque, the power factor (PF), and the efficiency of IM, operating in harmonics were followed.
In this work, we propose a systematic analysis of the effects of voltage unbalance and harmonics on the IM. For analysing the IM operating under unbalanced distorted voltages, we consider the following hypothesis:
The reference case, when the stator of the IM is supplied from balanced sinusoidal voltages, at grid frequency; the motor operates static at determined constant torque and speed.
The case when the IM is supplied from unbalanced sinusoidal voltages.
The case when the IM is supplied from balanced non-sinusoidal voltages.
The case when the IM is supplied from unbalanced non-sinusoidal voltages, at different load percentage.
Section 2 presents the methodological aspects, and Section 3 is devoted for analysing the simulation results of the IM operating under different unbalanced conditions. Section 4 presents the consequences of the harmonics on the IM behaviour. The results obtained for the case when the IM is supplied from unbalanced distorted voltages are presented and discussed in Section 5. Finally, the conclusions and future research are presented in Section 6.
2. Methodological aspects
2.1. Modelling of the IM
We used the MATLAB/Simulink programming environment to simulate the IM under voltage unbalance and harmonics. We chose a medium-size squirrel-cage IM with a nominal power of Pn = 4 kW. Stator and rotor windings are star connected to an internal neutral point. The parameters of the IM are presented in Table .
Table 1. Parameters of the IM.
The physical model is linear, regarding the inductivities, which are considered constant, so the phenomenon of saturation of the magnetic circuit is not considered here. The effective power factor (PF) for a three-phase non-sinusoidal and unbalanced system was calculated from the relation
(1)
(1) where P is the total three-phase active power, including each frequency component, in W; Se is the effective apparent power in the three-phase system, in VA; Ve is the equivalent three-phase voltage, in V; Ie is the equivalent three-phase current, in A. The expressions for effective three-phase voltage and current shall be calculated from
(2)
(2)
(3)
(3) where the voltages and currents represent the total rms phase values, including the fundamental and the harmonic content.
For the efficiency of the IM, we used the direct method, calculated as
(4)
(4) where Pout represents the output power, in W; Pin is the active input power, in W; PM is the total power developed by the motor, in W; and pm is the mechanical losses, in W.
We compute the output power with the equation
(5)
(5) where Te is the electromagnetic torque, in N·m; and ωm is the angular velocity of the rotor, in rad/s. The mechanical loss is determined from
(6)
(6) with F represents the friction factor, in N·m·s.
2.2. Voltage unbalance
The rigorous appreciation of the unbalance regime can be made only with the symmetrical components, determined on the Stokvis-Fortescue Theorem. The voltage unbalance factor (VUF) was calculated with the following relationship [Citation28]
(7)
(7) where Vneg is the negative sequence voltage component and Vpos is the positive sequence voltage component.
We analysed the effects of the unbalance regime on the IM for VUF ∈ {1, 2, 3, 4, 5}%. Given that for the same value of VUF there are possible several situations, we considered three different conditions for each value of the VUF (1) different amplitudes and equal phase shifts; (2) equal amplitudes and different phase shifts; and (3) different amplitudes and different phase shifts. Because the magnitude of the positive sequence influences the IM behaviour differently for the same VUF, the above-mentioned unbalance conditions were chosen with the relation between the positive sequence component and the nominal phase voltage Vphn, as follows:
different amplitudes and equal phase shifts, with Vpos<Vphn;
equal amplitudes and different phase shifts, with Vpos = Vphn;
different amplitudes and different phase shifts, with Vpos>Vphn.
The considered unbalanced scenarios, for simulating the IM under voltage unbalance, are presented in Table . In the table are shown the modules and displacement angles of the three phase-to-neutral voltages.
Table 2. VUF and the three-phase supply voltages for different types of voltage unbalance.
2.3. Harmonics
Harmonic distortion of a non-sinusoidal waveform can be determined by calculating the total harmonic distortion (THD), which represents the ration between the rms of the harmonic content and the rms value of the fundamental, expressed as a percent of fundamental, with the relation [Citation28]
(8)
(8) where Yh is the rms of the harmonic component of h order of quantity Y, which can be a voltage or current waveform. For analysing the IM behaviour under harmonics, in the supply voltages we superimposed harmonics of order h ∈ {5, 7, 11, 13}, over the fundamental. The harmonics of the 5th and 11th orders are of negative sequence, and the 7th and 13th orders are of positive sequence. Firstly, we injected each considered harmonic one by one, and then combinations of them, with THDV ∈ {5, 10, 15, 20}%, as presented in Table . The total rms value of voltage, including the fundamental and the harmonics, was maintained at nominal value.
Table 3. Harmonic content in the supply voltage.
2.4. Unbalanced and non-sinusoidal voltages
We chose to simulate the IM behaviour up to these limits of VUF = 5% and THDV = 20%, even if they exceed the admissible values from standards, because these limit values may occur in practice [Citation29]. For studying the IM supplied from unbalanced distorted voltages we considered the following combinations of the VUF and THD, as presented in Table . For the unbalanced type, we used the case with different amplitudes and symmetrical angles with Vpos < Vphn. In the case of harmonic content, we considered that in the voltage waveforms are present both harmonics of orders 5 and 7, having the levels (percentage of fundamental) shown in Table .
Table 4. VUF and THDV of the selected scenarios.
3. Effects of voltage unbalance on the IM
In this section, we analyse the effects on the IM supplied from unbalanced voltages, running at 75% of rated load. The total harmonic distortion of the stator current (THDI), the electromagnetic torque, the PF, and the efficiency of the IM are followed. For the three unbalanced situations, presented in Table , the results are further presented.
3.1. Harmonic distortion of the stator current
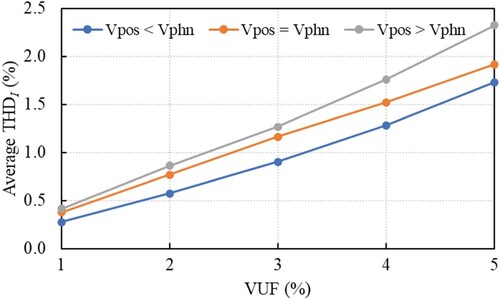
The first analysed quantity is the harmonic distortion of the stator current. Due to voltage unbalance, the values of the stator currents of the three phases are different, so we compute the average value of the total harmonic distortion (THDIav) of the three phases. Figure shows the dependency of the average value of THDI for the three phases of the stator current with VUF, for the considered unbalanced situations. Due to the voltage system unbalance in the stator current is found in the harmonic of the third order. It can be observed from Figure that the THDIav increases almost linearly with increasing VUF. Another observation is that for the same degree of unbalance, the values of THDIav differ with the magnitude of the positive sequence voltage. For example, when VUF = 3%: THDIav = 0.9%, for Vpos < Vphn; THDIav = 1.16%, for Vpos = Vphn; and THDIav = 1.27% for Vpos > Vphn.
Figure 1. The average THDI of the stator current with VUF.
3.2. Electromagnetic torque of the IM
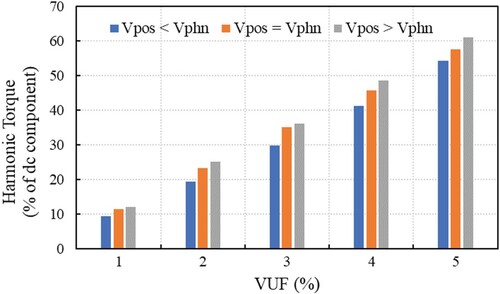
Voltage unbalance generates oscillations of electromagnetic torque at a frequency of two times higher than the nominal frequency. This torque component of the frequency of 100 Hz is due to currents of the negative sequence [Citation30]. Figure shows the amplitude (maximum absolute value of the difference from the dc component) of the torque oscillations, expressed as a percentage of the dc component of torque, with VUF. It can be observed that the torque oscillations increase linearly with increasing VUF. For VUF = 5%, the frequency component of 100 Hz of the electromagnetic torque can reach: 54.4% of nominal torque for Vpos < Vphn; 57.6% for Vpos = Vphn; and 61.2% for Vpos > Vphn. To be noted that for the same value of VUF, the amplitude of the torque oscillations differs for two different unbalanced situations, Vpos < Vphn and Vpos > Vphn, respectively, with values in the range of 11.02% to 22.75%. For example, for VUF = 2%, the amplitude of torque oscillations represents 19.32% of dc component, when Vpos < Vphn, and 25.01%, for Vpos > Vphn, which means a difference of 22.75% between the two values of the amplitude of torque oscillations.
Figure 2. The amplitude of torque oscillations due to voltage unbalance.
3.3. Power factor of the IM
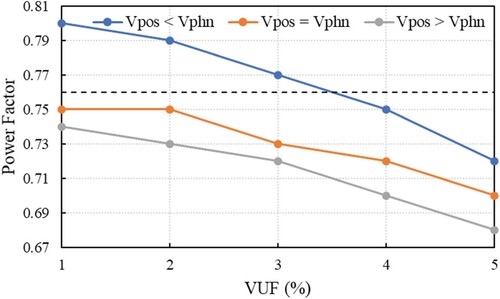
Furthermore, we analyse the influence of the voltage unbalance on the PF of the IM. The PF variation with VUF is represented in Figure . In cat be observed that the PF decreases with increasing the VUF. To be noted that for the case when the Vpos < Vphn, the values of PF are higher than the nominal value PFn = 0.76, for VUF ∈ {1, 2, 3}%; the values of PF are 0.75 and 0.72 for VUF of 4% and 5%, respectively. For the other two unbalance situations, the PF is lower than the nominal value (represented with the horizontal dashed line, in Figure ). The differences obtained for the PF, in the considered types of unbalance, can be observed in Figure .
Figure 3. PF of the IM due to voltage unbalance.
3.4. Efficiency of the IM
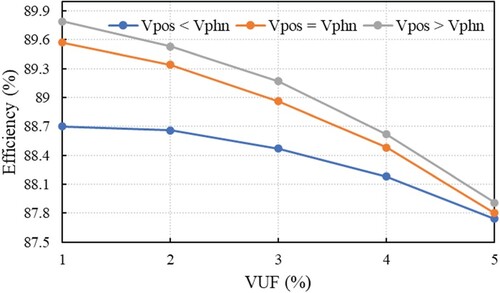
The efficiency of the IM running at 75% of rated load decreases with the increasing of VUF, as can be observed in Figure . The variation curves have a similar decreasing slope for the cases when Vpos ≥ Vphn, but with lower values for Vpos = Vphn. In the case of Vpos < Vphn the variation range of efficiency with VUF is narrower, but with values lower than the other two situations. The efficiency variation for the same unbalance factor, decreases with increasing of VUF and tending towards close values of efficiency for VUF = 5%. The efficiency values for VUF = 1%, for the cases, when Vpos < Vphn and Vpos > Vphn, respectively, differ with 1.21%. To be noted that for VUF = 5%, when Vpos < Vphn, the efficiency is 87.74%, which means a decrease of Δη% = 2.13% from the reference value ηn = 89.65%. Another observation is that in the case of Vpos > Vphn for VUF = 1%, the efficiency is 89.79%, which is higher by 0.15% than the nominal value.
Figure 4. The efficiency of the IM due to voltage unbalance.
4. Effects of harmonics on the IM
4.1. Harmonic distortion of the stator current
The THDI of the stator current depending on the voltage harmonic content and the THDV is presented in Figure . The first remark is that in the stator current waveform are found harmonics of the same orders as those introduced in the supplying voltage. As can be observed in Figure , the values of THDI depend on the order and level of the harmonics, but not on its sequence type, positive or negative.
Figure 5. THDI of the stator current with harmonic content and THDV.
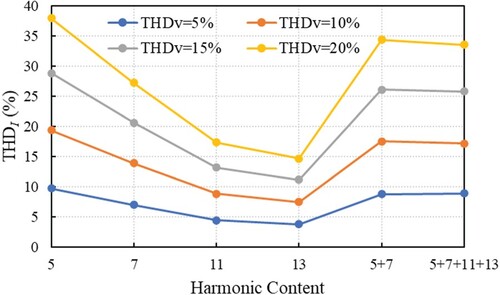
The constant of the ratio between the level of an individual current harmonic (percentage of fundamental) Ih% and the level of an individual voltage harmonic Vh% is observed, for a given constant order h, of the harmonic present in voltage waveform. The values of this ratio are given in Table .
Table 5. The values of the ratio Ih% / Vh% related to the harmonic voltage order.
We propose a relation for permitting the calculation of the level of an individual harmonic of the stator current, of order h, when is known the level of the individual voltage harmonic, of the same order h, from the supply voltage
(9)
(9) based on the graphs in Figure , which cross the line corresponding to the ordinates with the values Vh%, adopted for a fictive order h ≈ 10. Equation (9) highlights that the current harmonics with order h < 10 have higher levels in the current waveform than the voltage harmonic of the same order; instead for orders h > 10, the level of current harmonics decreases (10/h) times, with that of corresponding voltage harmonic.
The levels of stator current harmonics for each voltage harmonic, present in the stator voltage waveform, can be calculated with Equation (9) and the THDI can be determined from
(10)
(10)
4.2. Electromagnetic torque of the IM
The electromagnetic torque of the IM is the next analysed quantity. The torque interacts with the mechanical system of the driven machine. Figure shows the amplitude (maximum absolute value of the difference from the dc component) of the electromagnetic torque oscillation Teh%, expressed in percentage of the nominal torque Ten, with the harmonic content and THDV. As it can be observed the electromagnetic torque oscillations decrease inversely proportional to the voltage harmonic order and increase directly proportional to their level, according to the proposed relation
(11)
(11) The electromagnetic torque is plotted together with the harmonic spectrum of both the stator current and the supply voltage, in Figure . To be noted, the occurrence of electromagnetic torques at the intermediate frequencies of harmonic pairs 5 ± 7 and 11 ± 13.
Figure 6. The amplitude of the torque oscillations with harmonic content and THDV.
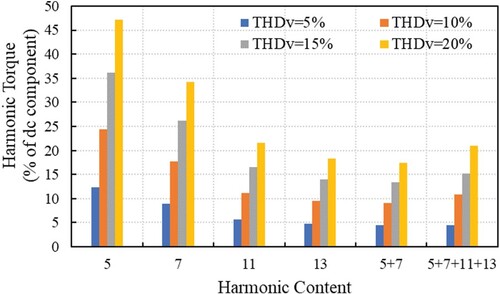
Figure 7. Harmonic spectrum for the amplitudes of the electromagnetic torque, voltage, and stator current.
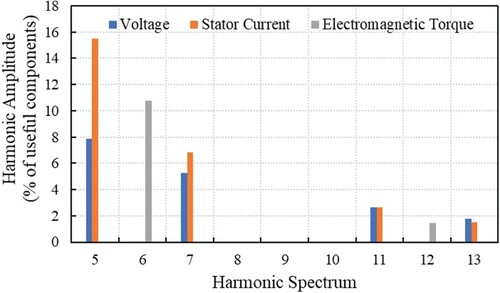
The elevated torques at these frequencies can be regarded as mechanical resonant spectral components when coinciding with the assumed natural frequencies of the system [Citation5]. This situation may lead to a severe increase in vibration amplitudes.
4.3. Power factor of the IM
From the electric power supply point of view, the PF of the IM represents a priority, because of the significant share of these electrical receivers in the global electricity consumption. Figure shows the PF versus the harmonic content and the THDV.
Figure 8. PF of the IM versus harmonic content and THDV.
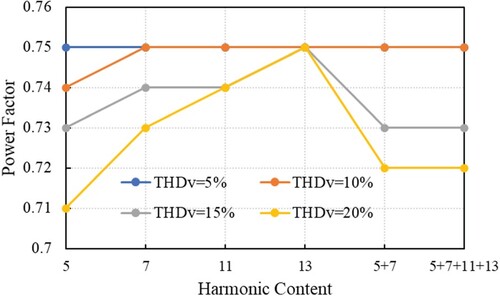
As a first remark, PF is maintained constant, at PF = 0.75, for THDV ∈ {5, 10}%, regardless of the order or harmonic content, except the case of the fifth order harmonic, when the PF = 0.74; if THDV ≥ 15%, there are relatively significant decreases of PF, especially when in the voltage waveform exist individual harmonics of lower orders hÎ{5, 7}, or when there exist combinations of harmonics with the orders and levels mentioned in Table . For individual harmonics of higher orders hÎ{11, 13}, the PF is less affected.
4.4. Efficiency of the IM
In terms of energy, the efficiency is also essential along with the PF, so that its variations with harmonic content and THDV are plotted in Figure . As in the case of the PF, the lower values of THDV Î{5, 10}% are felt to be imperceptible or to a very small extent at the efficiency level of the IM, regardless of the harmonic order or composition. Also, it can be noted that for individual harmonics of orders hÎ{11, 13}, even at THDV = 20%, the efficiency of the IM does not decrease with more than about 0.5% of the nominal value.
Figure 9. The efficiency of the IM versus harmonic content and THDV.
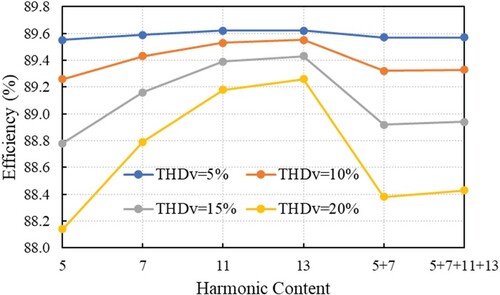
More significant decreasing in the efficiency of the IM due to the harmonics are recorded in the case of fifth-order harmonic as follows: Δη% = 0.97%, when THDV = 15%; and Δη% = 1.68%, when THDV = 20%. In the case when in the supply voltage waveform exists harmonics of 5th and 7th orders, with the corresponding levels, mentioned in Table , the efficiency of the IM decreases: with Δη% = 0.81%, when THDV = 15%; and with Δη% = 1.42%, when THDV = 20%.
5. Effects of unbalanced distorted voltages on the IM
5.1. Harmonic distortion of the stator current
Figure shows the average THDI of the stator current, on the three phases, depending on the unbalance and the harmonics, for the considered scenarios presented in Table . As it can be observed in Figure , the more significant variations of the THDIav are due to the harmonics. For the same degree of unbalance, the values of THDIav increase with increasing of THDV, while for the same value of THDV on different values of VUF, the variations of THDIav are insignificant.
Figure 10. The Average THDI of the stator current under voltage unbalance and harmonics scenarios.
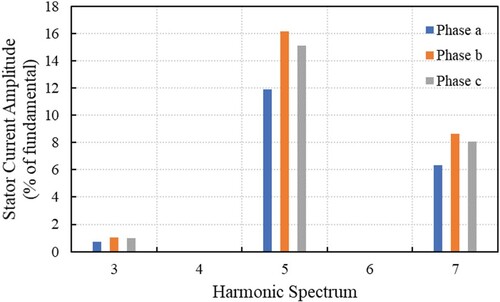
When the IM is supplied from unbalanced distorted voltages, in the harmonic content of the stator current are found harmonics of 3rd, 5th, and 7 orders, as presented in Figure , for VUF = 3% and THDV = 10% (containing voltage harmonics of both 5th and 7th orders). The presence of the 3rd harmonic in the stator current is due to the voltage unbalance, whereas the 5th and 7th current harmonics appear due to the voltage harmonics of the same orders. In Figure are presented the values of THDI for each of the three phases of the stator current. It can be observed that the magnitudes of the 5th and 7th harmonics are greater than the 3rd harmonic, which justifies the above observation about the more significant influence of the THDV than the VUF on the harmonic distortion of the stator current.
Figure 11. Harmonic spectrum of the stator current, for VUF = 3% and THDV = 10%, when in the voltage are present harmonics of both 5th and 7th orders.
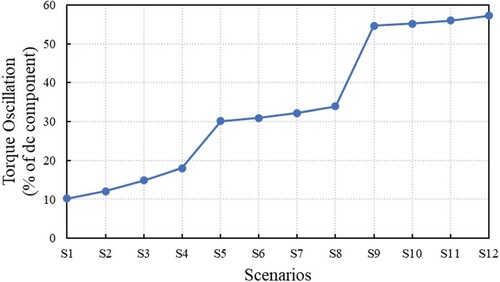
5.2. Electromagnetic torque of the IM
The amplitudes (maximum absolute value of the difference from the dc component) of the electromagnetic torque, expressed as a percentage of the dc component, depending on VUF and THDV are shown in Figure . It can be observed that the graph could be delimited in three increasing levels, corresponding to the three degrees of unbalance of 1%, 3%, and 5%. There is a jump between each consecutive level, with a higher growth slope than the growth slopes inside each level. This highlights the fact that the unbalance regime has a greater influence on the oscillations of the electromagnetic torque than the harmonics, under the given conditions. Another observation is that the jump between S8 and S9 (degree of unbalance from 1% to 3%) is almost two times higher than the one between S4 and S5 (degree of unbalance from 3% to 5%).
Figure 12. The amplitude of the torque oscillations under voltage unbalance and harmonics scenarios.
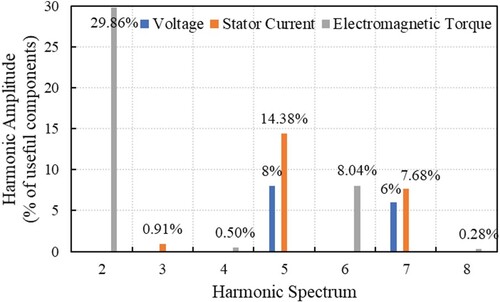
The harmonic amplitudes, as a percentage of the useful components, of the stator current, supply voltage, and electromagnetic torque, for VUF = 3% and THDV = 10%, are presented in Figure . The torque oscillations of the frequency of 100 Hz, due to the voltage unbalance, represent 29.86% of nominal torque, not being influenced by the harmonics (Figures and ). The magnitude of the frequency component of 300 Hz, associated with harmonics (including harmonics of 5th and 7th orders), represents 8.04% of the nominal torque and it is not influenced by voltage unbalance (Figures and ). The torque oscillations at 4 and 8 times the fundamental frequency are generated due to the combined effect of the voltage unbalance and harmonics [Citation30].
Figure 13. Harmonic spectrum of the stator current, voltage, and electromagnetic torque, for VUF = 3% and THDV = 10%, when in the voltage are present harmonics of both 5th and 7th orders.
5.3. Power factor of the IM
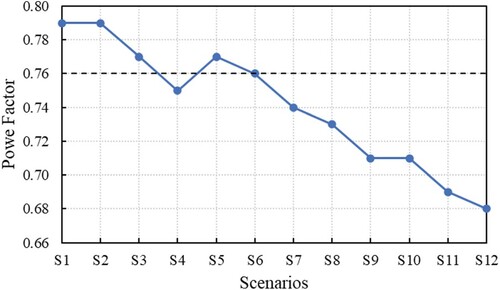
Figure shows the dependence of the PF on the combined effect of the voltage unbalance and harmonics. It can be observed that: for a degree of unbalance of 1% and for THDV of 5%, 10%, and 15% (S1, S2, and S3) the values of PF are higher than the nominal value PFn = 0.76 (represented with the horizontal dashed line, in Figure ); for VUF = 3% and THDV = 5% (S5) the PF = 0.77, and in S6 the PF = PFn = 0.76. Another observation is that PF decreases almost linearly from S5 to S12, with the minimum value of PF = 0.68 in S12 (VUF = 5% and THDV = 20%).
Figure 14. PF of the IM under voltage unbalance and harmonics scenarios.
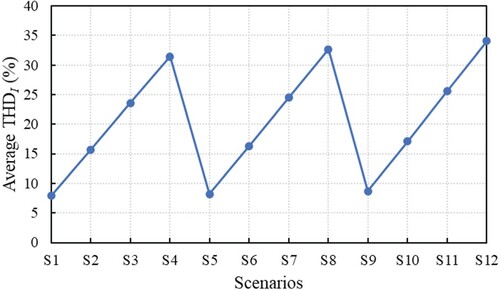
5.4. Efficiency of the IM
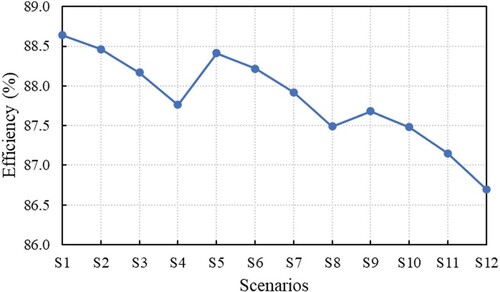
The efficiency of the IM, running at 75% of rated load, with the considered scenarios is plotted in Figure . As in the case of torque oscillations, the values of the efficiency can be spread on three levels corresponding to the three degrees of unbalance of 1%, 3%, and 5%. The efficiency of the IM decreases both with the increase of the voltage unbalance and with the increase of the harmonic distortion of the voltage waveforms. The decreasing slopes of each level, from S1−S4, S5−S8, and S9−S12, respectively, are almost of the same value; this means that the decrease associated with the harmonics (increasing THDV from 5% to 15%) is almost the same for each considered degree of unbalance. In S8 the efficiency of the IM is 87.49%, with 0.3% lower than the efficiency value in S4, and in S12 the decrease compared to the value from S8 is 0.9%; this means that the efficiency of the IM is more affected by the increasing of VUF from 3% to 5% than the increasing of VUF from 1% to 3%. In S12 (VUF = 5% and THDV = 20%) the efficiency of the IM is η = 86.7% which represent: a decrease of 3.29% compared to the nominal value ηn = 89.65%.
Figure 15. The efficiency of the IM under voltage unbalance and harmonics scenarios.
5.5. IM running at different motor loads
Further, we analyse the IM behaviour under non-sinusoidal and unbalanced voltages at different load percentages, of 25%, 50%, 75%, and 100%, for the considered scenarios. The scenario S0 from Figures represents the reference case when the IM is supplied from an ideal power supply (balanced and sinusoidal voltages).
Figure 16. THDI of the stator current under voltage unbalance and harmonics scenarios, at different load percentages.
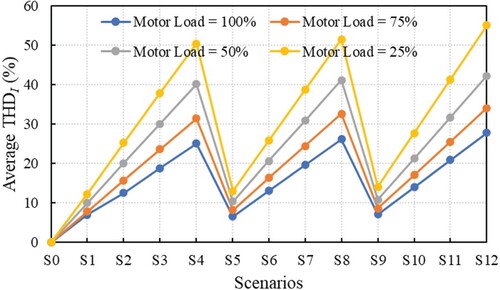
Figure 17. The amplitude of the torque oscillations under voltage unbalance and harmonics scenarios, at different load percentages.
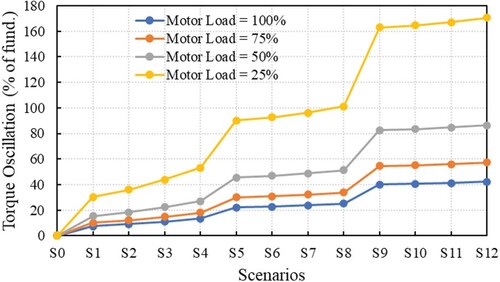
Figure 18. PF of the IM under voltage unbalance and harmonics scenarios, at different load percentages.
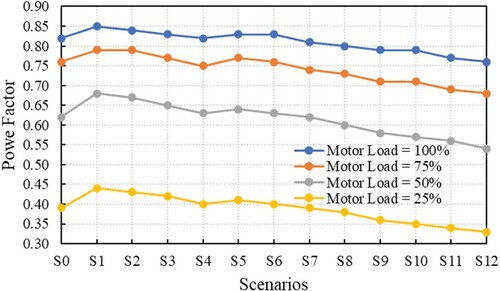
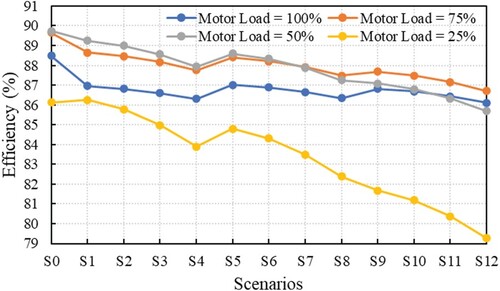
Figure 19. The efficiency of the IM under voltage unbalance and harmonics scenarios, at different load percentages.
Regarding the harmonic distortion of the stator current, the THDIav increase with decreasing the load percentage, as can be observed in Figure . It can be noted that for the IM running at 25% of rated load the values of THDIav exceed 50%.
In the case of the torque oscillations, it is observed that they are lower in amplitude the higher load percentage of the IM, as shown in Figure . To be noted that when the IM is loaded below 50% of rated load, the torque oscillations significantly increase, reaching amplitudes of about 170% of the nominal torque when the motor load is 25%.
Figure shows the variation curves of the PF with the considered scenarios for different load percentages. It can be observed that the PF decreases with decreasing the motor loads. The PF takes values from 0.54–0.64 for the considered scenarios, while the IM load is 50%. For motor loads below 50%, the PF values decrease significantly, reaching the value of 0.33, if the IM load is 25%; this value corresponds to a decrease of 59.76% of the nominal value PFn = 0.82.
The efficiency of the IM depending on the considered supplying conditions and on the percentage of motor loads is shown in Figure . It can be observed that IM operates at higher efficiency in case it is loaded between 50 and 75% of the rated load. For motor loads below 50%, the efficiency decreases significantly, reaching η = 79.26% in S12 (VUF = 5% and THDV = 20%), which represents a decrease of Δη% = 10.42% compared to the nominal efficiency of the IM, running at nominal load, and supplied from an ideal voltage system.
6. Conclusions
For a detailed analysis of the effects of voltage unbalance on the electrical and mechanical parts of the IM, it is not enough to know only the percent voltage unbalance, but it is also important to know the magnitude of the positive sequence component. We showed that for different situations of unbalance, e.g. Vpos < Vphn and Vpos > Vphn, for the same value of VUF, the torque oscillations can differ in amplitude by up to 22%, and the values of the efficiency differ by 1.21%. For the case of a lower value of the positive sequence component, were obtained lower values of the efficiency, but higher values of the PF.
From an electric point of view, the harmonics are felt both at the level of IM, by the variations of the PF and the efficiency, as well as at the level of the power supply system, by the current harmonics introduced in it and by the decrease of the PF. The harmonics can also cause oscillations of the electromagnetic torque. This can affect product quality where motor loads are sensitive to such variations. In cases in which substantial inertia is coupled to the rotor shaft, the electrical harmonics can excite a mechanical resonance. The resulting mechanical oscillations can cause shaft fatigue and accelerated aging of the shaft and connected mechanical parts.
Regarding the considered scenarios, when the IM is supplied from unbalanced and non-sinusoidal voltages, we showed that the voltage unbalance has a greater influence on the electromagnetic torque than the harmonics. For example, for VUF = 3% and THDV = 10%, the torque oscillations of 100 Hz frequency, due to the unbalance, is more than three times higher than the torque oscillations of 300 Hz frequency, due to the harmonics.
By simulating the considered IM under unbalanced distorted voltages at different percentage loads, it was observed that the performances of the IM are strongly affected, both electrically and mechanically, if it operates at loads below 50% of the nominal load. For VUF = 5% and THDV = 20% in the supply of the IM, running at 25% of rated load, the amplitude of the torque oscillations reaches about 170% of the dc component, the PF decreases with almost 60% of the nominal value, and the efficiency decreases with more than 10% of the nominal efficiency.
The proposed methodology for estimating the effects of voltage unbalance and harmonics, both separately and simultaneously, on the induction motor behaviour follows the basis for a generally applicable method to assess the overall effects of the considered PQ disturbances, for any application.
As future research, we plan: (1) to adapt the current physical model of the IM to track the effects of saturation on the current unbalance and harmonics developed in the motor; and (2) to analyse the consequences of voltage unbalance and harmonics on drive systems with IMs fed by power converters.
Disclosure statement
No potential conflict of interest was reported by the author(s).
Additional information
Funding
References
- International Energy Agency. World energy outlook 2016. Paris: IEA; 2016; [Online] Available from: https://www.iea.org/reports/world-energy-outlook-2016.
- Waide P, Brunner CU. Energy-efficiency policy opportunities for electric motor-driven systems. Paris: International Energy Agency; 2011.
- Debruyne C, Lieven V, Jan D. Harmonic effects on induction and line start permanent magnet machines. Proc. EEMODS; Rio de Janeiro, RJ, Brazil: 2013.
- Baggini Angelo. Handbook of power quality, pp. 163–174. John Wiley & Sons, Ltd, The Atrium, Southern Gate, Chichester, West Sussex PO19 8SQ, England; 2008.
- De La Rosa FC. Harmonics, power systems, and smart grids. 2nd ed. Boca Raton (FL): CRC Press, Taylor and Francis Group; 2015; p. 79–83.
- Tabora JM, De Lima Tostes ME, De Matos EO, et al. Assessing voltage unbalance conditions in IE2, IE3 and IE4 classes induction motors. IEEE Access. 2020;8:186725–186739. DOI:10.1109/ACCESS.2020.3029794.
- Agamloh EB, Peele S, Grappe J. Operation of variable-frequency drive motor systems with source voltage unbalance. IEEE Trans Ind Appl. 2017 Nov–Dec;53(6):6038–6046. DOI:10.1109/TIA.2017.2747144.
- Kini PG, Bansal RC. Effect of voltage and load variations on efficiencies of a motor-pump system. IEEE Trans Energy Convers. 2010 June;25(2):287–292. DOI:10.1109/TEC.2009.2032628.
- von Jouanne A, Banerjee B. Assessment of voltage unbalance. IEEE Trans Power Delivery. 2001 Oct;16(4):782–790. DOI:10.1109/61.956770.
- Siraki AG, Gajjar C, Khan MA, et al. An algorithm for nonintrusive in situ efficiency estimation of induction machines operating with unbalanced supply conditions. IEEE Trans Ind Appl. 2012 Nov–Dec;48(6):1890–1900. DOI:10.1109/TIA.2012.2225813.
- Wang Y-J. Analysis of effects of three-phase voltage unbalance on induction motors with emphasis on the angle of the complex voltage unbalance factor. IEEE Trans Energy Convers. 2001 Sept;16(3):270–275. DOI:10.1109/60.937207.
- Daniel Donolo P, Pezzani CM, Bossio GR, et al. Effects of negative sequence voltage on the core losses of induction motors. IEEE ANDESCON; Arequipa; 2016. p. 1-4. DOI:10.1109/ANDESCON.2016.7836232.
- de Castro e Silva MD, Ferreira Filho AL, Neves ABF, et al. Effects of sequence voltage components on torque and efficiency of a three-phase induction motor. Electr Power Syst Res. 2016;140:942–949. DOI:10.1016/j.epsr.2016.03.051.
- Lee C-Y. Effects of unbalanced voltage on the operation performance of a three-phase induction motor. IEEE Trans Energy Convers. 1999 Jun;14(2):202–208. DOI:10.1109/60.766984.
- Guasch-Pesquer L, Youb L, González-Molina F, et al. Effects of voltage unbalance on torque and current of the induction motors. 13th International Conference on optimization of electrical and Electronic equipment (OPTIM); Brasov; 2012. pp. 647–652. DOI:10.1109/OPTIM.2012.6231766.
- Neves ABF, d A, Filho LF, et al. Effects of voltage unbalance on torque and efficiency of a three-phase induction motor. 16th International Conference on harmonics and quality of power (ICHQP); Bucharest; 2014. pp. 679–683. DOI:10.1109/ICHQP.2014.6842807.
- Santos VS, Felipe PRV, Sarduy JRG, et al. Procedure for determining induction motor efficiency working under distorted grid voltages. IEEE Trans Energy Convers. 2015 Mar;30(1):331–339. DOI:10.1109/TEC.2014.2335994.
- Debruyne C, Corne B, Sergeant P, et al. Evaluation of the additional loss due to supply voltage distortion in relation to induction motor efficiency rating. IEEE International Electric Machines & Drives Conference (IEMDC); Coeur d'Alene, ID; 2015. pp. 1881–1887. DOI:10.1109/IEMDC.2015.7409321.
- Donolo P, Pezzani M, Bossio G, et al. Impact of voltage waveform on the losses and performance of Energy efficiency induction motors. IEEE ANDESCON; Santiago de Cali; 2018. p. 1–4. DOI:10.1109/ANDESCON.2018.8564677.
- Debruyne C, Desmet J, Derammelaere S, et al. Derating factors for direct online induction machines when supplied with voltage harmonics: A critical view. IEEE International Electric Machines & Drives Conference (IEMDC); Niagara Falls, ON; 2011. pp. 1048–1052. DOI:10.1109/IEMDC.2011.5994745.
- Al-Badri M, Pillay P, Angers P. A novel in situ efficiency estimation algorithm for three-phase induction motors operating with distorted unbalanced voltages. IEEE Trans Ind Appl. 2017 Nov–Dec;53(6):5338–5347. DOI:10.1109/TIA.2017.2728786.
- Sousa V, Viego PR, Gómez JR, et al. Estimating induction motor efficiency under no-controlled conditions in the presences of unbalanced and harmonics voltages. CHILEAN Conference on Electrical, Electronics Engineering, Information and Communication Technologies (CHILECON); Santiago; 2015. p. 567–572. DOI:10.1109/Chilecon.2015.7400434.
- Oraee H. A quantitative approach to estimate the life expectancy of motor insulation systems. IEEE Trans Dielectr Electr Insul. 2000 Dec;7(6):790–796. DOI:10.1109/94.891990.
- Zhang D, An R, Wu T. Effect of voltage unbalance and distortion on the loss characteristics of three-phase cage induction motor. IET Electr Power Appl. 2018;12(2):264–270. DOI:10.1049/iet-epa.2017.0464.
- Ferreira FJTE, Baoming G, de Almeida AT. Reliability and operation of high-efficiency induction motors. IEEE Trans Ind Appl. 2016 Nov-Dec;52(6):4628–4637. DOI:10.1109/TIA.2016.2600677.
- Donolo PD, Pezzani CM, Bossio GR, et al. Derating of induction motors due to power quality issues considering the motor efficiency class. IEEE Trans Ind Appl. 2020 Mar–Apr;56(2):961–969. DOI:10.1109/TIA.2020.2965859.
- Beleiu HG, Maier V, Pavel SG, et al. Harmonics consequences on drive systems with induction motor. Applied Sciences. 2020 Feb;10(4):1528. DOI:10.3390/app10041528.
- Santoso S, McGranaghan MF, Dugan RC, et al. Electrical power systems quality. 3rd ed. New York (NY): McGraw Hill Companies; 2012.
- IEEE Std. IEEE recommended practice for monitoring electric power quality: IEEE Standard, New York, NY 10016-5997 USA; 2019. p. 1159.
- Donolo P, Bossio G, De Angelo C, et al. Voltage unbalance and harmonic distortion effects on induction motor power, torque and vibrations. Electr Power Syst Res. 2016;140:866–873. DOI:10.1016/j.epsr.2016.04.018.