
 ?Mathematical formulae have been encoded as MathML and are displayed in this HTML version using MathJax in order to improve their display. Uncheck the box to turn MathJax off. This feature requires Javascript. Click on a formula to zoom.
Abstract
The objective of this paper was to study and analyze the performance of a micro Wind – Solar Hybrid Generator (WSHG) in the Kingdom of Saudi Arabia (KSA). The WSHG consists of a micro wind solar system connected to a secondary distribution grid. The system was tested in two locations in the KSA namely DAMMAM and HA`IL and used the wind speed and solar radiation of two periods of the year. Two operating modes were discussed for the system: the Normal Operating Mode (NOM) and the Default Operating Mode (DOM). The simulation results showed the best performance of the system during the two periods of the year, in the two locations of the KSA, and in the two operating modes. The experimental measurements of the WSHG have been carried out and showed the similarity between the measured and simulated values of the output inverter voltage and of the DC-link voltage.
Nomenclature
| Kingdom of Saudi Arabia | = | KSA |
| Wind–solar hybrid generator | = | WSHG |
| Photovoltaic | = | PV |
| Normal operating mode | = | NOM |
| Default operating mode | = | DOM |
| Common coupling point | = | CCP |
| Maximum power point tracking | = | MPPT |
| Uninterruptible power supply | = | UPS |
| DC-link voltage | = | Uc |
| Reference active power | = | Preq_ref |
| Reference reactive power | = | Qreq_ref |
| Output inverter voltages in d, q axis | = | Vid, Viq |
| Grid voltages in d, q axis | = | Vrd, Vrq |
| Voltages across the load in d, q axis. | = | VLd, VLq |
| Active and reactive powers requested | = | Preq, Qreq_ |
| Active and reactive powers transferred | = | Ptr, Qtr |
| Total generated active power | = | |
| Reference total generated active power | = | |
| Active reference power across capacitor | = | |
| Estimated power losses | = | |
| Reference current of capacitor | = | ic-ref |
| Reference battery current | = | IBat-ref |
| Generator and load currents | = | Igen, Iload |
1. Introduction
The Kingdom of Saudi Arabia (KSA) like the rest of the world countries has focused on renewable energies as an energy complement in electricity production in the last 20 years to reduce their dependence on oil [Citation1,Citation2]. The KSA has placed among its priorities in “vision 2030” the investment in the field of renewable energy and targeted the production of more than 40 GW of electricity from renewable energies [Citation1]. The KSA is characterized by high solar radiation in all its regions during long periods of the year with an annual average of daily radiation that ranges from 5700 to 6700 Wh/m2 [Citation3,Citation4]. The KSA also enjoys an important wind energy that varies according to regions [Citation4–7]. Wind and PV generators have a fluctuating nature because their generated powers are random and unpredictable [Citation8], which affects the distribution grid. Because of the inclusion of these renewable generators, power and voltage flows are impacted not only by the loads but also by the sources. Owing to these technical specificities of photovoltaic and wind installations, the connection of PV and wind systems to the grid may have significant impacts on its operation [Citation9–11]. Among the most significant influences of PV and wind systems on the distribution grid we can cite the effects on the voltage at the common coupling point CCP [Citation9,Citation12,Citation13], the quality of transferred energy [Citation9], the losses in the distribution grid [Citation9,Citation14] and the protection system [Citation9]. Several researchers in the renewable energies field have worked to solve the problems related to renewable sources. Many studies deal with hybrid systems that connect the renewable wind and/or solar generators to other sources like diesel generators, hydraulic generators and others [Citation15–27]. The renewable sources hybridization mainly contribute to solve the unbalance of the transferred powers to the grid or the isolated loads which is of great economic importance for the KSA [Citation4,Citation25,Citation28,Citation29]. The micro wind–solar hybrid system is a good solution because of its negligible impact on the network and its numerous technical and economic advantages [Citation30]. In fact, it may easily help Saudi Arabia decrease the high cost of energy in buildings [Citation31].
In this paper, a micro WSHG connected to the secondary distribution grid (220–240/380–415 V – 50–60 Hz) was proposed to study, analyse and check its performance in different locations in the KSA, over different time periods of the year and under different operating modes. To this end, two regions in KSA, namely Dammam in the east and Hàil in the northwest of the Kingdom were chosen to test the system. The wind speed and the solar radiation of these two regions have been studied and considered in two different periods of year. The first period, from November to April, is characterized by a mild weather while the second, from May to October, is rather hot and humid.
Two operating modes of the proposed generator were discussed and controlled; the normal operating mode (NOM), and the default operating mode (DOM). In the NOM, the hybrid generator was connected to the grid. An approach command was developed around the inverter to control the active and reactive powers by controlling the grid injected current. A loop control system of current was developed with reference values calculated from active and reactive powers transferred to the grid taking into account an infinity load. Several defaults may appear on the secondary distribution grid at the CCP like the voltage decrease, single phase or poly phase short circuit (ph-N, ph-ph, 3ph), and material dysfunction. In this case, the grid would be automatically disconnected from the renewable generator and the system operates at the DOM. Here, the WSHG feeds an isolated load. The injected currents are controlled to satisfy the requested power. The load imposes the reference currents of the controller from the requested active and reactive powers. A second controller was developed to control the current of batteries stored or generated according to the load and climatic conditions. Depending on the operating mode, a third controller was also developed to regulate the DC-link voltage by imposing a constant power on the capacitor using the power transfer equation.
Simulations were carried out using the proposed WSHG at around 5 kW under Matlab/Simulink to test the controllers and analyse the performance of the system during the two time periods, in the two locations of the KSA, using the two operating modes. The experimental measurements of 4 kW of a micro WSHG have been achieved in order to compare the simulated and measured output inverter voltage and DC-link voltage.
The remaining of this paper is organized as follows; Section 2 described the proposed system. Section 3 introduced the control strategies and the developed controllers in two operating modes. The simulation and experimental results were detailed and discussed in Section 4 and Section 5, respectively. The main conclusions of the paper were drawn in Section 6.
2. System components and description
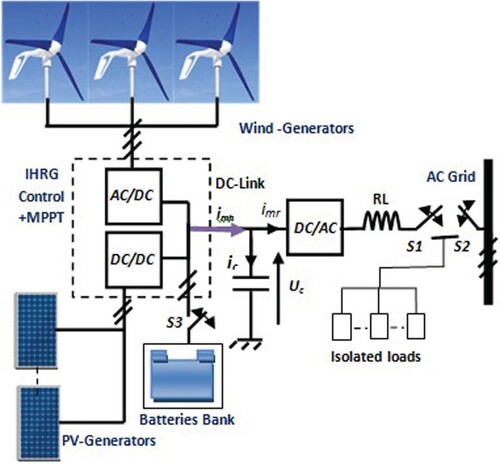
The WSHG consists of three micro 3-ph wind turbines and a photovoltaic generator made up of 24 solar panels. The wind and the photovoltaic generators are connected to the DC-link by means of a rectifier and boost DC shopper, respectively. The inverter is used to connect the DC-link to the secondary distribution grid (low voltage AC). A battery bank is added to the system to guarantee an uninterruptible power supply (UPS) in case of grid voltage defaults, very low solar irradiance and low wind speed. The system is displayed in .
Figure 1. System configuration.
3. Control strategies
3.1. Control approaches of generators
The wind generators are controlled through the ac–dc converter using the mechanical characteristics (torque-speed) of the wind turbines to extract the maximum of wind power. The boost DC shopper is controlled to extract maximum of PV power using the current–voltage characteristic of panel. The modelling and control of the wind and PV generators and the maximum power point tracking (MPPT) algorithms are detailed in [Citation32–43].
3.2. Modelling and control approaches of the grid connection
The WSHG grid connection is controlled according to the established operating mode; two cases were discussed in the following section.
1st case: The normal operating mode without grid defaults, where the switches S1 and S2 are closed. The power generated by the WSHG is transferred to the AC side. The inverter command approach controls the injected currents, which allows the control of active and reactive powers by imposing a control vector representing the output inverter reference voltages in Park d, q axis.
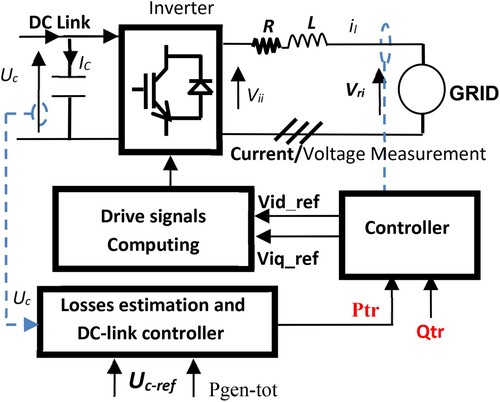
In this operating mode the reference values of currents are calculated by the active and reactive powers Ptr and Qtr transferred to the AC grid that considered an infinity load. shows the control strategy in the NOM. The control vector is calculated using the model of grid connection line given in Park d, q axis by
(1)
(1)
where Vid and Viq are the output inverter voltages in d, q axis; Vrd and Vrq are the grid voltages in d, q axis; R and L are respectively the filter resistance and inductance;
is the injected currents frequency.
Figure 2. Control strategy diagram in NOM.
The control vector is given by
(2)
(2)
The voltage
is obtained from the control of the inverter output current. It is given by
(3)
(3)
PI are a proportional-–integral regulators.
The inverter output current is represented by the vector .
The currents reference values are expressed as functions of active and reactive reference powers. They are given by
(4)
(4)
2nd case: The grid default operating mode DOM established in case of a grid problem. Many defaults may appear on the secondary distribution grid at the CCP like voltage decrease, single phase or poly phase short circuit (ph-N, ph-ph, 3ph), and material dysfunction. The AC grid would be disconnected from the renewable energy generator by automatically opening switch S2 to protect the devices. Switch S1 is still closed and the WSHG powers the isolated load (islanding). In this mode, the battery bank produces or stores the energy according to the energy requested by the load and that produced by the generator.
In the DOM, the grid connection line model in Equation (2) becomes
(5)
(5)
where VLd and VLq are the voltages across the load in the dq axis.
The control vector is given by the following equation:
(6)
(6)
shows the control strategy blocs in the DOM.
Figure 3. DOM control strategy diagram.
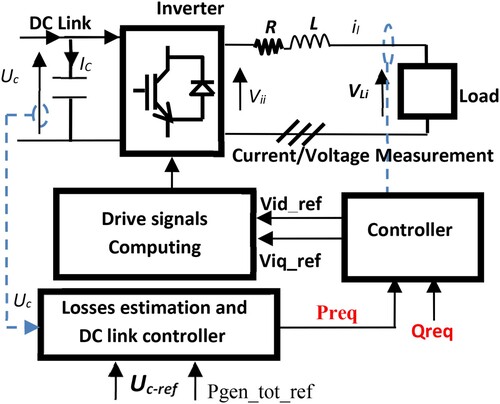
In the DOM, the currents reference values are determined by Equation (7). The active and reactive reference powers are requested and imposed by the isolated loads.
(7)
(7)
3.3. Battery current regulation
The batteries parallel to the DC-link capacitor store or generate the energy according to the power generated by the WSHG and the power requested by the load for uninterruptible power supply (UPS) in the DOM. The current is positive or negative respective to storage or generation and is calculated by the following equation:
(8)
(8)
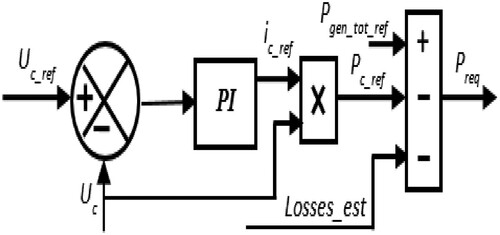
3.4. DC-link control in two modes
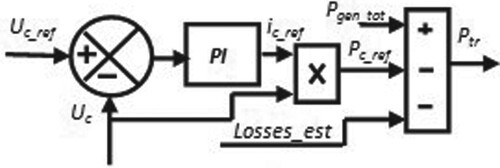
The DC-link voltage (Uc) is regulated by imposing a constant power on the capacitor and using the power transfer equation, which changes according to the operating mode. In the NOM, the power transfer equation is the following:
(9)
(9)
The DC-link voltage and the power transfer control are shown in .
Figure 4. DC-link voltage control structure in NOM.
In the DOM, the reference power to be generated by the hybrid generator is
(10)
(10)
Then, the power transfer equation is
(11)
(11)
The control of the DC-link voltage and the power transfer are shown in .
Figure 5. DC-link voltage control structure in DOM.
4. Simulations and discussion
4.1. Climatic condition studying
In this study, Matlab/Simulink software simulations were performed to test and verify the reliability of the developed controllers of the grid connection, DC link voltage and battery current control in different operating modes and to study the performance of the hybrid generator in the two locations over the two time periods, relying on the two operating modes. The simulations used the collected information on the wind speed and solar radiation over the two time periods in the two different locations in the KSA, Dammam and Hàil. The first is a coastal and desert region in the east of the KSA, whereas the second is mountainous and desert region in the northwest area of the KSA. During the first period (period 1) extending from November to April, the weather fluctuates between sunny, with important solar radiation, and cloudy and the wind reaches its highest speed. The second period (period 2), from May to October, is characterized by very sunny weather with a high solar radiation and a slight decrease of the wind speed compared to first period. The monthly average solar radiation is 4.866 and 5.383 kWh/m2 during period 1 and 7.05 and 7.583 kWh/m2 in period 2 for Dammam and Ha`il regions respectively [Citation3,Citation4]. The monthly average wind speed is 4.55 and 3.775 m/s during period 1 and 4.2 and 3.43 m/s in period 2 for Dammam and Ha’il regions respectively [Citation25,Citation26,Citation44,Citation45].
4.2. Results and discussion
To simulate the system, we built a very variable wind speed in a short time around the average values for Dammam and Ha`il in two periods as shown in Figure . A constant solar radiation equal to the average values for Dammam and Ha`il in the two periods were designed as shown in . The simulation parameters of the WSHG with the grid connection line are shown in .
Figure 6. Wind speed during the two periods.
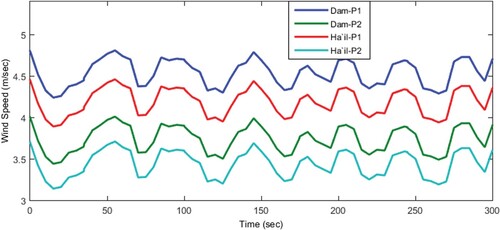
Figure 7. Solar radiation during the two periods.
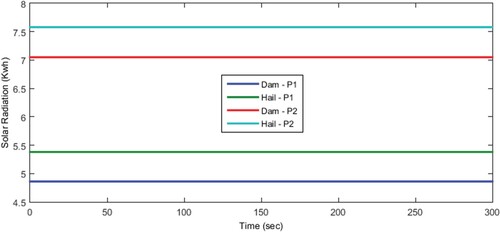
Table 1. The system main parameters.
4.2.1. Simulation of normal operating mode NOM
To study the performance of the WSHG connected to the AC grid, simulations for different locations and variable climatic conditions (wind speed and solar radiation) in period 1 and period 2 have been performed. Figures and show and compare the powers transferred to the grid in two periods in Dammam and Hàil, respectively. The curve is noticed to vary with time according to the wind speed. Figures and show and compare the powers transferred to the grid in Dammam and Hàil, over period 1 and period 2, respectively. The average value of the transferred power in Dammam is around 5 kW during period 1 and 5.5 kW during period 2. More specifically, the average of this power for Hàil is around 4 kW during period 1 and 4.8 kW during period 2. These results also indicate that the WSHG generates more power in Dammam than in Hàil in all the time periods. By comparing the two time periods, it can be remarked that the generated power during period 2 exceeds that generated during period 1 in all the regions. The DC link voltage controller and inverter controller were also tested in the connected mode. shows the measured DC-link voltage. This curve shows that the maximum difference between the measured and reference values is 0.001% (of reference value).
Figure 8. Power transferred in Dammam.
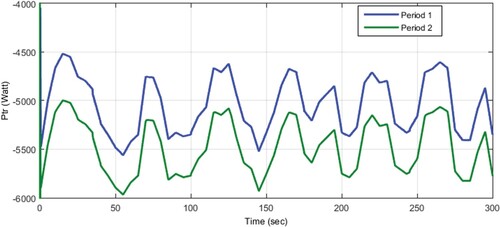
Figure 9. Power transferred in Hàil.
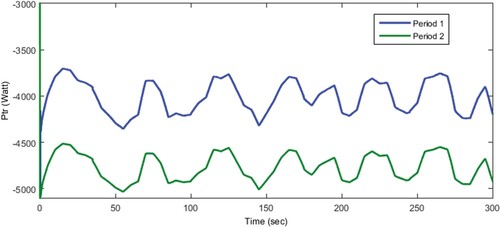
Figure 10. Power transferred in period 1.
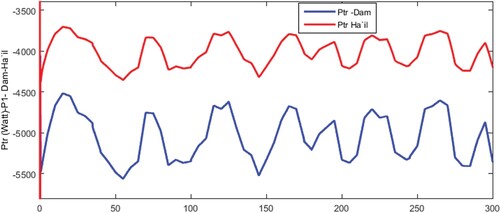
Figure 11. Power transferred in period 2.

Figure 12. DC-link voltage.
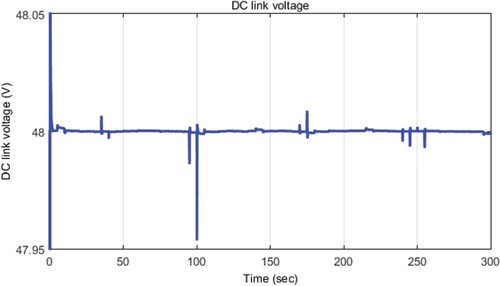
Figure 13. Transferred direct line current in NOM.
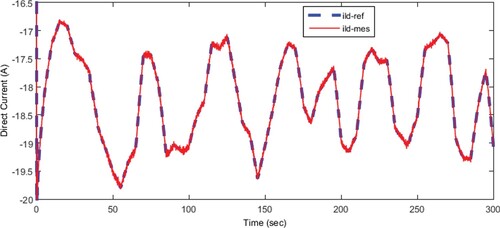
Figure 14. Transferred quadratic line current in NOM.
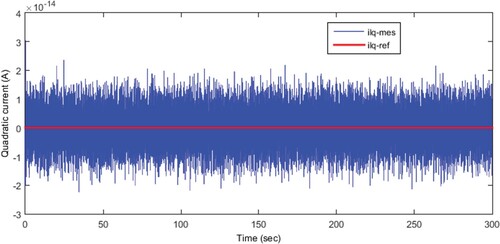
Figure 15. Direct output inverter voltage in NOM.
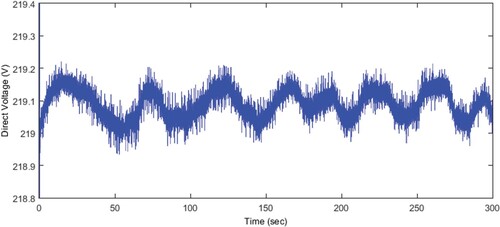
Figure 16. Quadratic output inverter voltage in NOM.
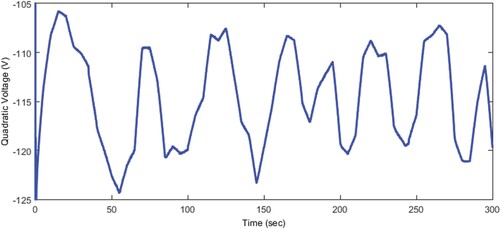
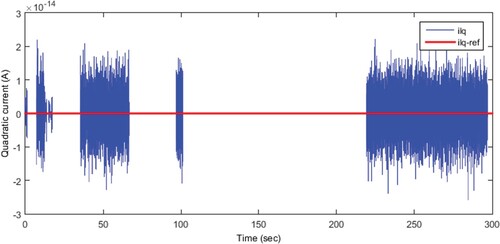
Figures and show the reference and measured values, for the direct line current and quadratic line current, respectively. Figures and display the direct and quadratic output inverter voltages. The results show the similarity between the measured and reference amounts, which indicates the good accuracy and reliability of the controllers in the normal operation mode.
4.2.2. Simulation of default operating mode DOM
During the default operating mode, the grid is disconnected from the hybrid generator and the WSHG powers the isolated load. To study the system performance and the developed controllers, the system has been simulated with the same wind speed and solar radiation of case 1 with a pure resistive load (R) then with an inductive load (RL).
Simulation with a pure resistive load:
The resistive load consumes active power and has a voltage and frequency of 220/380 V, 60 Hz, respectively. shows the reference active power requested by the load that was designed to be very variable over a short time to verify the controllers in these conditions. The same figure shows the active power generated by the hybrid generator and transferred to the load. The results are similar for Dammam and Ha`il, over the two time periods and show that the power provided by the WSHG instantaneously meets the load demand. This indicates that the generator satisfies the requested power in the two regions over the two periods. shows the battery current in Dammam and Ha`il in period 1, whereas Figures and show the battery current in period 1 and period 2, in Dammam and Ha`il, respectively.
Figure 17. Transferred and requested power.
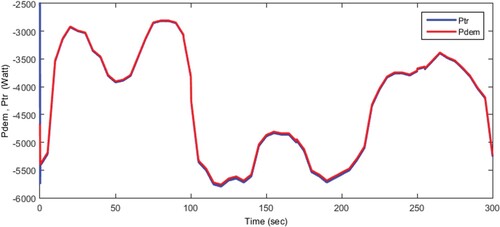
Figure 18. Battery current in Dammam and Hàil.
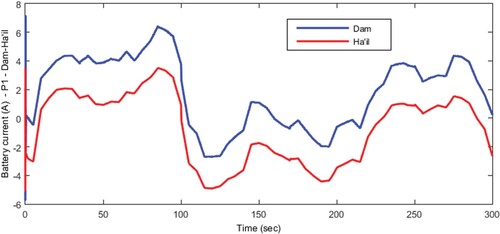
Figure 19. Battery current in Dammam over the different periods.
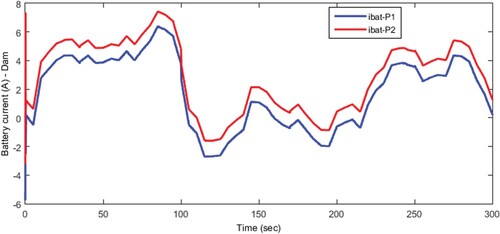
Figure 20. Battery current in Hail over the different periods.
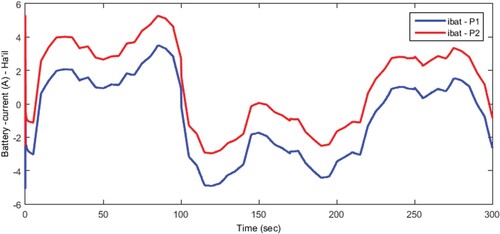
Figure 21. Direct axix line current.
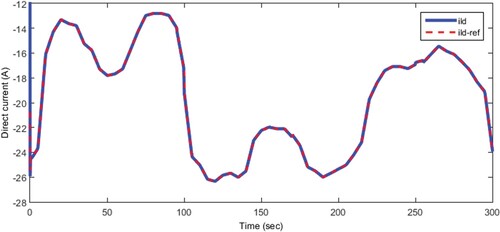
Figure 22. Quadratic direct axix line current.
The battery current curves are displayed in Figures . shows the battery current in Dammam and Hàil during period 1. Figures and show respectively the battery current in Dammam and Hàil during the two periods (P1 and P2). These figures show that the storage in period 2 is higher compared to period 1. It is also remarked to be higher in Dammam than that of Hàil. Moreover, the current generated by the batteries is lower in Dammam compared to that of Hàil and in period 2 when compared to period 1. This indicates that the generator produces more power in Dammam than in Hàil. It also generates more power in period 2 than in period 1 with DOM.
Figures and show the reference and measured values for direct and quadratic line currents, respectively. The measured values are noticed to follow the reference ones instantly. Figures and show the direct and quadratic output inverter voltages. The results show the good accuracy and reliability of the conceived controllers.
Simulation with inductive load (RL):
Figure 23. Direct output inverter voltage.
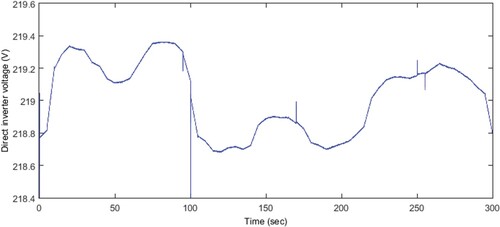
Figure 24. Quadratic output inverter voltage.
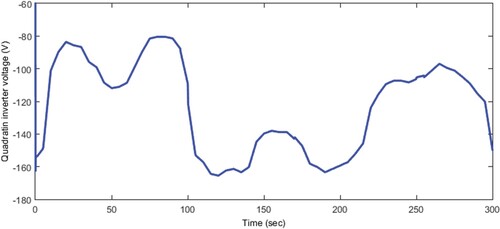
Figure 25. Requested and transferred active power.
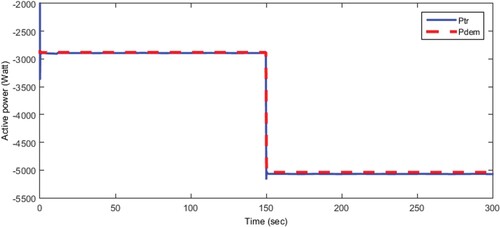
Figure 26. Requested and transferred reactive power.
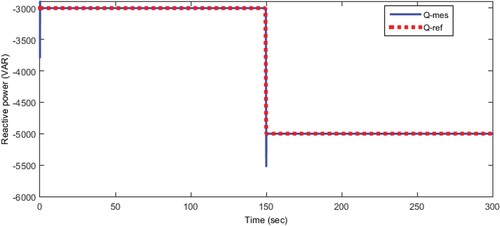
Figure 27. Direct axis line current.
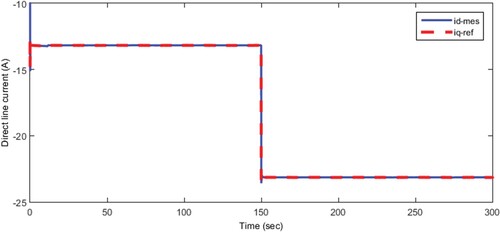
Figure 28. Quadratic axis line current.
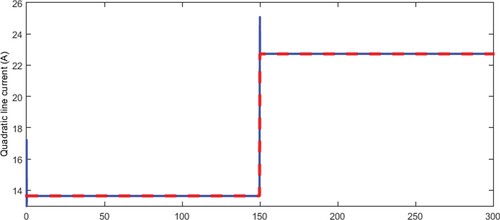
Figure 29. Direct output inverter voltage.
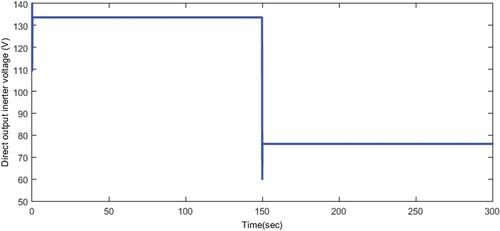
Figure 30. Quadratic output inverter voltage.
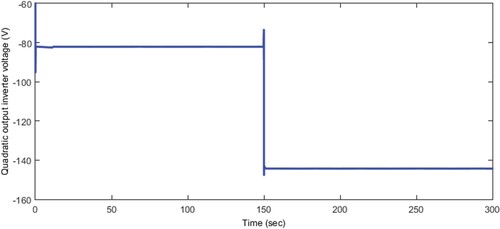
Figure 31. Battery current in different periods.
The system was tested and simulated with an inductive load RL that consumes active and reactive powers under 220/380 V–60 Hz. Figures and show the reference powers requested by the load (hidden line) and the measured powers transferred from the generator. The results indicate that the generated powers follow the requested ones by the load. The generator responds quickly to satisfy the demand for a sudden change in the power with a response time of less than 0.15 s.
The reference values of direct and quadratic injected currents calculated from the active and reactive powers are shown respectively in Figures and . The same figures also display the generated currents by the inverter and injected to the load.
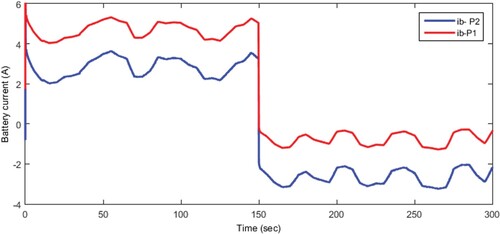
Figures and , respectively, show the direct and quadratic inverter control voltages that are the components of control vector (Vod-ref, Voq-ref). These revealed results show the high precision of the inverter controller over a short response time. The battery current measured during this operating mode for the two periods is shown in . The battery stores the energy (positive current) for the time less than 150 s because the demanded power is satisfied only by wind and solar. For the time more than 150 s the battery operates as a generator (negative current) to compensate the power generated by wind and solar and to satisfy the power demanded by load.
The batteries generate more current in period 1 than in period 2, which indicates that the WSHG produces more current in period 2.
The obtained simulation results of the WSHG show the good performance of the hybrid generator in the two studied locations over the two time periods, with an increase in period 2 in Dammam. The simulations also show the accuracy and reliability of the developed controllers in the management of the transferred active and reactive powers under both normal and default operating modes. The transferred power instantaneously reaches the load power. Hence, the controller offers a good power tracking with an error less than 0.5%. The system has a very acceptable time response of less than 0.15 s in the control and transfer of the requested power due to demand variation. The controller offers good performance for controlling of injected currents and transferred active and reactive powers. Such a good performance is reflected through the short response time, high precision and system stability, despite the rapid change of the wind speed and the variation of the requested powers in a very short time. Hybrid generators are going to be a good source of energy in KSA in the future. There is recent simulation work using computational fluid dynamics for evaluating the stress, pressure and temperature of aircraft under various conditions [Citation46,Citation47]. Due to different weather conditions, change in stress, pressure and temperature can be treated in the future work of the present paper on the hybrid wind-solar generators.
5. Experimental results
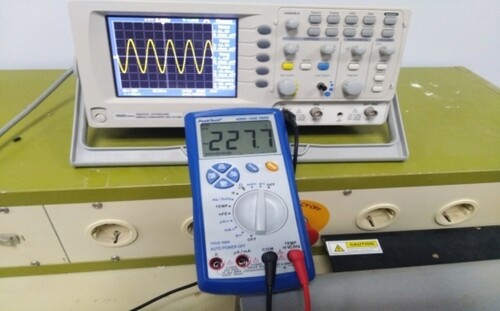
The experimental system was installed in Dammam and consists of three micro wind turbines of 1.2 kW in total, 10 solar panels of about 2.5 kW, a group of batteries of 48V-480AH, DC-link with an MPPT regulator and a 1-ph inverter (). The system parameters are shown on .
Figure 32. Batteries and inverter.
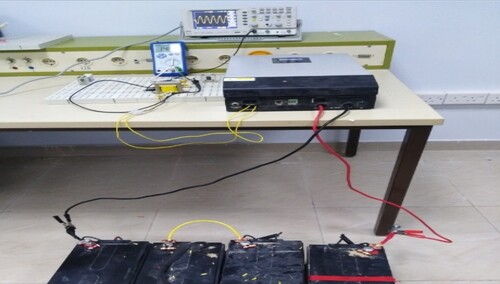
Table 2. Experimental system main parameters.
Figure 33. Measured DC-link voltage.
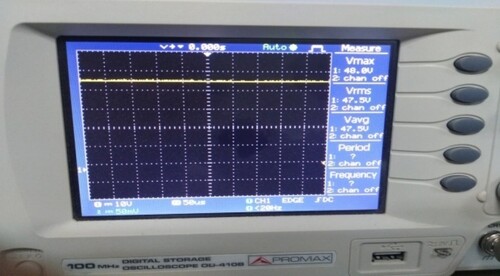
Figure 34. Simulated DC-link voltage.
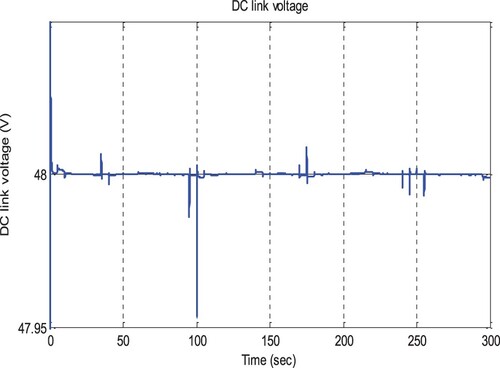
Figure 35. Simulated phase voltages inverter.
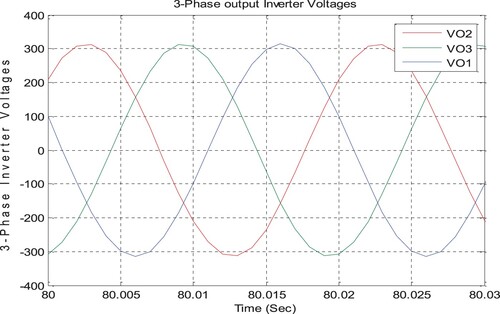
Figures and show the DC-link voltage, measured from the experimental system, and the simulated one using Simulink software. These results highlight the great similarity between simulation and experimentation. The output phase voltages of 3-ph inverter given by simulation are shown in . The measured voltage of 1-ph experimental inverter is shown in and is remarked to be similar to the simulated phase voltages.
Figure 36. Measured output inverter voltage.
6. Conclusion
In this paper a performance of micro wind solar hybrid generator WSHG has been studied and analysed in the Kingdom of Saudi Arabia (KSA). Two system operating modes were discussed and studied. The first mode is the normal operating mode (NOM) where the generator is connected to an AC grid. The second is the default operating mode, where the generator is disconnected from the AC grid after detecting some default and feeds an isolated load. The control of active and reactive powers transferred from the generator by means of controlling of grid-injected current was discussed in each mode through the development of a controller around the inverter. The DC link voltage controller was developed by imposing a constant power in the capacitor and using the power transfer equation according to the operation mode. The battery current is controlled during the DOM to be stored or generated according to requested power and imposed by load and power generated by the WSHG. The system performance was studied and analysed in two locations in the KSA, namely Dammam and Ha`il with wind speed and solar radiation during the two periods of the year and using the two types of operating modes.
The simulation results show that the system operates well in Dammam and Ha`il over the two time periods, and with each operating mode. The results also indicate that the energy generated in period 2 is higher than that generated in period 1. In the same period, this energy produced in the two locations is close in quantity with a slight increase in Dammam.
The generated power follows the reference power imposed by load or transferred to grid according to the operating mode with a low error rate of less than 0.5% during a response time less than 0.15 s with a rapid change of the wind speed requested powers in a very short time. The DC link controller offers a very low error less than 0.001% in the two modes. These results prove the high reliability and accuracy of the controllers. The experimental measurements of 4 kW of a WSHG have been carried out in order to compare the simulated and measured output inverter voltage and the DC-link voltage. The simulated voltages are very similar to the measured ones. This paper therefore emphasizes the good performance and the technical importance of the proposed micro hybrid wind solar generator in Dammam and Hàil in the two periods and in the two operating modes. The paper also contains valuable information and its results can be of great help for developing and installing a micro wind solar hybrid generator in the Kingdom of Saudi Arabia in general and in Dammam and Hàil, in particular. This study can be even applied in any other location in the KSA referring to its wind and solar data.
Disclosure statement
No potential conflict of interest was reported by the author(s).
Additional information
Funding
References
- Barhoumi EM, Okonkwo PC, and Zghaibeh M, et al. Renewable energy resources and workforce case study Saudi Arabia: review and recommendations. J Therm Anal Calorim. 2020;141:221–230.
- Alshammar N, Samy MM, Asumadu J. Optimal economic analysis study for renewable energy systems to electrify remote region in kingdom of Saudi Arabia. Proceeding of the 20th international middle east power system conference (Mepcon'20); 2018, Cairo University, Egypt, p. 18–20.
- Zell E, Gasim S, Wilcox S, et al. Assessment of solar radiation resources in Saudi Arabia. Science Direct-Solar Energy. 2015;119:422–438.
- Alharthi YZ, Siddiki MK, Chaudhry GM. Resource assessment and techno-economic analysis of a grid-connected solar PV-wind hybrid system for different locations in Saudi Arabia. Sustainability. 2018;10:3690, doi:10.3390/su10103690.
- Allhibi H, Chowdhury H, Zaid M, et al. Prospect of wind energy utilization in Saudi Arabia: A review. Sci Direct – Energy Procedia. 2019;160:746–751. 2nd International Conference on Energy and Power, ICEP2018, 13–15 December 2018, Sydney, Australia.
- Alabbadi N. Wind energy resource assessment for five locations in Saudi Arabia. Renewable Energy. 2005;30:1489–1499.
- Rratlas.energy.gov.sa. (2018). Saudi Arabia renewable resource atlas [Internet] Available from: https://rratlas.energy.gov.sa [cited 2020 Marsh 1].
- Abassi R, Chebbi S. Energy management strategy for a grid connected wind-solar Hybrid system with battery storage: policy for optimizing conventional energy generation. Int Rev Electr Eng (IREE). Marsh – April 2012;7(2):3979–3990.
- Thi Minh Chau Le. “Couplage onduleurs photovoltaïques et réseau, aspects contrôle / commande et rejet de perturbations”. THÈSE DE L’UNIVERSITÉ DE GRENOBLE. 25 Janvier 2012.
- Tran-Quoc T, Caire R. chapitre 5 du livre “La distribution d’énergie électrique en présence de production décentralisée”, éditeur LAVOISIER, 2010.
- Samy MM, Mossad MI, Barakat S. Reliability support of undependable grid using green energy systems; economic study. IEEE Access J. 2021;9:14528–14539.
- G. Rami, “Contrôle de tension auto adaptatif pour des productions décentralisées d’énergies connectées au réseau électrique de distribution”, Thèse doctorat de l’INPG, 2006.
- Tran-Quoc T, Le Thi Minh C, Bacha S, et al. Local voltage control of PVs in distribution networks. CIRED, Prague, Czech republic; 8–11 May 2009.
- Loenvenbruck P. Impact of distributed generation on losses, draw off costs from transmission network and investments of the French distribution network operator Erd. CIRED; juin 2009.
- Bhandari B, Lee K-T, Lee CS, et al. A novel off-grid hybrid power system comprised of solar photovoltaic, wind, and hydro energy sources. Appl Energy. 2014;133:236–242.
- Younsi S, Hamrouni N. Control of grid connected three-phase inverter for hybrid renewable systems using sliding mode controller. (IJACSA) Int J Adv Comput Sci Appl. 2018;9(11):336–342.
- Zhang Wp, Maleki A, Rosen MA, et al. Sizing a stand-alone solar-wind-hydrogen energy system using weather forecasting and a hybrid search optimization algorithm. Energy Convers Manage. 2019;180:609–621.
- Chen S, Kumar A, Wong WC, et al. Hydrogen value chain and fuel cells within hybrid renewable energy systems: Advanced operation and control strategies. Appl Energy. 2019;233–234:321–337.
- Abu-Hamdeh N, Alnefaie K. Techno-economic comparison of solar power tower system/photovoltaic system/wind turbine/diesel generator in supplying electrical energy to small loads. J Taibah Univ Sci 13(1):216224, doi: 10.1080/16583655.2018.1556916-2019.
- Eteiba MB, Barakat S, Samy MM, et al. “Optimization of an Off-grid PV/Biomass hybrid system with different battery technologies. Sustainable Cities Soc 2018;40:713–727. doi:10.1016/j.scs.2018.01.012.
- Samy MM, Barakat S, Ramadan HS. A flower pollination optimization algorithm for an off-grid PV-Fuel cell hybrid renewable system. Int J Hydrogen Energy (IJHE). 2019;44(4):2141–2152. doi:10.1016/j.ijhydene.2018.05.127.
- Samy MM, Barakat S, Ramadan HS. Techno-economic analysis for rustic electrification in Egypt using multi-source renewable energy based on PV/ wind/ FC. Int J Hydrogen Energy (IJHE). 2020;45(20):11471–11483.
- Barakat S, Samy MM, Eteiba MB, et al. Feasibility study of grid connected PV-biomass integrated energy system in Egypt. Int J Emerg Electr Power Syst. 2016;17(5). doi:10.1515/ijeeps-2016-0056.
- Samy MM, Elkhouly HI, Barakat S. Multi-objective optimization of hybrid renewable energy system based on biomass and fuel cells. Int J Energy Res. 2021;45(6):8214–8230.
- Tazy AF, Samy MM, Barakat S. A techno-economic feasibility analysis of an autonomous hybrid renewable energy sources for university building at Saudi Arabia. J Electr Eng Technol. 2020;15:2519–2527.
- Samy MM, Barakat S. Hybrid invasive weed optimization - particle swarm optimization algorithm for biomass/PV micro-grid power system. Proceeding of the 21th international middle east power systems conference MEPCON 2019, tanta university; 17–19 Dec. 2019; Cairo, Egypt.
- Mokhtara C, Negrou B, Settou N, et al. Design optimization of off-grid hybrid renewable energy systems considering the effects of building energy performance and climate change: case study of Algeria energy. Energy, Int J. 2020;219:1–18.
- Sawle Y, Gupta SC, Bohre AK. PV-wind hybrid system: a review with case study. Cogent Eng. 2016;3(1):1189305. doi:10.1080/23311916.2016.1189305.
- Khashab HE, Al Ghamedi M. Comparison between hybrid renewable energy systems in Saudi Arabia. J Electr Systems Information Technol. 2015;2(1):111–119. doi:10.1016/j.jesit.2015.03.010.
- Eid BM, Rahim NA, Selvaraj J, et al. Control methods and objectives for electronically coupled distributed energy resources in microgrids: A review. IEEE Syst J. 2016;10(2):446–458.
- Alshibani A, Alshamrani OS. ANN/BIM- based model for predicting the energy cost of residential buildings in Saudi Arabia”. J Taibah Univ Sci. 11(6):13171329, doi:10.1016/j.jtusci.2017.06.003-2017.
- Hamrouni N, Younsi S, Jraidi M. A flexible active and reactive power control strategy of a LV grid connected PV system. SciDirect – Energy Procedia. 2019;162:325–338.
- Younsi S, Jraidi M, Hamrouni N, et al. Modelling and control of hybrid renewable energy system connected to AC grid. Int J Comput Sci Eng (IJCSE). 2011;3(12):38–54.
- Hamrouni N, Younsi S. Moncef jraidi “modelling, command and treatment of a PV pumping system installed in Tunisia. (IJACSA) Int J Adv Comput Sci Appl. 2019;10(2):414–420.
- Younsi S, Jraidi M, Hamrouni N, et al. Artificial neural network control of hybrid renewable energy system connected to AC grid. IJCIT. 2011;2(2):44–52.
- Apata O, Oyedokun DTO. An overview of control techniques for wind turbine systems. Sci African. 2020;10:e00566.
- Baran J, Jąderko A. An MPPT control of a PMSG-based WECS with disturbance compensation and wind speed estimation. Energies. 2020;13:6344, doi:10.3390/en13236344.
- Yang J, Fang L, Song D, et al. Review of control strategy of large horizontal-axis wind turbines yaw system. Wind Energy. 2021;24:97–115. doi:10.1002/we.2564.
- Tan RHG, Er CK, Solanki SG. Modeling of photovoltaic MPPT lead acid battery charge controller for standalone system applications. E3s Web of conferences 182, 03005 (2020) CPEEE; 2020.
- Chellakhi A, El Beid S, Abouelmahjoub Y. Implementation of a novel MPPT tactic for PV system applications on MATLAB/simulink and proteus-Based arduino board environments. Int J Photoenergy. 2021:1–19.
- Xu L, Cheng R, Yang J. A new MPPT technique for fast and efficient tracking under fast varying solar irradiation and load resistance. Int J Photoenergy. 2020;2020:1–18.
- Abdelkhalek C, Said EB, Younes A. A novel MPPT tactic for PV systems with fast-converging speed and zero oscillation. 5th International Conference on renewable energies for developing countries (REDEC); 2020, Marrakech, Morocco.
- Benghanem MS, Alamri SN. Modeling of photovoltaic module and experimental determination of serial resistance. J Taibah Univ Sci. 2(1):94–105. doi:10.1016/S1658-3655(12)60012-0-2009.
- RATE WIND SPEED OBSERVED BY PME MET STATIONS for 2015 A.D. General Authority for statistics- KSA.
- Azorin-Molina C, Rehman S, Guijarro JA, et al. Recent trends in wind speed across Saudi Arabia, 1978–2013. Int J Climatol. 2018;38(Suppl.1):e966–e984. - Published online 29 January 2018 in Wiley Online Library (wileyonlinelibrary.com) doi:10.1002/joc.5423.
- Malik L, Rawat S, Kumar M, et al. Comparative analysis of aerodynamic characteristics of F16 and F22 combat aircraft using computational fluid dynamics. MaterToday Proc. 2021;38:191–197.
- Malik L, Tevatia A. Comparative analysis of aerodynamic characteristics of F16 and F22 combat aircraft using computational fluid dynamics. Def Sci J. 2021;71(2):137–145.