
 ?Mathematical formulae have been encoded as MathML and are displayed in this HTML version using MathJax in order to improve their display. Uncheck the box to turn MathJax off. This feature requires Javascript. Click on a formula to zoom.
Abstract
Semiconducting single-walled carbon nanotubes (s-SWCNTs) have the potential as light to heat efficiency, recently known as photothermal conversion efficiency , for photothermal therapeutic applications since they exhibit strong absorption in the near-infrared region (NIR). We report experimental studies of light to heat efficiency of two classes of s-SWCNTs, including double chiralities (DC) and many chiralities (MC) of s-SWCNTs. The
was obtained by using the results from the experimental heating of s-SWCNTs with NIR light at 808 nm. Interestingly, the
of MC s-SWCNTs was 1.88-fold higher than DC s-SWCNTs, which leads to a 19% decrease in the heating rate of DC compared to the heating rate of MC s-SWCNTs. This study demonstrates that chirality dependence is an essential metric in the heating rate of s-SWCNTs and provides a validated framework to compare the heating capabilities between DC and MC.
1. Introduction
Since their discovery in the early 1990s [Citation1,Citation2], carbon nanotubes (CNTs) have captured a lot of attention over the last few decades. They can be used in various applications, including biological sensing, gas storage, electronic devices, field emission devices, catalyst support, and photothermal therapy, owing to their excellent electronic, chemical, optical, and thermal properties [Citation3–7]. CNTs can be classified as single-walled (SWCNTs) or multi-walled (MWCNTs) and can be subdivided into semiconducting (s-SWCNTs) and metallic (m-SWCNTs) depending on their chiral index (n,m) [Citation8,Citation9]. Conceptually, they are composed of carbon atoms exhibiting sp2 electronic hybridization, but the photothermal response of the two SWCNTs classes are not the same. Only s-SWCNTs exhibit intense absorption in the NIR spectral region [Citation10], which makes them efficient transducers of light energy into heat, referred to as a photothermal effect. The emission quantum yield of s-SWCNTs is typically very low (less than 1%), so most of the absorbed NIR photon energy has the potential to be retained within the medium and dissipated as heat.
Because biological tissue has so-called first and second NIR-biological transparency windows, leading to relatively deep NIR light penetration into the tissue, the use of s-SWCNTs irradiated by the NIR has the potential for biomedical applications such as imaging and photothermal therapy known as hyperthermia [Citation11,Citation12]. Conversion of the NIR photon energy into heat can be used in the hyperthermia treatment of cancer [Citation13]. The photothermal effect can be quantitatively characterized by conversion efficiency [Citation14]. Various nanomaterials, for example: polymer [Citation15], metal sulphides [Citation16], metal oxides [Citation17], and organic molecules [Citation18], have been studied for the photothermal response. Recently, the of carbon dots (CDs) has shown high photothermal effects, with 30–86% light to heat efficiency being reported for the first near-infrared biological window at 808 nm [Citation19–22]. Moreover, the
of Multi Walled Carbon Nanotubes (MWCNTs) in the first and second biological transparency windows has been studied in recent years and found to be close to 50% in both windows [Citation23].
To the best of our knowledge, the of double chirality (DC) and multi chirality (MC) s-SWCNTs have yet to be studied. Here, for the first time, we study the comparison of the photothermal conversion efficiency between DC and MC s-SWCNTs in detail, showing that MC s-SWCNTs are a potential candidate for photothermal therapy (PTT) applications. In this report, DC and MC s-SWCNTs were dispersed in a 5 wt% sodium dodecyl sulphate (SDS) solution in ultrapure water and exposed by 808 nm NIR continuous wave (CW) light, which has been widely used in PTT applications. The temperature elevations were studied for two variables, concentration and power dependencies to completely understand the behaviour of the s-SWCNTs when irradiated to NIR light. We found that the
of MC s-SWCNTs reaches (87.9 ± 2.83) %, while DC s-SWCNTs reaches (46.86 ± 10.12) %. These results are significantly higher than other values reported for nanomaterials studied recently. The temperature elevations are relatively proportional to the photothermal conversion properties. This study expands the understanding of the use of CNTs in photothermal therapy and paves the way for exploring unique CNTs for biomedical applications. Also, this paper confirms that the chiral index of s-SWCNTs plays a major role to determine the photothermal properties. . Plus, this work is compared the results with other results published recently by using the same source of the laser wavelength.
2. Results
2.1. Experimental section
2.1.1. Experimental setup for temperature profile measurement
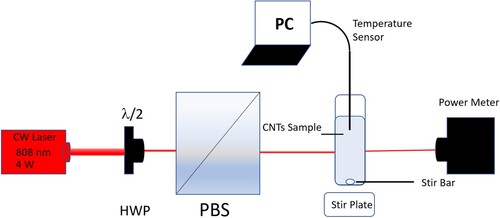
The experiment proceeded as the following: The laser was turned on and allowed to warm up for 30 min. Then, three millilitres (3 mL) of colloidal suspensions of single walled carbon nanotubes were placed in a standard glass cuvette (VWR, Aurora, CO 80011) and the temperature was measured by the temperature sensor connected to the computer-supported by a software. All the solutions were measured at room temperature (23°C) and the temperature was recorded for 25 min after targeting CW NIR laser (808 nm) to the solution as shown in the schematic in Figure . After 25 min of the excitation, the laser was turned off to decay at room temperature, where the laser measurements started. All data were collected until 50 min. The laser was passed through the cuvette to ensure that the transmitted power was measured accurately. It should also be noted that the care was taken to make sure that the temperature sensor was not in the beam path as the scattering could lead to a non-zero response when an aligning the beam as seen in Figure . A magnetic stir bar, set to 300 rpm, and plate were used to achieve uniform distribution of temperature and a glass cuvette was used to avoid as much as the reflection of the laser. While the cuvettes were not sealed, there was no solvent evaporation observed during the experimental measurements. The NIR CW red laser beam operating at 808 nm and output power 4 Watts was used for temperature profile measurements. The laser power and the transmitted power were measured at a focused point by a digital power metre (PM100D, Thorlabs, Dachau, Germany). Also, all samples were sonicated for 5 min before taking the laser measurements to avoid aggregation.
Figure 1. Experimental schematic of measuring temperature elevation of SWCNTs. HWP indicates a half-wave plate, PBS indicates polarizing beam splitter, and PC indicates a computer.
2.2. Spectroscopic deconvolution of SWCNTs absorbance spectra
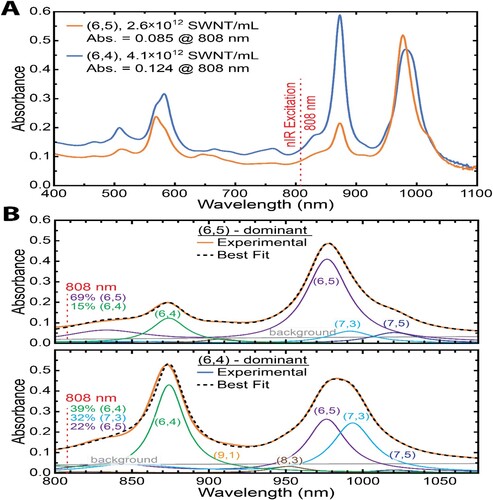
The NIR absorption for the DC and MC s-SWCNTs was determined by UV-Vis spectrophotometry, with a maximum value of around 980 nm, as shown in Figure (A). At 880 nm, DC s-SWCNTs have a weak peak with OD at 0.097, but MC s-SWCNTs have a strong peak with OD at 0.116. In all cases, the absorption of MC s-SWCNTs was higher than DC s-SWCNTs in the range from 400 nm up to 900 nm. It should be noted that for both the DC and MC cases, a photon transition in the first window (1.27–1.77 eV) is observed, and the tube length supposely has an average of 300 nm. The absorbance properties of the two SWCNTs suspensions investigated are shown in Figure (A), with clear SWCNTs character arising from the chirality-dependent absorbance peaks in the NIR (E11) and visible (E22) spectral regions and minimal background signal [Citation24,Citation25]. While the concentration of SWCNTs within the MC suspension is 30% greater than that in the DC suspension, total absorbance at the excitation wavelength (808 nm) is very similar between the two samples, with DC and MC exhibiting absorbance of 0.09 and 0.145 at 808 nm, respectively. Importantly, the minimal difference in absorbance between the two samples is accounted for within the model for heat dissipation presented below. Each SWCNTs chirality is identified by its two-dimensional chiral wrapping vector (n,m), which governs both its structural and electronic properties [Citation26,Citation27]. Because each semiconducting SWCNTs exhibits only one absorbance peak within the NIR, best-fit spectral deconvolution of this region using a sum of Lorentzian line shapes of known centre [Citation27], constant width, and varying height can be used in conjunction with SWCNTs chirality dependent molar absorptivity [Citation28] and the assumption that each SWCNTs are 300 nm long after prolonged sonication [Citation29] to calculate the chirality dependent SWCNTs concentration within each sample, Figure (B). Further details of the spectral deconvolution algorithm used here have been described elsewhere [Citation30,Citation31]. Of greatest relevance to the present work is the SWCNTs chirality-dependent contribution to the absorbance of each sample at the NIR excitation wavelength. Specifically, among SWCNTs chiralities absorbing at-or-above 10% of the light at 808 nm, the DC suspension accounts for 69% of absorbed photons by the (6,5) chirality and 15% by the (6,4) chirality. In contrast, the MC suspension exhibits a much more distributed absorbance among SWCNTs chiralities present, with 39%, 32%, and 22% of absorbed photos by the (6,4), (7,3), and (6,5) chiralities, respectively as depicted on Figure (B). The NIR laser’s absorbance affords excitation of a unique subset of SWCNTs chiralities between the two samples, affecting their respective heat dissipation properties, as demonstrated experimentally and modelled theoretically below.
Figure 2. Absorbance properties of double chirality (DC) and many chiralities (MC) SWCNTs are employed within this work. Spectra reveal clear SWCNTs characteristics of the sample due to characteristic chirality dependent absorbance peaks in the NIR (E11) and visible (E22) spectral regions, A. Quantification of each sample according to SWCNTs chirality is afforded by spectral deconvolution in the E22 region, demonstrating sample dependent absorbance among SWCNTs chiralities present at the excitation wavelength (808 nm), B.
2.3. Temperature profiles of the DC and MC s-SWCNTs
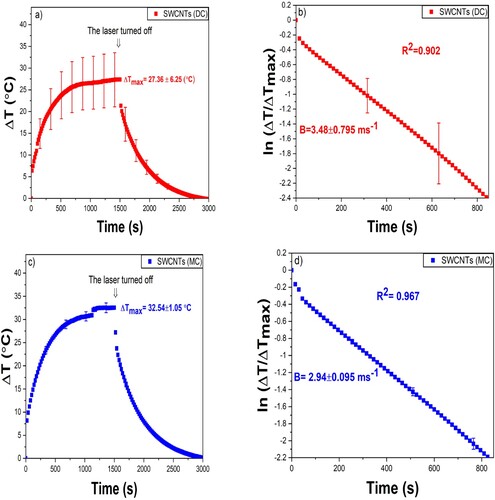
The temperature profile and the natural log of ΔT/ΔTmax as a function of time plots for the DC and MC s-SWCNTs are shown in Figure . Three millilitres of the solution were irradiated with an 808 nm CW laser and the temperature was measured with a temperature probe. Heating was observed for the first ten minutes and then the solution began to reach steady state. After this steady-state was reached, the laser was turned off, and the solution was allowed to cool at room temperature for 25 min. Figure (b and d) shows a natural log plot of ΔT/ΔTmax as a function of time after the laser was inactivated and was used to find the rate of heat loss constant, B. The linear relationship between the natural log of ΔT/ΔTmax and time shows that a first-order decay was observed for the temperature decay back to the ambient temperature where the temperature profile started. After the irradiation for 25 min, the maximum temperature change for SWCNTs (DC) was indicated in Figure (a). Also the temperature change for SWCNTs (MC) was indicated in Figure (c). The schematic of the experimental setup is shown in Figure .
Figure 3. (a) and (c) The temperature profile of SWCNTs (DC) and SWCNTs (MC) showing the increase in temperature after exciting the laser and temperature profile decay back to the ambient after the laser shut off. (b) and (d) Plot of the natural log of ΔT/ΔTmax as a function of time. R2 indicates how the data are fitting into a linear model. ΔTmax defines as Tmax–T0. The error bars represented the standard deviations of three experimental measurements (N = 3).
2.4. Temperature profile based on the concentration and excited power of s-SWCNTs
Next, the effect of concentration for both types of SWCNTs (DC and MC) was studied by diluting the stock solution by a factor of 2.5, 5, and 10, and the results are shown in Figure . The largest temperature change was observed for the undiluted stock solutions of the samples, while the least amount of temperature change was found in the most dilute (1:10) samples. In this case, ΔT was almost proportional to the concentration. The linear relationship shows that ΔT increases as the concentration increases as can be seen in Figure (c) which was predicted by the Beer–lambert law. It is also important to note that the change in temperature of the MC samples was always greater than that of the DC samples.
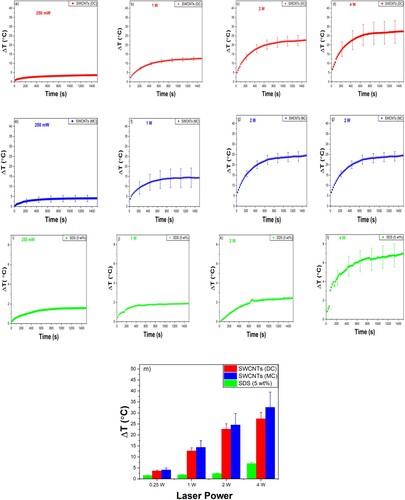
The heating rate as a function of the applied power for DC and MC s-SWCNTS was also studied. The power was decreased from 4 W to 2 W, 1 W, and 250 mW as shown in Figure (a–d). Again, similar to the concentration dependence measurements, the MC s-SWCNTS heated much more than their DC counterparts. Taken together, the results of the concentration and power dependence studies indicate that the MC s-SWCNTs have stronger interactions with the NIR light, which can be explained by the strong peak at the NIR region in the absorption spectrum in Figure .
Figure 4. Temperature changes as a function of concentrations for SWCNTs (DC) (a) with diluted factor (DF) 10, (b) with DF = 5, (c) with DF = 2.5, and (d) with no dilution (DF = 0). Temperature changes as a function of concentrations for SWCNTs (MC) (e) with DF = 10, (f) with DF = 5, (g) with DF = 2.5, and (h) with no dilution (DF = 0). All the temperature elevations were measured for 25 min and excited by the CW laser operating at 808 nm with delivered power of 3.78 W. (i) Effect of s-SWCNTs concentration at the laser power at 4 W. The concentration of s-SWCNTs was adjusted to be in 0.1, 0.2, 0.4, and1 scales, where 0.1 represents DF = 10, 0.2 represents DF = 5, 0.4 represents DF = 2.5, and 1 represents DF = 0. The error bars represent the standard deviations of three experimental measurements (N = 3).
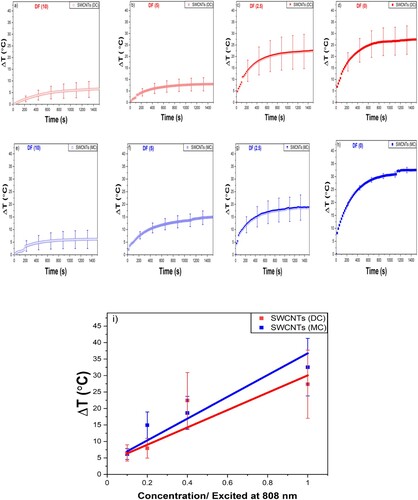
Figure 5. Temperature change as a function of time for SWCNTs (DC) excited (a) with 250 mW, (b) with 1 W, (c) with 2 W, and (d) with 4 W. Temperature change as a function of time for SWCNTs (MC) excited (e) with 250 mW, (f) with 1 W, (g) with 2 W, and (h) with 4 W. Temperature change as a function of time for water contained 5wt.% of SDS excited (i) with 250 mW, (j) with 1 W, (k) with 2 W, and (l) with 4 W. (m) summury of the maximum temperature changes of DC and MC s-SWCNTs and water contained 5wt.% of SDS as a function of laser power. The error bars represent the standard deviations of three experimental measurements (N = 3) and two experimental measurements (N = 2) for water contained 5wt.% of SDS. The average starndard deviation as a function of laser power calculated at 10.74% for SWCNTs (DC) and 21.21% for SWCNTs (MC) as represented in the figure m. All the temperature elevations were measured for 25 min and excited by the CW laser operating at 808 nm.
2.5. Calculations of the photothermal conversion efficiency of s-SWCNTs
The heating of SWCNTs leads to a change in the thermal energy of a colloidal SWCNTs suspension within a glass cuvette. This change is described by the rate of the input of the photon energy from laser power (), and the rate of heat dissipation, which satisfies the energy balance equation [Citation32,Citation33]
(1)
(1) where
(g) and
(J/g.°C) are the mass and specific heat capacity of the components of the system,
is the temperature of the solution, and
time. The input heat that is absorbed by SWCNTs is given as
(2)
(2) where
is the incident laser power,
is the transmitted laser power, and
is the photothermal conversion efficiency.
The output heat that is dissipated to the environment can be written as
(3)
(3) where
(W/K.m2) is the heat transfer coefficient,
(m2) is the surface area of the cuvette,
is the temperature at time
, and
is the ambient temperature. From Equations (2) and (3), Equation (1) can be simplified as
(4)
(4) where m and c are the mass and specific heat capacity of the component, respectively. In our case, we used the values for water and obtained m = 3 g, based on 3 mL of solution and C = 4.2 J/g.°C, based on the heat capacity of water. Here we define
as the change in temperature, and
(s−1) can be determined by tracing the temperature decay profile to the ambient temperature after the laser is turned off. In this regime
and, from Equation (4), one can be found
(5)
(5) where we applied the initial condition that is when the laser is turned off at
we have the maximum temperature
. For thermal equilibrium, the temperature is constant. Hence Equation (4) gives us the expression for the photothermal conversion coefficient
(6)
(6) The calculated
for both samples are presented in Table .
Table 1. Summary of the experimental and theoretical results.
2.6. Temperature heating profile of SWCNTs
The temperature profile during the laser measurements can be obtained after the determined by using the following expression:
(8)
(8)
The final formula after subtracting from Equation (8) above to fit our model can be rewritten as
(9)
(9)
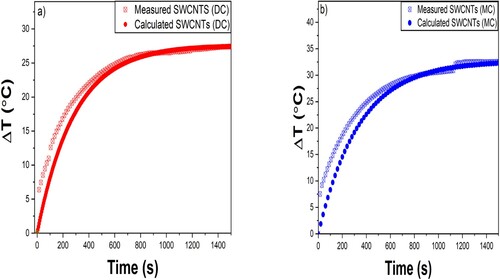
The measured and theoretical temperature profiles were presented in Figure , while the measured and theoretical maximum temperature changes and other parameters associated with Figure (a–d) including the and B presented in Table . Taken together, the theoretical model and experimental measurements are in good agreement.
Figure 6. Temperature changes of SWCNTs samples. (a) Measured (symbol) and calculated (solid line) the temperature changes of SWCNTs (DC). (b) Measured (symbol) and calculated (solid line) the temperature changes of SWCNTs (MC). The time of the calculated temperature was set to be ranging from 0 to 1500 s to compare it with the measured temperature changes. The error bars of the standard deviations for the experimental measurements were not presented here for better comparisons with theoretical models. The calculated temperature profiles were produced by using equation 2.8 in Chapter 2. All the variables were determined during the experimental measurements, and these variables were presented in the table below.
3. Discussion
This paper provides a comprehensive study of photothermal conversion properties, and the parameters associated with it for DC and MC s-SWCNTs. All experimental measurements were presented in triplicates for both samples. The samples were extensively characterized by determining the chiral indices, measuring the optical density via UV-Vis spectrophotometry, and by AFM. First, DC s-SWCNTs are a mixture of two chiral indices (n,m): 69% of (6,5) and 15% of (6,4). The MC s-SWCNTs are also a mixture of three chiral indices (n,m) with 39%, 32%, and 22% of (6,4), (7,3), and (6,5), respectively. Both the DC and MC samples were dispersed in 5 wt.% SDS in ultrapure water (UPW) for the photothermal studies. The OD was measured and normalized to 0.5 with both DC and MC s-SWCNTS exhibiting peaks in the NIR region. The MC s-SWCNTs showed a stronger peak at our wavelength of interest as seen in Figure (A). For all the photothermal studies outlined in this paper, a volume of 3 mL was used along with a continuous wave NIR laser with an output power of 3.78 W.
In the last two decades, the use of the laser at NIR, specifically at 808 nm, has become more popular with the rapid advancements in optical and electronic properties, as well as nanoscience and nanotechnology [Citation34]. Therefore, we used NIR light at 808 nm to study the optical and thermal properties of two samples of s-SWCNTs. While the samples showed a strong absorption at 880 nm for MC and 980 nm for DC, it is not necessary to use a light at the same absorption peak as one of the goals of this study to compare the results with other published results in respectful journals as seen in the Table . To this end, SWCNTs have high thermal conductivity along the tube, in which the materials have the ability to transfer heat to the surrounding medium [Citation35]. Generally, SWCNTs can be strongly excited by the laser in a wide range of spectrum, including visible and NIR region.
Table 2. Comparison of photothermal efficiency of different nanomaterial.
The temperature profiles in Figure (a and c) show that for both samples, the temperature increases at a rate of about 1.1 and 1.3°C per minutes for the DC and MC samples, respectively, upon laser excitation. After 25 min of laser irradiation, the samples reach a steady-state temperature at which point the laser was turned off and the solution was allowed to cool. The maximum temperature change of MC s-SWCNTs was measured at 32.54, 1.2-fold higher than DC s-SWCNTs as seen in Table . The of MC s-SWCNTs was calculated to be 87.94 ± 2.84%, 1.88-fold higher than DC s-SWCNTs (46.86 ± 10.7) %, and significantly higher than other inorganic and organic nanomaterials as appeared in Table under the excitation of 808 nm light. High photothermal conversion efficiencies are better for photothermal therapies since this could potentially translate to shorter treatment times for patients undergoing these therapies.
Now, it is clearly that MC s-SWCNTs have a strong photothermal conversions efficiency more than DC s-SWCNT as seen in Figure . First, Figure (A) shows that the absorption peak of MC at 808 nm determines at 0.124 compared to that 0.085 of DC, which presented 1.57-fold higher than DC. Moreover, the strongest peak of MC determines to be at 880 nm, which is close to the excited wavelength at 808 nm, while the strongest peak of DC is around 980 nm, which is far away from the excited wavelength at 808 nm. Also, since the used samples have different chiral index, it is expected that the thermal properties will be different because the diameters of the samples determine by the chiral index (n,m).
Next, we studied the effect of photothermal stability as verified by reducing the concentration of the solutions as well as by reducing the incoming laser power. Both s-SWCNTs exhibit the same trend: the less concentrated the sample or the less the applied power, the smaller the temperature increase observed. To monitor the heat transfer process, a power metre with an accuracy of ±0.01 W was used to measure the transmitted power. We assume that much of the incident light will be transmitted throughout the solution and absorbed by s-SWCNTs because the samples exhibit a strong absorption near the resonance of the laser. Under this assumption, the experimental results show that 23.3% and 31.2% of the light was absorbed by DC and MC s-SWCNTs, respectively, as expected that MC s-SWCNTs are more than DC s-SWCNTs.
4. Conclusion
Understanding the heating and photothermal conversion efficiency of s-SWCNTs has important implications in many areas of research, especially in biomedical applications. The efficiency with which these nanostructures heat depend on many parameters including chiral structure, location of absorption peaks, excitation wavelength, concentration, and power of the incident light. We experimentally determine the photothermal conversion efficiency and found that this is strongly dependent on the chiral structure of the s-SWCNTs. By studying these parameters and understanding the fundamentals of the responses of s-SWCNTs to NIR light, we can continue to explore these nanomaterials as potential candidates for photothermal therapy.
5. Materials and equipment of synthesizing SWCNTs
Sephacryl S-200 High Resolution (Sephacryl) obtained from GE Healthcare Bio-Sciences AB, (Uppsala, Sweden) lot # 10240334 – 750 mL preparatory grade.
Sodium dodecyl sulphate ≥ 98.5% (SDS) obtained from Sigma Life Science, (St. Louis, MO) lot# SLBM8498V
Carbon nanotubes, single walled enriched in (6,5) chirality (≥95% carbon basis [≥95% as carbon nanotubes]) obtained from Sigma Aldrich (CAS 308068-56-6, mfr. no. Signis® SG65i)
Rod shaped stir bar 7.5 cm × 1 cm employed for the fractionation of Sephacryl at high stir speeds within Pyrex 500 mL Erlenmeyer flask No. 4980, stopper No. 7, stir speed of 150 RPM upon Isotemp ® digital stirring hot plate: ceramic (catologue # 11-300-49SHP) 120v Digital tube revolver obtained from thermo scientific (catalogue #88881001) and employed during the centrifugation/decanting SWNT/gel interaction procedure
120 V 60 Hz Sorvall ST 16 Centrifuge obtained from ThermoFisher Scientific (Catalogue #75004241) and employed for general purpose centrifugation
Sorvall MX 120 Plus Micro-Ultracentrifuge obtained from ThermoFisher Scientific and employed both for treatment and processing of SWNT as well as Sephacryl with S50-A fixed angle rotor
HP Agilent 8453 G1103A spectrometer obtained from Agilent Technologies and employed for spectroscopic analysis of SWNT products post-interaction
Leica DM750 M Binocular Materials Microscope fitted with Leica ICC50 HD Microscope Camera employed for sizing and microscopic analysis of hydrogel samples
Karter Scientific Labware Manufacturing 72pc glass microscope slides and 100 cover slip set, employed for microscopic analysis of samples.
Acknowledgements
This work was a part of my PhD study, and it was supported in part by the BioFrontiers Centre at the University of Colorado Colorado Springs. MA would like to thank Taibah University for funding his scholarship. MA would like to thank Dr. Kevin Tvrdy for providing the CNTs samples and characterized them, and Dr. Kelly McNear for her assistance during preparing the manuscript.
Disclosure statement
The author has no conflict of interest to declear.
References
- Iijima S. Helical microtubules of graphitic carbon. Nature. 1991;354(6348):56–58.
- Iijima S, Ichihashi T. Single-shell carbon nanotubes of 1-nm diameter. Nature. 1993;363(6430):603–605.
- LeMieux MC, Roberts M, Barman S, et al. Self-sorted, aligned nanotube networks for thin-film transistors. Science. 2008;321(5885):101–104.
- Barone PW, Baik S, Heller DA, et al. Near-infrared optical sensors based on single-walled carbon nanotubes. Nat Mater. 2005;4(1):86–92.
- Baughman RH, Cui C, Zakhidov AA, et al. Carbon nanotube actuators. Science. 1999;284(5418).
- Liu Z, Tabakman S, Welsher K, et al. Carbon nanotubes in biology and medicine: In vitro and in vivo detection, imaging and drug delivery. Nano Res. 2009;2(2):85–120.
- Opatkiewicz J, Lemieux MC, Bao Z. Nanotubes on display: How carbon nanotubes can be integrated into electronic displays. ACS Nano. 2010;4(6):2975–2978.
- Ouyang M, Huang JL, Lieber CM. Fundamental electronic properties and applications of single-walled carbon nanotubes. Acc Chem Res. 2002;35(12):1018–1025.
- Odom TW, Huang JL, Kim P, et al. Atomic structure and electronic properties of single-walled carbon nanotubes. Nature. 1998;391(6662):62–64.
- Murakami T, Nakatsuji H, Inada M, et al. Photodynamic and photothermal effects of semiconducting and metallic-enriched single-walled carbon nanotubes. J Am Chem Soc. 2012;134(43):17862–17865.
- De La Zerda A, Zavaleta C, Keren S, et al. Carbon nanotubes as photoacoustic molecular imaging agents in living mice. Nat Nanotechnol. 2008;3(9):557–562.
- Fukuda R, Umeyama T, Tsujimoto M, et al. Sustained photodynamic effect of single chirality-enriched single-walled carbon nanotubes. Carbon. 2020;161:718–725.
- Von Maltzahn G, Centrone A, Park JH, et al. SERS-coded cold nanorods as a multifunctional platform for densely multiplexed near-infrared imaging and photothermal heating. Adv Mater. 2009;21(31):3175–3180.
- Chen H, Shao L, Ming T, et al. Understanding the photothermal conversion efficiency of gold nanocrystals. Small. 2010;6(20):2272–2280.
- Lyu Y, Zeng J, Jiang Y, et al. Enhancing both biodegradability and efficacy of semiconducting polymer nanoparticles for photoacoustic imaging and photothermal therapy. ACS Nano. 2018;12(2):1801–1810.
- Chen Y, Cheng L, Dong Z, et al. Degradable vanadium disulfide nanostructures with unique optical and magnetic functions for cancer theranostics. Angew Chem. 2017;129(42):13171–13176.
- Zhou Z, Sun Y, Shen J, et al. Iron/iron oxide core/shell nanoparticles for magnetic targeting MRI and near-infrared photothermal therapy. Biomaterials. 2014;35(26):7470–7478.
- Yoon HJ, Lee HS, Lim JY, et al. Liposomal indocyanine green for enhanced photothermal therapy. ACS Appl Mater Interfaces. 2017;9(7):5683–5691.
- Geng B, Shen W, Fang F, et al. Enriched graphitic N dopants of carbon dots as F cores mediate photothermal conversion in the NIR-II window with high efficiency. Carbon. 2020;162:220–233.
- Peng X, Wang R, Wang T, et al. Carbon dots/prussian blue satellite/core nanocomposites for optical imaging and photothermal therapy. ACS Appl Mater Interfaces. 2018;10(1):1084–1092.
- Zheng M, Li Y, Liu S, et al. One-Pot to synthesize multifunctional carbon dots for near infrared fluorescence imaging and photothermal cancer therapy. ACS Appl Mater Interfaces. 2016;8(36):23533–23541.
- Lan M, Zhao S, Zhang Z, et al. Two-photon-excited near-infrared emissive carbon dots as multifunctional agents for fluorescence imaging and photothermal therapy. Nano Res. 2017;10(9):3113–3123.
- Maestro LM, Haro-González P, Del Rosal B, et al. Heating efficiency of multi-walled carbon nanotubes in the first and second biological windows. Nanoscale. 2013;5(17):7882–7889.
- Reich S, Thomsen C, Maultzsch J.. Carbon Nanotubes: basic concepts and physical properties. John Wiley & Sons; 2007.
- Naumov AV, Ghosh S, Tsyboulski DA, et al. Analyzing absorption backgrounds in single-walled carbon nanotube spectra. ACS Nano. 2011;5(3):1639–1648.
- Saito R, Fujita M, Dresselhaus G, et al. Electronic structure of graphene tubules based on C60. Phys Rev B. 1992;46(3):1804.
- Kataura H, Kumazawa Y, Maniwa Y, et al. Optical properties of single-wall carbon nanotubes. Synth Met. 1999;103(1-3):2555–2558.
- Sanchez SR, Bachilo SM, Kadria-Vili Y, et al. (N,m)-specific absorption cross sections of single-walled carbon nanotubes measured by variance spectroscopy. Nano Lett. 2016;16(11):6903–6909.
- Jain RM, Howden R, Tvrdy K, et al. Polymer-free near-infrared photovoltaics with single chirality (6,5) semiconducting carbon nanotube active layers. Adv Mater. 2012;24(32):4436–4439.
- Watts BP, Barbee CH, Tvrdy K. Exploiting the physiochemical interactions between single-walled carbon nanotubes and hydrogel microspheres to afford chirally pure nanotubes. ACS Appl Nano Mater. 2019;2(6):3615–3625.
- Dolan M, Watts BP, Tvrdy K. Tailored synthesis of hydrogel media for chirality separation of single walled carbon nanotubes. Carbon. 2021;171:597–609.
- Alrahili M, Peroor R, Savchuk V, et al. Morphology dependence in photothermal heating of gold nanomaterials with near-infrared laser. J Phys Chem C. 2020;124(8):4755–4763.
- Jiang K, Smith DA, Pinchuk A. Size-dependent photothermal conversion efficiencies of plasmonically heated gold nanoparticles. J Phys Chem C. 2013;117(51):27073–27080.
- Lv R. Integration of upconversion nanoparticles and ultrathin black phosphorus for efficient photodynamic theranostics under 808 nm near-infrared light irradiation. Chem Mater. 2016;28(13):4724–4734.
- Sinha S, et al. Off-axis thermal properties of carbon nanotube films. J Nanoparticle Res. 2005;7(6):651–657.