
 ?Mathematical formulae have been encoded as MathML and are displayed in this HTML version using MathJax in order to improve their display. Uncheck the box to turn MathJax off. This feature requires Javascript. Click on a formula to zoom.
ABSTRACT
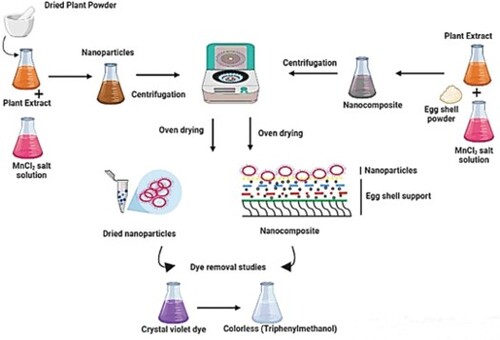
This study reported the biological synthesis of MnO2 nanoparticles and MnO2@eggshell nanocomposite. Optimum conditions for the biosynthesis of MnO2 NPs were observed for 0.025 M MnCl2 solution with 1.0% (m/v) of plant powder (Ocimum basilicum) content-based extract under basic pH conditions. Afterwards, nanocomposite (NC) was prepared by fabricating manganese-based nanoparticles on waste eggshell powder. Different techniques were applied for characterization of prepared materials. Synthesized NPs and NCs were further utilized for the adsorption studies of crystal violet dye. Studies were conducted to delineate the effect of dye concentration, prepared material dosage, pH, temperature and contact time. In the end, adsorption isotherms and thermodynamic studies were applied to the data. The Langmuir model better fits the data in both the cases and predicted adsorption capacity of 149.254 and 52.6 mg/g for NC and NPs, respectively. The possible mechanism of the dye removal process, nanoparticle and nanocomposite formation has also been discussed.
GRAPHICAL ABSTRACT
Novelty statement
In this study, the sorption efficiency of nanoparticles and nanocomposite was compared.
Initially, different parameters were optimized for the synthesis of manganese nanoparticles.
Then the synthesis of nanocomposite was performed using a manganese salt solution, eggshell powder and plant extract.
Various experimental factors were studied during the removal studies of crystal violet dye. Later adsorption isotherm and thermodynamic studies were applied to understand the underlying adsorption mechanism.
Mechanism related to the dye removal process, along with nanoparticles and nanocomposite formation, was also included in the study.
1. Introduction
Industries, such as paper and pulp manufacturing, dyeing of cloth, textile, leather treatment and printing, employ chemically synthesized dyes for a variety of processes. Effluent from these industries bears huge volumes of coloured wastewater. It has been estimated that 1,00,000 synthetic dyes are consumed annually for diverse industrial operations and 50% ultimately became part of industrial effluent due to poor fixation issues of dye molecules [Citation1–3].
Crystal violet (CV) is a cationic dye and appears as a dark green shiny crystal [Citation4]. It is widely used in printing and dying paper and fibres (silk, wool, leather jackets, jute and cotton) [Citation5]. It is also used as medicine in the dermatological field [Citation6,Citation7]. It is used in the manufacturing of printing ink, fertilizer and detergents [Citation8]. It is mixed in poultry feed as an additive to reduce the growth of fungus, bacteria and intestinal parasites [Citation9]. It is used as an alternative to fluorescent dye to stain DNA samples during the gel electrophoresis procedure and is also used to forensically trace fingerprints [Citation10]. Non-biodegradable nature of CV dye makes it highly toxic for humans and animals. Due to its cationic nature, it binds with negatively charged receptors on the cell and can cause the death of a cell. It acts as a mutagenic agent to induce cancer [Citation5]. This cationic dye has a strong clastogenic and carcinogenic potential which is responsible for stimulating cancers in aquatic animals [Citation4]. CV dye being basic is well reported for its mutagenic, teratogenic and mitotic poisoning nature. Its consumption in small amounts (less than 1 mg/L) can cause severe biohazards such as irritation of respiratory, wheezing, roughness and shortness of breath [Citation11]. Colour intensity of crystal violet is high which makes it visible even in low concentrations. Such a colour blocks the penetration of sunlight and disturbs the aquatic ecosystem [Citation10].
Intensive efforts have been reported for the facile and effective treatment of dye-containing water resources, including adsorption, membrane filtration, precipitation, chemical oxidation and electrochemical treatment. Compared to other methodologies, the adsorption technique has been very much considered due to its simplicity, low cost and facile approach. Nanosorbents have gained the highest popularity due to their large surface area, porous structure and efficient adsorption capacity [Citation12,Citation13]. Metal oxide nanoparticles are particularly renowned in chemistry and environmental science due to their unique physical and chemical characteristics. Manganese oxide exhibits a catalytic role in the oxidation of H2O, C2H4, CH4, NOX, CO, alkyl benzene and olefins [Citation14]. It has also been used as an electrode material for rechargeable Li-batteries, magnetic cores of transformers and ion exchangers [Citation15]. In the literature, Mn oxide NPs have been successfully utilized for the removal studies of toxic metals such as Pb, Cu, Zn, As, Mo, Co, Ti, Cs, Sr and contaminants such as methylene blue, methyl orange, humic acid and volatile organic compounds from water [Citation16,Citation17]. Nowadays, it is preferred to load nanoparticles on some solid support. In addition to the enhancement of adsorption efficiency, it also smoothens the recovery of nanosorbent material. In this study manganese dioxide nanoparticles and manganese dioxide supported on waste eggshells are prepared using leaf extract of Ocimum basilicum. Eggshell is the most abundant biodegradable, and reusable waste material. The major chemical composition of eggshells is inorganic in nature. It is composed of CaCO3 (94%) MgCO3 (1%) and Ca3(PO4)2 (5%) submerged in organic matrix (3%) of protein and polysaccharides [Citation18,Citation19]. Eggshell contains different layers and micropores of variable size and shape which provide a framework for intercalation and exchange of materials. To date, Ocimum basilicum leaf extracts-based synthesis of manganese dioxide nanoparticles and their fabrication on eggshell support has not been reported in the literature.
Initially, various factors are studied during the biogenic synthesis of manganese dioxide nanoparticles to optimize their yield. Then nanocomposite is fabricated under the best-operating conditions. In the end, the catalytic activity of prepared materials is compared by performing various experimental parameters on a standard solution of crystal violet dye.
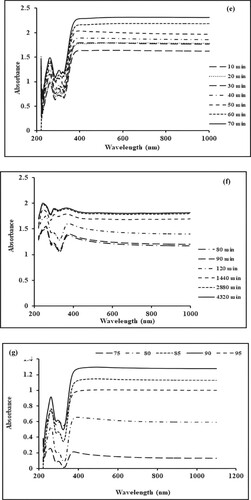
Due to its eco-friendly nature, plant-mediated synthesis of nanoparticles is preferred over physical and chemical methods [Citation20,Citation21]. Here in this study, leaf extracts of Ocimum basilicum, commonly known as sweet basil, niazboo, holy basil, babui tulsi, nasabo or sabje, is employed [Citation22]. It is a culinary, ornamental, annual or perennial herb abundantly grown in tropical regions of Asia, Central America, South America and Africa. Basically, it belongs to a group of aromatic and medicinal plants. Different monoterpenes (forty-three), aromatic components (fourteen), sesquiterpenes (sixteen), aldehydes (three), alcohols (seven), ketones and esters (four) and acids (three) have been reported in Ocimum basilicum. Among these, thymol, 4-allylphenol, eugenol and carvacrol (isothymol) are known to exhibit antioxidant potential [Citation23,Citation24]. Aqueous leaf extracts of Ocimum basilicum contain three phytochemicals i.e. saponins, cardiac glycosides and tannins in major proportions [Citation25].
2. Experimental
2.1. Chemicals and reagents
All the chemicals and reagents used in this study were of analytical grade and were used as received without any purification step. Manganese chloride anhydrous (MnCl2), hydrochloric acid (HCl), sodium hydroxide (NaOH), ethanol (C2H5OH) and crystal violet dye (C25N3H30Cl) were purchased from Merck with ≥ 99.9% purity.
2.2. Collection of plant leaves
Leaves of Ocimum basilicum (Niazboo) were collected from Government College Women University Sialkot from September to October. Collected leaves were thoroughly washed to remove the dirt and unwanted particles and shade-dried for a week. These are then groun into fine powder using a mixer grinder (Moulinex, Japan) and stored in an airtight plastic jar.
2.3. Preparation of solid support
Waste white eggshells were collected from the cafeteria of Government College Women University, Sialkot. Firstly, these were washed with tap water and the membranes were removed manually. Later these were dried under shade conditions for two days and ground to a fine powder. To avoid the uneven particle size issue, the powder of white eggshells was sieved through mousse cloth and stored in airtight container, containing a silica bag to remove moisture content, as water can easily occupy the pores of shell powder and thus could impact the catalytic activity.
2.4. Preparation of plant extract
The plant extract was prepared by the reported protocol with slight modification [Citation26]. A definite amount of dried plant was taken in a fixed volume of distilled water and kept on continuous stirring at 70°C for 60 min. After 60 min, the extract was filtered twice using a Whatman No. 1 filter paper. The prepared extract was stored in a bottle at 4°C for further usage.
2.5. Preparation of metallic nanoparticles
Metallic NPs were prepared by the reported protocol [Citation27] with a few modifications. Briefly, 90 mL of plant extract was mixed with 10 mL of precursor salt solution at 80°C under constant stirring conditions. The extract was clear before the addition of the salt solution. As the salt solution was added, the extract became turbid. With the passage of time, the solution becomes dark brown, indicating the formation of metallic NPs. Later it was confirmed using a UV-Visible spectrophotometer (Specord 210 plus Analytic Jena, Germany). After 24 h, nanoparticles were collected through centrifugation at 6500 rpm for 15 min. Collected nanoparticles were washed twice with distilled water and ethanol on an alternate basis for the removal of soluble impurities. Finally, these were dried at 80°C in a hot air oven.
2.6. Effect of experimental parameters on the synthesis of metallic nanoparticles
In a typical experiment, 10 mL of metal ion solution with definite pH (5-9) and concentration (0.00625 M to 0.1 M) value was mixed with 90 mL of leaf extract (0.5% to 1.5%) maintained at temperature from 75°C to 95°C conditions for a defined period (0–1440 min) under continuous stirring conditions. After cooling the solution, its absorbance was noted through a spectrophotometer by taking extract as reference.
2.7. Preparation of nanocomposite
Fabrication of nanocomposite was carried out by the reported method with substantial modifications [Citation28]. In a typical experiment, a definite amount of powdered eggshell and manganese chloride salt was mixed with a fixed volume of plant extract. This resulting mixture was heated at 70°C with continuous stirring for a defined period until the colour change indicates the formation of the nanocomposite. After twenty-four hours, the reaction mixture was centrifuged at 6500 rpm for 15 min. Nanocomposite material was collected by centrifuging the resulting suspension with distilled water and ethanol thrice. Later it was dried in a hot air oven at 80°C. Dried NCs were preserved in Eppendorf tubes for future purposes.
2.8. Characterization of metallic nanoparticles and nanocomposite
Prepared materials were characterized by UV-Visible spectroscopy (Specord 210 plus Analytic Jena, Germany) within the wavelength range of 200 nm to 500 nm. Fourier transform infrared (FTIR) spectroscopic (Thermo Nicolat 6700, U.S) analysis was carried out within the wavenumber range of 4000 cm−1–500 cm−1. X-ray diffraction (JEOL JDX-3623, Japan) analysis was performed with CuKα (wavelength = 1.5418 Å) radiation from 2θ values of 10° to 80° with applied current and voltage range of 2.5-30 mA and 20-40 kV, respectively. SEM with EDX analysis (Tescan Vega3, Czechia) was performed at scale levels of 20 µm, 2 µm, 1 µm and 500 nm with the magnification of 1000×, 10,000× and 50,000×. ImageJ software was applied to calculate crystallite size from 2D SEM images.
2.9. Batch adsorption studies
Crystal violet dye (100 mg) was taken in a 1000 mL measuring flask and diluted with the distilled water till marked. This was a 100 mg/L stock solution. Standard solutions of different concentrations were prepared from the stock solution (100 mg/L) by dilution with distilled water. All the operational conditions were optimized using manganese dioxide NPs and manganese dioxide/eggshell composite. In a typical experiment, a fixed amount of NPs or NC (5–30 mg) was added to 25 mL of dye solution with varying concentrations (5–25 mg/L) and pH values (2–10) for a defined period (0–1440 min) at constant temperature conditions (20–80°C). Solutions were then centrifuged at 6500 rpm for 15 min and the supernatant was separated to examine its absorbance through a spectrophotometer at λmax value of 591 nm. The effect of ionic strength was studied by adding a fixed volume of NaCl solution with varying concentrations (0.01–0.06 mol/L) to 25 mL of dye solution. The dye percentage removal value was calculated by the following formula:
(1)
(1)
All the experiments were performed in triplicate sets and mean values along with standard deviation were taken for data analysis.
3. Results and discussion
3.1. Effect of experimental parameters on the synthesis of metallic nanoparticles
Metallic nanoparticles were prepared by reducing anhydrous MnCl2 with aqueous leaf extract of Ocimum basilicum. Different conditions, such as precursor salt concentration, plant concentration, pH, time and temperature, were studied to optimize the time required for the synthesis and yield of NPs. UV Visible absorption maxima, peak intensity, peak shift and peak broadening were employed as indicators to highlight the effect of these parameters on the morphology and size of Mn dioxide NPs [Citation29].
To evaluate the effect of MnCl2 concentration on the biosynthesis of Mn dioxide NPs, different concentrations of metal ion solution are studied by keeping other experimental conditions constant. The results are depicted in Figure a. It is clear from the graph that the synthesis is highly dependent on the concentration of precursor salt. With 0.025 M concentration, a narrow and sharp intense peak is observed at 260 nm, which illustrates the narrow size distribution of NPs. At higher concentration values (0.05 and 0.1 M), the broad and flat peak is observed which shows the wider size distribution of NPs. Thus, 0.025 M MnCl2 concentration is considered the optimum amount for further synthesis [Citation30].
Figure 1. (a) Effect of precursor concentration on the biogenic synthesis of Mn dioxide NPs. (b) Effect of plant concentration on the biogenic synthesis of Mn dioxide NPs. (c) Effect of pH on the biogenic synthesis of Mn dioxide NPs. (d–f) Effect of nucleation time on the biogenic synthesis of Mn dioxide NPs. (g) Effect of temperature on the biogenic synthesis of Mn dioxide NPs.
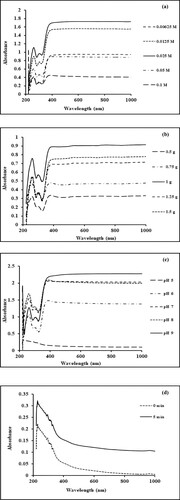
The effect of plant material concentration is studied by changing the amount of dried leaf powder from 0.5 g to 1.5 g. The results are illustrated in Figure b. It can be inferred from Figure b that an increase in the concentration of plant extracts enhanced the formation of Mn dioxide NPs. Maximum absorption intensity with a sharp peak is observed for 1.0 g of dried plant powder content. In the case of a higher concentration, the absorption intensity decreased favouring the formation of a broader peak which inferred the increase in NP’s size. Thus, 1.0 g is the optimized amount of plant-dried powder for the preparation of aqueous extract [Citation31].
pH shows a prominent effect on the production and morphology of metal nanoparticles. This factor is studied by adjusting the pH conditions of the mixture from 5 to 9. The results are represented in Figure c. It is observed that high and mildly acidic conditions do not favour the formation of the material. The formation of NPs is enhanced under alkaline conditions and maximum absorbance is obtained at a pH value of 8. Further increase in pH values decreased the absorbance due to agglomeration favouring enlarged nanoparticle size [Citation32].
Nucleation time controls the morphology and size of metallic nanoparticles. The effect of nucleation time on the biogenic synthesis of metallic nanoparticles is depicted in Figure d–f. The peak at 260 nm corresponds to the surface plasmonic resonance phenomenon and gradually becomes intense as a function of time without any shift in the peak position. Initially, (Figure d) a slow increase is observed (0–5 min), while a drastic increase is observed from period of 10 to 70 min (Figure e). This increase in absorbance value is recorded up to 70 min. After this, the SPR peak seems to be broadened and shifted (Figure f). This depicts that increased nucleation time supports the agglomeration of nanoparticles. The optimum nucleation time is 70 min for further studies [Citation33]. The effect of temperature on the green synthesis of Mn dioxide NPs is studied by varying the temperature conditions of the mixture from 75°C to 95°C. Absorption spectra at different temperatures are shown in Figure g. These spectra clearly depict that higher temperature conditions (up to 90°C) favour the formation of Mn dioxide NPs. A further increase in temperature supports the agglomeration of nanoparticles leading to decreased absorbance values. Maximum absorbance is observed at 90°C which is considered as optimum value for further experimental work [Citation34].
3.2. Possible mechanism leading to the formation of nanoparticles and nanocomposite
The possible mechanism of nanoparticles and nanocomposite formation is shown in Scheme 1 and Scheme 2, respectively. In the case of metallic nanoparticles (Scheme 1), initially, metal precursors are reduced by the phytochemicals (Step I). Oxygen either from the atmosphere or degrading phytochemicals will bind to the reduced metal ions (Step II). Metal oxide ions will bind to each other through electrostatic interaction and begin the growth of nanoparticles (Step III). In the end, stabilization occurs through the capping of synthesized nanoparticles (Step IV) [Citation35] (Scheme 1).
Scheme 1. Possible mechanism of MnO2 nanoparticle formation.
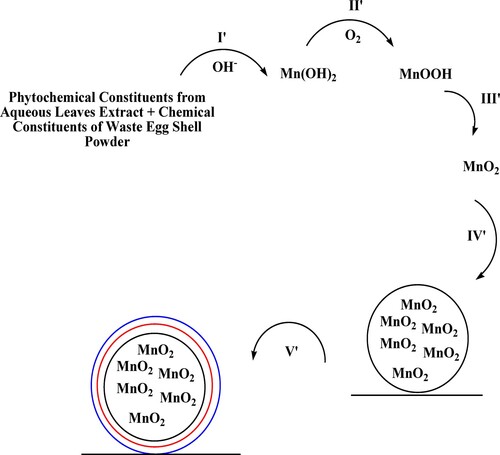
Scheme 2. Possible mechanism of MnO2@waste eggshell nanocomposite formation.
Scheme 3. Possible mechanism of dye removal procedure by MnO2 nanoparticles and MnO2@waste eggshell nanocomposite.
Scheme 2 represents the possible mechanism of nanocomposite formation. Due to the basic nature of eggshell, it provides the alkaline medium and forms Ca(OH)2 on its surface. This oxidizes metal ions into Mn(OH)2 (Step I’) and atmospheric oxygen further converts it into MnOOH (Step II’). The combination of Mn(OH)2 and MnOOH favours the formation of MnO2 on the porous structure of eggshell (Step III’–V’) [Citation36].
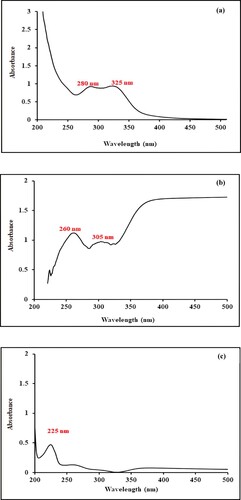
Figure 2. (a) UV-visible spectrum of aqueous leaf extract of Ocimum basilicum. (b) UV-Visible Spectrum of Mn dioxide NPs. (c) UV-visible spectrum of fabricated Mn oxide/eggshell as NC.
3.3. Characterization studies
3.3.1. UV visible spectral analysis
Optical properties of aqueous leaf extract, metallic nanoparticles and nanocomposite are monitored using a UV/visible spectrophotometer in the wavelength range of 200–500 nm. Figure a depicts the UV visible spectrum of aqueous leaf extract within the range of 200–500 nm. This plant extract is enriched in the primary and secondary metabolites which play a basic role in the reduction and stabilization process. Spectrum depicts peaks at 280 and 325 nm that elaborate the existence of saponin and tannin phytochemicals, as already reported in previous studies [Citation37].
The UV-visible spectrum of metallic nanoparticles is shown in Figure b. It exhibits an absorption peak at 260 and 305 nm which is in accordance with the earlier reported data [Citation38]. Peaks in these regions represent π- π*, n- π* or d-d electronic transitions. Furthermore, Figure b illustrates ligand-to-metal charge transfer transitions in far ultraviolet and near visible regions, which is a characteristic feature of Mn (IV) supporting the formation of MnO2 nanoparticles. In this study, metallic nanoparticles are formed as a result of biogenic reduction using leaf extract of Ocimum basilicum. The intensity of absorption directly correlates with the concentration of Mn dioxide NPs. During the synthesis, the visual colour changes from pale yellow to reddish brown. With the passage of time, increased colour intensity indicates an enhanced reduction of metal ions [Citation39].
In situ synthesis of manganese dioxide nanoparticles on eggshell is carried out by the eco-friendly green method using aqueous leaf extract of Ocimum basilicum as a reducing and capping agent. Synthesis of bionanocomposite is monitored by a UV-visible spectrophotometer and presented in Figure c. In comparison to the spectrum of metal dioxide nanoparticles, here SPR peak has been shifted to 225 nm depicting a hypsochromic shift and clearly indicating the loading of Mn dioxide NPs on eggshell solid support [Citation28].
3.3.2. FTIR spectra analysis
FTIR spectrum of Ocimum basilicum leaf extract is shown in Figure a. The broad and strong band at 3270.88 cm−1 is assigned to stretching vibrations of the hydrogen-bonded -OH group present in the alcoholic and phenolic functional moiety. Percent transmittance peaks at 2918.86 and 2850.93 cm−1 arise due to in-plane stretching of the –CH (sp2 and sp3) bond. While peaks at 1732.37 and 1601.09 cm−1 connote -C=O group stretching vibration in the aldehydic and amide group, respectively. The peak at 1316.20 cm−1 represents −C–H bending vibrations in alkanes. Peaks at 1238.02 cm−1 indicate the −C–O stretching vibration of lignin structure and peaks at 1012.07 cm−1 correspond to the stretching vibrations of the –C–O-C group in cellulose structure [Citation40–43].
Figure 3. (a) FTIR Spectrum of Ocimum basilicum leaves extract. (b) FTIR Spectrum of biogenic synthesized Mn dioxide NPs. (c) FTIR Spectrum of eggshell. (d) FTIR Spectrum of nanocomposite.
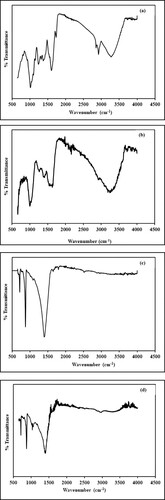
Figure b represents the spectrum of green synthesized Mn dioxide NPs. In comparison to the above spectrum, peaks at 2918.86, 2850.93 and 1732.37 cm−1 disappeared. Furthermore, peaks in spectrum of plant extract at 3270.88, 1601.09, 1238.02, 1012.07 cm−1 are shifted to 3239.98, 1630.22, 1266.69 and 1001.09 cm−1, respectively. The intensity of these bands has been observed to reduce as compared to the control spectrum. Bands in the range of 400–800 cm−1 can be related to Mn-O lattice vibrational mode [Citation44]. New peaks at 851.79, 822.03, 788.06, 760.81 and 747.64 cm−1 are associated with M = O (stretching), Mn-O (stretching) and M-O-H (bending) vibrational modes [Citation45–47].
Figure c represents the infrared spectrum of chicken white eggshell powder. The spectrum depicts peaks at 3735.84, 1396.43, 851.75 and 711.46 cm−1, respectively. The peak at 1396.43 cm−1 represents ions present in the CaCO3 matrix of eggshell. Two significant peaks at 851.75 and 711.46 cm−1 illustrate the characteristic in-plane and out-plane deformation of
ions. The band at 3735.84 cm−1 is due to the stretching vibration of the -OH group present in calcium hydroxide probably formed during the adsorption of water molecules on the surface of the eggshell [Citation48–50].
Figure d represents the infrared spectrum of nanocomposite. Peaks at 1393.3, 871.7 and 712.2 cm−1 represent carbonate ions. There is a small shift in these values as compared to the bare eggshell spectrum. This clearly elucidates the fact that the porous framework of eggshell is retained after fabrication. Bands at 1033.4 cm−1 and 1056.9 cm−1 represent C–O–M bond [Citation28,Citation51].
3.3.3. XRD analysis
Figure a,b represents the XRD spectra of Mn dioxide NPs and Mn dioxide/eggshell nanocomposite, respectively. Figure a depicts sharp peaks at 31.84 and 43.29° corresponding to crystal planes of (300) and (301) of MnO2 in accordance with reported data (JCPDS card PDF File no 44-0141) [Citation50,Citation51]. XRD spectrum of nanocomposite exhibits sharp peaks at 29.5° which is the characteristic peak of calcium carbonate present in eggshells [Citation28]. Other peaks at 31.65, 36.11, 43.28, 48.64, 60.81, 65.83 and 70.44 o represent crystal planes values (300), (400), (301), (411), (521), (002) and (741) of MnO2 [Citation52–55], respectively.
Figure 4. (a) XRD Spectrum of Mn dioxide NPs. (b) XRD Spectrum of nanocomposite.
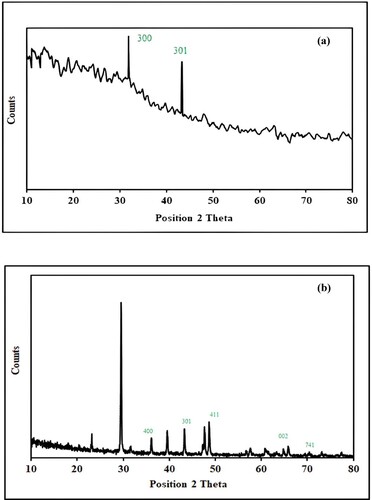
The average crystallite size calculated from XRD data analysis for metallic nanoparticles and nanocomposite is 59.46 and 32 nm, respectively. This confirms that the chances of NP aggregation had been reduced by fabrication on the solid support.
3.3.4. SEM analysis
The surface morphology of biosynthesized nanoparticles is evaluated by scanning electron microscopic images at a magnification of 1000×, 10,000× and 50,000× with scale levels of 20 µm, 2 µm and 500 nm (Figure a–c). The shape of Mn dioxide NPs is roughly spherical. SEM data analysis predicted an average size value of 56 nm. This value closely matches the previously reported studies and above-mentioned XRD data analysis [Citation27,Citation56,Citation57].
Figure 5. (a–c) SEM images of biosynthesized Mn dioxide NPs. (d–f) SEM images of fabricated Mn dioxide/eggshell NC.
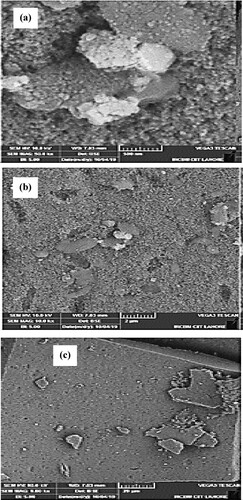
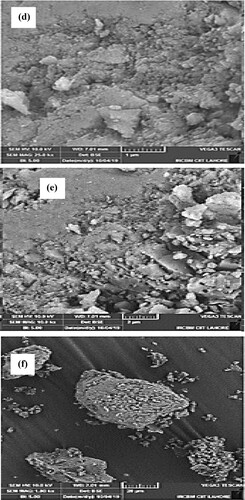
Figure d–f illustrates the SEM images of fabricated Mn dioxide/eggshell nanocomposite with the magnification of 1000×, 10,000× and 50,000× at scale levels of 20 µm, 2 µm and 1 µm. The shape of Mn dioxide/eggshell NCs is more spherical than Mn dioxide NPs. SEM images data analysis estimated average size of 32 nm for nanocomposite. This value is in close agreement with the above-mentioned value calculated by the Debye-Scherrer equation. Furthermore, these images display dark black spots on a white eggshell solid support. This confirms the fabrication of Mn dioxide NPs on eggshells as nanocomposite. A decrease in NCs size also assures that aggregation has been reduced which can contribute to the catalytic activity of the prepared material.
3.3.5. EDX analysis
EDX spectrum of Mn dioxide NPs is shown in Figure a. It shows oxygen and manganese with a percentage value of 41.63% and 58.37%, respectively [Citation55]. It depicts a peak at 0.2688 keV representing Mn-O linkage. Manganese and oxygen elemental peaks confirm the formation of Mn dioxide NPs. These characteristics of EDX match with earlier research work [Citation58–60].
Figure 6. (a) EDX spectrum of biosynthesized Mn dioxide NPs. (b) EDX spectrum of biosynthesized Mn dioxide NPs/eggshell NC.
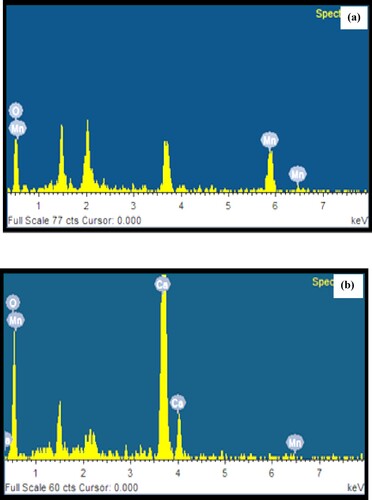
EDX spectrum of Mn dioxide NPs fabricated on eggshell solid support as nanocomposite is shown in Figure b. It depicts elemental peaks for oxygen (45.93%), carbon (30.27%), calcium (23.78%) and manganese (0.03%). These data confirm the fabrication of Mn dioxide NPs on eggshell as nanocomposite. In nanocomposite, the manganese content percentage is quite low probably due to the incorporation of manganese dioxide nanoparticles in the inner porous framework of eggshell support.
3.4. Dye removal studies
3.4.1. Effect of dye concentration
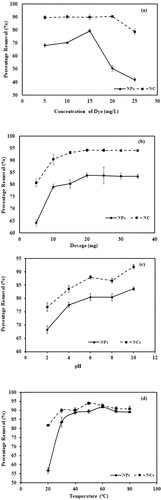
Figure a shows the effect of crystal violet dye concentration on the sorption capacity of NPs and NCs. In the case of metallic nanoparticles, the value of percentage removal increases from 68.2% to 79.46% as the concentration increases from 5 to 15 mg/L. An increase in initial dye concentration enhances the interaction between the dye and respective composite. In other words, a high dye concentration value increases the driving force to overcome the resistance caused by the mass transfer of dye molecules from the solution to the surface of the adsorbent. While the decrease in percentage removal is observed at higher concentration values of 20 mg/L (50.56%) and 25 mg/L (41.84%). The maximum removal of dye occurred at 15 mg/L (79.46%) and 20 mg/L (90.52%) for Mn dioxide NPs and Mn dioxide/eggshell NCs, respectively. At higher concentration levels of dye, no increase in dye removal is observed due to the saturation of binding sites [Citation61].
Figure 7. (a) Comparative graph showing the effect of dye concentration for the removal of crystal violet dye by Mn dioxide NPs and Mn dioxide/eggshell NC. (b) Comparative graph showing the effect of adsorbent dosage for removal of crystal violet dye by Mn dioxide NPs and Mn dioxide/eggshell NC. (c) Comparative graph showing the effect of pH for the removal of crystal violet dye by Mn dioxide NPs and Mn dioxide/eggshell NC. (d) Comparative graph showing the effect of temperature for the removal of crystal violet dye by Mn dioxide NPs and Mn dioxide/eggshell NC. (e) Comparative graph showing the effect of time for removal of crystal violet dye by Mn dioxide NPs and Mn dioxide/eggshell NC. (f) Comparative graph showing effect of ionic strength for removal of crystal violet dye by Mn dioxide NPs and Mn dioxide/eggshell NC. (g) Regeneration studies for removal of crystal violet dye by Mn dioxide NPs. (h) Regeneration studies for removal of crystal violet dye by Mn dioxide/eggshell NC.
3.4.2. Effect of adsorbent amount
Figure b shows the effect of the adsorbent dose on the removal of CV dye by Mn dioxide NPs and Mn dioxide/eggshell NCs. In the case of NPs, an increase in percentage removal value is observed from 64.23% to 83.74% as the nanoparticle dosage is increased from 5 to 20 mg. With a further increase of dosage amount from 20 to 35 mg, the removal percentage value remains constant. On the other hand, as the amount of NCs increased from 5 to 20 mg, the percentage removal value increases from 80.69% to 94.18% and remains constant at higher dosage values. In both cases, the initial increase in the concentration of adsorbent favours the removal of dye. After a certain amount, adsorption-desorption equilibrium is observed to be maintained. Thus, the percentage removal value seems to be unaffected at higher concentration values [Citation62].
3.4.3. Effect of pH
Figure c shows the effect of pH on the removal of CV dye by Mn dioxide NPs and Mn dioxide/eggshell NCs. This parameter is studied within the range of 2–10 pH values as dye became colourless under higher pH (11) conditions [Citation63].
Surface properties are highly dependent on pH conditions. In both cases, maximum dye removal is observed at a pH value of 10. Although NC manifests high percentage removal value (91.90%) than Mn dioxide NPs (83.59%) under the same pH (10) conditions. At higher pH values, the surface carries a negative charge due to the deprotonation of phytochemical constituents that are being attached as stabilizers and capping agents hence facilitating the binding of cationic dye molecules.
3.4.4. Effect of temperature
Figure d shows the effect of temperature on the removal of CV dye by Mn dioxide NPs and Mn dioxide/eggshell NCs. In the case of NPs, percentage removal increases from 56.67% to 91.76% with an increase in temperature from 20°C to 60°C, while NCs display a rise in dye removal percentage from 81.70% to 93.89% within the temperature range of 20–50°C. Further increase in temperature decreases the removal process in both cases. This is because higher temperature favours rapid movement and consequently, dye molecules escape from the solid to liquid phase, thus enhancing the desorption process.
The thermodynamic parameters of these adsorption experiments are calculated using the following equations:
(2)
(2)
(3)
(3)
(4)
(4)
(5)
(5)
where ΔG° is the change in Gibb’s free energy (kJ/mol), ΔH° is the change in enthalpy (kJ/mol), ΔS° is the entropy change (J/mol/k), R is the general gas constant (J/mol/k), Ke is the equilibrium constant and T represents temperature conditions. Values of ΔS° and ΔH° are calculated from the graph plotted between ln Ke and 1/T (Figure e). All these values for NPs and NCs are given in Table . In both cases, negative values of ΔG° predict a spontaneous process. Positive values of ΔH° illustrate that both the adsorbent exhibit an endothermic process. Positive values of entropy indicate increased randomness at the solution/adsorbate interface [Citation10,Citation64,Citation65].
Table 1. Thermodynamic parameters calculated for CV dye removal by Mn dioxide NPs and Mn dioxide/eggshell NC.
3.4.5. Effect of contact time
Figure f shows the effect of contact time for the removal of CV dye by both types of adsorbents. With NPs, in the first 210 min of contact time, the percentage removal value surges from 28.16% to 80.30%. While NCs achieved efficient removal percentage within 120 min of contact time and afterwards minimal increment is observed. This is in agreement with the previously reported literature [Citation64]. There is a rapid increase in the removal process during the earlier stages because abundant binding sites probably on the outer surfaces are easily accessible followed by molecular diffusion towards the less accessible sites. Eventually, dynamic equilibrium is established as all the sites have been occupied.
With respect to the optimization of experimental parameters, it can be concluded that NCs display better catalytic activity than NPs. Besides thermal stability, low density and composition phase continuity, waste eggshell powder had a large number of binding sites that could favour the stabilization of nanoparticles. This, in turn, prevents aggregation, maintains a smaller size and facilitates dispersion. Thus, eggshell powder served as an excellent host for the accommodation of metallic nanoparticles [Citation36].
3.4.6. Effect of ionic strength
The effect of ionic strength is presented in Figure f. In both cases, an increase is observed as the concentration of NaCl is increased from 0.01 mol/L to 0.06 mol/L. This increment is more pronounced in the case of nanoparticles. This is because the addition of salts reduces the charge of the particle’s surface and compresses the electrical double layer, thereby facilitating the motion of dye molecules. In addition, an electric field around inorganic ions might lead to the development of electrostatic interaction with water molecules. This leads to a reduction in the number of free water molecules that could possibly hinder the movement of dye molecules [Citation66].
3.4.7. Regeneration studies
The regeneration of material utilized during adsorption studies is an important parameter to be considered. Desorption of crystal violet dye is carried out with absolute ethanol, 0.01 M HCl and distilled water for three consecutive cycles. Data are presented in Figure g,h for NPs and NC, respectively. It can be seen that in both cases, absolute ethanol showed better and more satisfactory results than 0.01 M HCl and distilled water. It has been reported in the literature that ethanol as a regenerating medium reduces the tensile stress of aqueous solution and facilitates the desorption of electron-deficient adsorbed substituents [Citation67]. Overall NC depicts better ethanol regeneration efficiency than NPs.
3.5. Adsorption isotherms
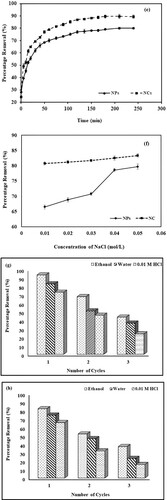
Using optimized conditions, isothermal studies are carried out. Langmuir and Freundlich models (Figure a–d) are applied and their respective parameters are calculated and presented in Tables and .
Figure 8. (a) Plot of Langmuir isotherm for Mn dioxide NPs. (b) Plot of Langmuir isotherm for Mn dioxide/eggshell NC. (c) Plot of Freundlich isotherm for Mn dioxide NPs. (d) Plot of Freundlich isotherm for Mn dioxide/eggshell NC.
Table 2. Langmuir isothermal parameters for the removal of crystal violet dye by Mn dioxide NPs and Mn dioxide/eggshell NC.
Table 3. Freundlich isothermal parameters for the removal of crystal violet dye by Mn dioxide NPs and Mn dioxide/eggshells NC.
The linear form of the Langmuir isotherm model is expressed in Equation (6)
(6)
(6)
where x/m is the total quantity of adsorbate adsorbed per unit weight of adsorbent at equilibrium (mg/g), Ce represents the concentration of dye in the equilibrium solution (mg/L), KL is the adsorption equilibrium constant (L/mg) and Vm is the maximum adsorption capacity of the adsorbent (mg/g). Langmuir isotherm can be explained in the form of a dimensionless constant separation factor (RL). RL can be presented as follows:
(7)
(7)
where C̣ is the initial dye concentration in mg/L. RL values recognize isotherm type, RL = 0 means irreversible nature, RL = 1 indicates the linearity, RL > 1 states unfavourable process and (0 < RL < 1) represent the favourable state.
The linear form of the Freundlich isotherm model is given below:
(8)
(8)
where the Freundlich constant is KF describing the efficiency of an adsorbent, n is a constant describing the adsorption intensity.
The results illustrate that the Langmuir model is more applicable to the adsorption study of crystal violet dye by Mn dioxide NPs and Mn dioxide/eggshell NCs because its correlation coefficient value is higher in both cases. It indicates a monolayer chemisorption process on homogenously distributed binding sites of adsorbent [Citation60]. Maximum adsorption capacity (qm) for crystal violet dye is 52.63 mg/g and 149.25 mg/g using Mn dioxide NPs and Mn dioxide/eggshell NCs. In both cases, the RL value is calculated to be less than unity representing the favourable nature of adsorption in both processes [Citation10]
In the case of Freundlich adsorption isotherm, KF represents the intensity of adsorption and nanocomposite depicts a higher value of KF than nanoparticles showing greater interaction of dye molecules with prepared nanocomposite material. On the other hand, nanoparticles exhibit a larger value of n than nanocomposite further elaborating decreased dye-nanoparticles interaction in this case [Citation5].
3.6. Possible mechanism regarding removal of dye molecules
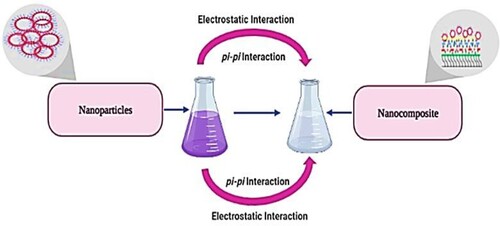
Adsorption of CV dye on NPs and NC depends upon many factors. As discussed earlier, both adsorbents showed optimum response under higher pH conditions. Functional groups present as capping agents on the surface of nanosorbent deprotonates under basic conditions and acquire negative charges. On the other hand, crystal violet dye carries positive charges. This facilitates electrostatic interaction between the adsorbents and dye molecules. Furthermore, CV belongs to the triaryl methane category of dyes and can establish π- π interaction with aromatic functional moieties of prepared materials (Scheme 3) [Citation68].
3.7. Comparison with other reported adsorbent materials
In this study, the adsorption capacity (mg/g) of Mn dioxide NPs and Mn dioxide/eggshell nanocomposite is compared with other reported natural and synthetic adsorbent materials in Table . Adsorption capacity basically depends upon the primary source of adsorbent, the process conditions, adsorbent modification and matrix effects of the analyte solution. It can be seen from Table that most of the reported adsorbents depict low adsorption capacity than our reported materials. Furthermore, they achieved this capacity with a greater amount of adsorbent and a low dye concentration value. On the other hand, adsorbent that depicts higher adsorption capacity in comparison to Mn dioxide NPs and Mn dioxide/eggshell nanocomposite has been chemically modified that significantly enhance their removal efficiency [Citation69–77].
Table 4. Comparison of Mn dioxide NPs and Mn dioxide /eggshells NC with other reported adsorbents used for removal studies of CV dye.
4. Conclusion
In the current study, biogenic synthesis of Mn dioxide NPs and Mn dioxide/eggshell nanocomposite was successfully synthesized using aqueous leaf extract of Ocimum basilicum. Prepared materials were characterized by UV-Visible, FTIR, XRD, SEM and EDX analysis.
Biosynthesized Mn dioxide NPs depicted a UV peak at 260 nm. This peak was shifted to 225 nm in the case of NCs. FTIR spectrum of plant extract showed a peak at 3270.88 cm−1which confirmed the presence of alcoholic and phenolic hydroxyl groups of phytochemicals (cardiac glycoside, saponins and tannin). FTIR spectrum of NPs exhibits peaks for stretching and bending mode vibration of M = O, Mn-O, M-O-H and Mn-O-Mn bonds. While NCs spectrum represents the formation of the C–O–M bond. XRD analysis of Mn dioxide NPs and Mn dioxide/eggshell NCs depicted representative peaks of manganese dioxide. The size of green synthesized NPs and NCs as calculated by the Debye-Scherrer equation was 59.46 and 32 nm, which was further confirmed by SEM analysis. SEM images confirmed the more or less spherical morphology of NPs and NC. EDX data also confirmed the presence of oxygen and manganese element in NPs and indicates oxygen, carbon, calcium and manganese element in NC.
The catalytic activity of both materials was investigated for the removal of CV dye. In the case of NPs and NC, the optimum response was observed for 15 and 20 mg/L dye concentration with 20 mg amount of adsorbent under basic conditions with temperature conditions of 50°C and 60°C, respectively. Thermodynamic studies confirmed that the removal of CV dye by Mn dioxide NPs and MN dioxide /eggshell NC was endothermic, spontaneous and feasible in nature. Isothermal studies proved that the Langmuir plot fits the data in both scenarios.
Thus, it can be concluded that bio-synthesized Mn dioxide fabricated on eggshell as a nanocomposite was proved to be an efficient adsorbent in the removal of cationic CV dye. Nano-composite formation not only reduces the chances of aggregation but also makes the adsorbent heterogeneous in nature, decreases its size and enhances its efficiency as an adsorbent.
Disclosure statement
No potential conflict of interest was reported by the author(s).
Data availability statement
All data generated or analyzed during this study are included in this submitted manuscript and its supplementary information file.
References
- Mahmoodi MN, Saffar-Dastgerdi HM. Clean Laccase immobilized nanobiocatalysts (graphene oxide - zeolite nanocomposites): from production to detailed biocatalytic degradation of organic pollutant. Appl Catal, B. 2020;268:118443.
- Oveisi M, Asli AM, Mahmoodi MN. Carbon nanotube based metal-organic framework nanocomposites: synthesis and their photocatalytic activity for decolorization of colored wastewater. Inorg Chim Acta. 2019;487:169–176.
- Mahmoodi MN, Taghizadeh A, Taghizadeh M, et al. Surface modified montmorillonite with cationic surfactants: preparation, characterization, and dye adsorption from aqueous solution. J Environ Chem Eng. 2019;7(4):103243.
- Parshetti KG, Parshetti GS, Telke AA, et al. Biodegradation of crystal violet by agrobacterium radio bacter. J Environ Sci. 2011;23(8):1384–1393.
- Lairini S, Mahtal EK, Miyah Y, et al. The adsorption of crystal violet from aqueous solution by using potato peels (Solanum tuberosum): equilibrium and kinetic studies. J Mater Environ Sci. 2017;8(9):3252–3261.
- Rashad S, Zaki HA, Farghali AA. Morphological effect of titanate nanostructures on the photocatalytic degradation of crystal violet. Nanomater Nanotechnol. 2019;9:1–10.
- Bertolini RCT, Izidoro CJ, Magdalena PC, et al. Adsorption of crystal violet dye from aqueous solution onto zeolites from coal fly and bottom ashes. The Electron J Chem. 2013;5(3):179–191.
- Farhan MA, Jasim AR, Sando SM. Photo degradation of crystal violet dye by synthesized silver nanoparticles using extract of tangerine peel. Int J Sci Res. 2017;6(10):1–9.
- Vijay M, Anu Y, Supriya K. Photochemical decolorization of methyl violet dye using Azadirachta indica (Neem) mediated synthesized silver nanoparticles. Der Pharmacial Lettre. 2018;8(7):119–128.
- Puri C, Sumana G. Highly effective adsorption of crystal violet dye from contaminated water using graphene oxide intercalated montmorillonite nanocomposite. Appl Clay Sci. 2018;166:102–112.
- Wathukarage A, Herath I, Iqbal MCM, et al. Mechanistic understanding of crystal violet dye sorption by woody biochar; implications for wastewater treatment. Environ Geochem Health. 2017;41:1647–1661.
- Pandey S, Son N, Kang M. Synergistic sorption performance of karaya gum crosslink poly(acrylamide-co-acrylonitrile) @ metal nanoparticle for organic pollutants. Int J Biol Macromol. 2022;210:300–314.
- Khapre M, Shekhawat A, Saravanan D, et al. Mesoporous Fe–Al-doped cellulose for the efficient removal of reactive dyes. Mater Adv. 2022;3:3278–3285.
- Najafpour MM, Rahimi F, Amini M, et al. A very simple method to synthesize nano-sized manganese oxide: an efficient catalyst for water oxidation and epoxidation of olefins. Dalton Trans. 2012;41:11026–11031.
- Djerdj I, Arcon D, Jaglicic Z, et al. Non aqueous synthesis of manganese oxide nanoparticles, structural characterization, and magnetic properties. J Phys Chem. 2007;111(9):3614–3623.
- Islam AM, Morton WD, Johnson BB, et al. Manganese oxides and their application to metal ion and contaminant removal from waste water. J Water Process Eng. 2018;26:264–280.
- Camacho ML, Parra RR, Deng S. Arsenic removal from groundwater by MnO2-modified natural clinoptilolite zeolite: effects of pH and initial feed concentration. J Hazard Mater. 2011;189:286–293.
- Balaz M. Ball milling of eggshell waste as a green and sustainable approach. Adv Colloid Interface Sci. 2018;256:256–275.
- Yadav T, Mungray AA, Mungray KA. Generation of TiO2 nanoparticle-based acacia saturated eggshell biocomposite for pathogen removal. Environ Nanotechnol, Monit Manage. 2018;9:50–57.
- Jiang J, Biswas PA. Characterization of size, surface charge, and agglomeration state of nanoparticle dispersions for toxicological studies. J Nanoparticles Res. 2009;11:77–89.
- Altemimi A, Lakhssassi N, Baharlouei A, et al. Phytochemicals: extraction, isolation, and identification of bioactive compounds from plant extract. Plants. 2017;6:42–65.
- Ahmad M, Naz BS, Sharif A, et al. Biological and pharmacological properties of the sweet basil (Ocimum basilicum). Br J Pharm Res. 2015;7(5):330–339.
- Vlase L, Benedec D, Hanganu D, et al. Comparative evaluation and antimicrobial activity of Ocimum basilicum. J Global Pharma Technol. 2010;2(5):49–53.
- Daniel NV, Daniang EI, Nimyel DN. Phytochemical analysis and mineral elements composition of Ocimum basilicum obtained in JOS metropolis, plateau state, Nigeria. Int J Eng Technol. 2011;06:161–165.
- Güez MC, d.Souza OR, Fischer P, et al. Evaluation of basil extract (Ocimum basilicum L.) on oxidative, antigenotoxic and anti-inflammatory effects in human leukocytes cell cultures exposed to challenging agents. Brazil J Pharm Sci. 2017;53(1):15098–15110.
- Singh J, Mehta A, Rawat M, et al. Green synthesis of silver nanoparticles using sun dried tulsi leaves and its catalytic application for 4-nitrophenol reduction. J Environ Chem Eng. 2018;6:1468–1474.
- Prasad SA. Green synthesis of nanocrystalline manganese (II, III) oxide. Mater Sci Semicond Process. 2017;71:342–347.
- Zadeh NM, Sajadi MS, Fard HA. Chicken eggshell as a natural valuable resource and environmentally benign support for biosynthesis of catalytically active Cu/eggshell, Fe3O4/eggshell and Cu/Fe3O4/eggshell nanocomposites. Appl Catal, B. 2016;191:209–227.
- Jayapriya E, Lalitha P. Synthesis of silver nanoparticles using leaf aqueous extract of Ocimum basilicum (L.). Int J ChemTech Res. 2013;5(6):2985–2992.
- Ajitha B, Reddy KAY, Shameer S, et al. Lantana camara leaf extract mediated silver nanoparticles: antibacterial, green catalyst. J Photochem Photobiol. 2015;149:84–92.
- Kumar V, Yadav S, Yadav KS. Syzygium cumini leaf and seed extract mediated biosynthesis of silver nanoparticles and their characterization. J Chem Technol Biotechnol. 2010;85:1301–1309.
- Shantkriti S, Rani P. Biological synthesis of copper nanoparticles using Pseudomonas fluorescens. Int J Curr Microbiol Appl Sci. 2014;3(9):374–383.
- Manzoor U, Zahra TF, Rafique S, et al. Effect of synthesis temperature, nucleation time, and post synthesis heat treatment of ZnO nanoparticles and its sensing properties. J Nanomater. 2010;2010:189058. doi:10.1155/2015/189058.
- Pandian KMA, Karthikeyan C, Rajasimman M. Isotherm and kinetic studies on nano-sorption of malachite green onto Allium sativum mediated synthesis of silver nano particles. Biocatal Agr Biotechnol. 2016;8:171–181.
- Jeevanandam J, Chan SY, Danquah KM. Review on nanoparticles and nanostructured materials: history, sources, toxicity and regulations. ChemBioEng Reviews. 2016;3(2):55–67.
- Mosaddegh E, Hosseininasab AF, Hassankhani A. Eggshell/Fe3O4 nano composite: a novel magnetic nanoparticles coated on porous ceramic eggshell waste as an efficient catalyst in the synthesis of 1,8-dioxo-octahydroxanthene. J R Soc Chem. 2015;5:106561–106567.
- Lee J, Scagel FC. Chicoric acid found in basil (Ocimum basilicum L.) leaves. Food Chem. 2009;115(2):650–656.
- Bonnia NN, Kamaruddin SM, Nawawi HM, et al. Green biosynthesis of silver nanoparticles using ‘polygonum hydropiper’ and study its catalytic degradation of methylene blue. Procedia Chem. 2016;19:594–602.
- Dessie Y, Tadesse S, Eswaramoorthya R. Physicochemical parameter influences and their optimization on the biosynthesis of MnO2 nanoparticles using Vernonia amygdalina leaf extract. Arabian J Chem. 2020;13(8):6472–6492.
- Rasaee I, Ghannadnia M, Honari H. Antibacterial properties of biologically formed chitosan nanoparticles using aqueous leaf extract of Ocimum basilicum. Nano Med J. 2016;3(4):240–247.
- Ahmed HA, Hussein K, Alsy HA. Chemotaxonomy and spectral analysis (GC/MS and FT-IR) of essential oil composition of two Ocimum basilicum L. varieties and their morphological characterization. Jordan J Chem. 2017;12(3):147–160.
- Kadhim JM, Sosa AA, Hameed HI. Evaluation of anti-bacterial activity and bioactive chemical analysis of Ocimum basilicum using Fourier transform infrared (FT- IR) and gas chromatography-mass spectrometry (GC-MS) techniques. Academic J. 2016;8(6):127–146.
- Anitha P, Sakthivel P. Microwave assisted synthesis and characterization of silver nanoparticles using Ocimum basilicum and its anti-inflammatory activity against human blood cells. Int J Sci Res. 2016;5(1):1422–1428.
- Gupta N, Kushwaha KA, Chattopadhyaya CM. Application of potato (Solanum tuberosum) plant wastes for the removal of methylene blue and malachite green dye from aqueous solution. Arabian J Chem. 2016;9:S707–S716.
- Tang N, Tian X, Yang C, et al. Facile synthesis of a-MnO2 nanorods for high-performance alkaline batteries. J Phys Chem Solids. 2010;71:258–262.
- Botero SL, Herrera PA, Hinestroza PJ. Oriented growth of α-MnO2 nanorods using natural extracts from grape stems and apple peels. Nanomaterials. 2017;7(5):117–123.
- Sivaranjani K, Meenakshisundaram M. Biological synthesis of silver nanoparticles using Ocimum basillicum leaf extract and their antimicrobial activity. Int Res J Pharm. 2013;4(1):225–229.
- Naemchan K, Meejoo S, Onreabroy W, et al. Temperature effect on chicken egg shell investigated by XRD, TGA and FTIR. Adv Mat Res. 2008;55:333–336.
- Tsai TW, Yang MJ, Lai WC, et al. Characterization and adsorption properties of eggshells and eggshell membrane. Bioresour Technol. 2006;97:488–493.
- Mosaddegh E, Hassankhani A, Maleh KH. Synthesis and characterization of ES/Cu(OH)2 nanocomposite: a novel and high effective catalyst in the green synthesis of pyrano[4,3-b]pyrans. Mater Sci Eng. 2015;46:264–269.
- Hoseinpour V, Souri M, Ghaemi N. Green synthesis, characterization and photocatalytic activity of manganese dioxide nanoparticles. Micro Nano Lett. 2018;13:1560–1563.
- Mishra K, Poudel NT, Basavegowda N, et al. Enhanced catalytic performance of magnetic Fe3O4–MnO2 nanocomposites for the decolorization of rhodamine B, reduction of 4-nitroaniline, and sp3 C–H functionalization of 2- methylpyridines to isatins. J Catal. 2016;344:273–285.
- Pung YS, Chan LY, Sreekantan S, et al. Photocatalytic activity of ZnO-MnO2 core shell nanocomposite in degradation of RhB dye. Pigm Resin Technol. 2016;45:408–418.
- Karimi M, Eshraghi JM. One pot and green synthesis of Mn3O4 nanoparticles using an all-inone system (solvent, reactant and template) based on ethaline deep eutectic solvent. J Alloys Compd. 2017;696:171–176.
- Feng L, Xuan Z, Zhao H, et al. Mno2 prepared by hydrothermal method and electrochemical performance as anode for lithium-ion battery. Nanoscale Res Lett. 2014;9:290. doi:10.1186/1556-276X-9-290.
- Paul PJJ, Sakunthala M, Udhaya IC. Green synthesis of manganese nanoparticles using the aqueous extract of Ctenolepis garcini (Burm. f.) C.B Clarke. Inte J Bot Stud. 2017;5:71–75.
- Asaikkutti A, Bhavana SP, Vimala K, et al. Dietary supplementation of green synthesized manganese-oxide nanoparticles and its effect on growth performance, muscle composition and digestive enzyme activities of the giant freshwater prawn Macrobrachium rosenbergii. J Trace Elem Med Biol. 2016;5:7–17.
- Moon AS, Salunke KB, Alkotaini B, et al. Biological synthesis of manganese dioxide nanoparticles by Kalopanax pictus plant extract. IET Nanobiotechnol. 2015;9:220–225.
- Dang DT, Cheney AM, Qian S, et al. Novel rapid one step synthesis of manganese oxide nanoparticles at room temperature using poly(dimethylsiloxane). Am Chem Soc. 2013;52(7):2750–2753.
- Sharma G, Kumar A, Naushad M, et al. Fabrication and characterization of Gum arabic-cl- poly(acrylamide) nanohydrogel for effective adsorption of crystal violet dye. Carbohydr Polym. 2018;202:444–453.
- Kulkarni RM, Revanth T, Acharya A, et al. Removal of crystal violet dye from aqueous solution using water hyacinth; equilibrium, kinetics and thermodynamics study. Resource-Efficient Technol. 2017;3:71–77.
- Suhail ASF, Mashkour SM, Saeb D. The study on photo degradation of crystal violet by polarographic technique. Int J Basic Appl Sci. 2015;15(3):12–211.
- Mashkoor F, Nasar A. Polyaniline/Tectona grandis sawdust: a novel composite for efficient decontamination of synthetically polluted water containing crystal violet dye. Groundwater Sustainable Dev. 2019;8:390–401.
- Alshabanat MB, Alsenani G, Almufarij R. Removal of crystal violet dye from aqueous solutions onto date palm fiber by adsorption technique. J Chem. 2013;2013:210239. doi:10.1155/2013/210239.
- Mahmoud EM, Nabil MG, Khalifa AM. Effective removal of crystal violet and methylene blue dyes from water by surface functionalized zirconium silicate nanocomposites. J Environ Chem Eng. 2019;7(2):103009. doi:10.1016/j.jece.2019.103009.
- Bian Y, Sun H, Luo Y, et al. Effect of inorganic salt ions on the adsorption of quinoline using coal powder. Water Sci Technol. 2018;78(3):496–505.
- Tanthapanichakoon W, Ariyadejwanich P, Japthong P, et al. Adsorption-desorption characteristics of phenol and reactive dyes from aqueous solution on mesoporous activated carbon prepared from waste tires. Water Res. 2005;39(7):1347–1353.
- Rawat S, Singh J. Green synthesis of iron nanoparticles using Plumeria and Jatropha: characterization and investigation of their adsorption, regeneration and catalytic degradation efficiencies. BioNanoScience. 2021;11:1142–1153.
- Samrot VA, Ali HH, Selvarani J, et al. Adsorption efficiency of chemically synthesized superparamagnetic iron oxide nanoparticles (SPIONs) on crystal violet dye. Curr Res Green Sustainable Chem. 2021;4:100066.
- Foroutan R, Peighambardoust SJ, Peighambardoust SH, et al. Adsorption of crystal violet dye using activated carbon of lemon wood and activated carbon/Fe3O4 magnetic nanocomposite from aqueous solutions: a kinetic, equilibrium and thermodynamic study. Molecules. 2021;26:2241.
- Ali I, Peng C, Khan ZM, et al. Green synthesis of phytogenic magnetic nanoparticles and their applications in the adsorptive removal of crystal violet from aqueous solution. Arab J Sci Eng. 2018;43:6245–6259.
- Basavaiah K, Kahsay MH, Rama Devi D. Green synthesis of magnetite nanoparticles using aqueous pod extract of Dolichos lablab L. for an efficient adsorption of crystal violet. Emergent Mater. 2018;1:121–132.
- Alizadeh N, Shariati S, Besharati N. Adsorption of crystal violet and methylene blue on azolla and fig leaves modified with magnetite iron oxide nanoparticles. Int J Environ Res. 2017;11:197–206.
- Abdolahi G, Dargahi M, Ghasemzadeh H. Synthesis of starch-g-poly (acrylic acid)/ZnSe quantum dot nanocomposite hydrogel, for effective dye adsorption and photocatalytic degradation: thermodynamic and kinetic studies. Cellulose. 2020;27:6467–6483.
- Hoang BN, Nguyen TT, Bui QPT, et al. Enhanced selective adsorption of cation organic dyes on polyvinyl alcohol/agar/maltodextrin water-resistance biomembrane. J Appl Polym Sci. 2020;137:48904.
- Druzian SP, Zanatta NP, Côrtes LN, et al. Preparation of chitin nanowhiskers and its application for crystal violet dye removal from wastewaters. Environ Sci Pollut Res. 2019;26:28548–28557.
- AL-Shehri SH, Almudaifer E, Alorabi QA, et al. Effective adsorption of crystal violet from aqueous solutions with effective adsorbent: equilibrium, mechanism studies and modeling analysis. Environ Polutants Bioavailability. 2021;33(1):214–226.