
 ?Mathematical formulae have been encoded as MathML and are displayed in this HTML version using MathJax in order to improve their display. Uncheck the box to turn MathJax off. This feature requires Javascript. Click on a formula to zoom.
ABSTRACT
The water seepage problem in the poison lake was investigated using Geophysical methods for determining subsurface fractures in the lake area. Major focus of this study is to identify and determine the subsurface seepage locations or fractures and their orientation. Electrical resistivity methods, including profiling and Vertical Electrical Sounding (VES), were used to investigate the location of subsurface fracture zones causing water seepage in the poison lake. Furthermore, a numerical analysis (factor analysis) method was used for conformation as well as the depth of fracture zones. Finally, the azimuthal electrical resistivity technique was used to delineate the orientation of the seepage paths. Two subsurface fractures were delineated at the Poison Lake, which might be the prominent water seepage point in the lake. Delineation of subsurface fractures will help in preventing the water losses from the lake by treating the fractures.
1. Introduction
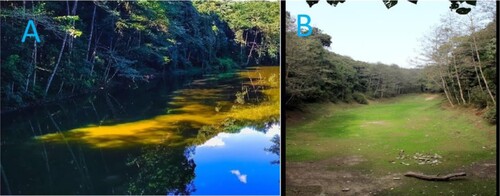
The Poison Lake is a natural lake and it was a very important water resource for people in rural areas as this lake not only recharges the groundwater aquifers but also promotes tourism and contributes to making the local springs perennial. The poison lake area belongs to seismic zone IV and is the epicenter of several previous earthquakes that are located within 100 km surrounding the lake (), thus there is a strong possibility that the poison lake could have dried- owing to earthquake-generated subsurface fractures. Construction activities in the dam area may also be one of the reasons for the development of minor fractures and joints in the lake area. On-site investigation suggests that water is seeping out from the bottom of the lake through fracture within the subsurface rocks. Figure shows the availability of water in the poison lake during and after the rainy season in 2021. The Sikkim state government department carried out the partial cementing work on the surface of the lake, in order to seal the subsurface fractures without delineating the fracture location. These fractures are rock breaks resulting from the strain due to concentrations of stress near the cracks; these cracks are heterogeneous in nature and a type of discontinuity within the rock body [Citation1]. Such fractures are also developed from frequent microtremors and earthquakes in Sikkim [Citation2]. Although there are no movements or displacements along these fractures, these fractures play an important role in increasing the intensity of the earthquake, resulting in the activation of old landslides, damage of infrastructures such as roads, buildings and the development of new fractures and joints. For geologists and hydrogeologists rock fractures on the surface and subsurface are extremely important structures, as fractures on the rock surface allow infiltration of rain and surface water, while subsurface fractures and their orientation allow groundwater to move in multiple areas. At the same time, fractures could be dangerous and can make any civil engineering structures such as dams, reservoirs, tunnels and roads unstable if ignored. Therefore, the study of fracture systems in subsurface rocks is of great importance for many geophysicists and geologists. The electrical resistivity method is one of the easiest and most economically feasible geophysical methods to delineate the fracture location, depth and orientation. Fracture zone mapping, using a 2-D electrical resistivity survey, was carried out recently in crystalline bedrock in Brazil [Citation3] to determine the subsurface structure.
Figure 1. The availability of water in the poison lake area during (A) and after (B) the rainy season in the year 2021.
There are different types of geophysical electrical resistivity surveys. The profiling (horizontal) technique was selected for this investigation, owing to its effectiveness in the measurement of the horizontal variation of electrical resistivity [Citation4]. Generally, the Wenner array is chosen for 2-D profiling data acquisition because of its high sensitivity to lateral inhomogeneities as well as good vertical resolution [Citation5]. The electrical resistivity method plays an important role in finding the fractured zones in rocks [Citation6]. Ait Bahammou et al. [Citation4] used the electrical resistivity technique to find the fracture zones for groundwater exploration at the Etherachidian basin in Morocco. A similar survey was conducted using an Earth resistivity metre at Belra near Roorkee Uttarakhand, India [Citation7] to investigate the sensitivity and geometric factor of the sub-surface. The Wenner array configuration was applied to identify the groundwater mineralization [Citation8], in the carbonate karstic/fracture aquifer at Bulla Regia aquifer, Northwestern Tunisia, using a multi-electrode cable. To characterize fractures and fracture zones in a carbonate aquifer, an electrical resistivity method was effective in the small village of Kadarta in the city of Veszprem, Hungary [Citation9]. A contour plot of areal horizontal resistivity profiling data provides sufficient information about the fracture location. This contour plotting method was used to identify fractures in the hard rock area in the Sonebhadra region of India for groundwater exploration [Citation10]. Generally, fractures are filled by loose sediments, and water and air materials. Therefore, it has different resistivity than the surrounding materials. Close contour appears in the areal contour plot at the fracture locations and hence can be detected [Citation9], but to ensure its location, further vertical electrical sounding (VES) is needed. This vertical electrical sounding method was recently used in the Ifaki-Oye-Ikole Ekiti highway, Nigeria to evaluate the condition of a particular section of the road. Where sounding data were collected using ABEM Terrameter SAS 300 [Citation5]. In the Rafah coastal area of North Sinai, Egypt region, the ground geophysical investigation applied VES, to search for groundwater. Schlumberger configuration was used for vertical electrical survey to investigate depth-wise variation of resistivity of the sub-surface [Citation11]. This non-invasive technique is also recently used at Basiri, Southwestern Nigeria for delineating fractured and weather zones which permit the accumulation of groundwater in the basement rock [Citation12]. Recently, to investigate sub-surface hydro-geophysical conditions, the VES technique was performed, using Schlumberger electrode configuration, within the Pakpattan district of Panjab province, Pakistan [Citation13]. The numerical analysis of VES data can provide further confirmation of fracture position. This method is also used to find out the depth of fracture from ground level.
In the present study, methods such as horizontal profiling (Using Wenner geometrical configuration), VES (Using Schlumberger geometrical configuration) and Numerical analysis technique (Generally known as Factor analysis) were used to find out the location of fracture and lithology of the sub-surface. At last, the Azimuthal resistivity survey (ARS) was carried out to find out the orientation of identified fractures; the Schlumberger configuration was adapted for VES to get better current penetration at depth. The resistivity changes in the sub-surface strata with escalating depth are more prominent than other analyses. The Factor analysis was effective in the delineation of fractured aquifers in a terrain dominated by a granite rock area in the district of Nalgonda (AP), India [Citation14]. Fracture orientation knowledge helps in determining the water seepage direction in the sub-surface. The azimuthal electrical resistivity survey method is useful in determining fracture orientation. This technique has been successfully used to find out the hydrocarbon’s direction of flow in the unsaturated zone in Karbala Governorate, Iraq [Citation15]. Recently, this technique was used to identify fractures in quartzite in the Thamirabarani sub-basin, Karunkulam village, Southern India. Here, the azimuthal square array was used due to greater penetration depth than Wenner and Schlumberger array [Citation16]. A similar survey was also carried out in a low-latitude crystalline basement complex of southwestern Nigeria to detect anisotropy of the sub-surface rock [Citation17].
The major objective of this research work was (1) to determine the fracture position, depth and orientation in the poison lake, (2) to study the subsurface lithology of poison lake on the basis of VES data and (3) to assess the possibility of fracture treatment in order to prevent the water loss through seepage.
2. Study area
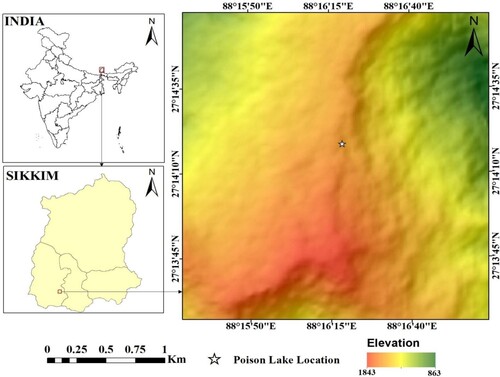
Sikkim is one of the northeastern states of India and is located in the Eastern Himalayas. This state lies between the latitudes 27° 05′N and 28° 08′N and longitudes 88° 10′E and 88° 55′E and is surrounded by countries like Bhutan and Nepal in the east and west direction, respectively. Sikkim is a hilly terrain area, with an area of nearly 7096 square kms. Sikkim state has four districts (North, South, East and West). East district is the most populated and the north is the least populated district of Sikkim state. Water scarcity is severe in the south and west districts of Sikkim. The majority of the population in the south and west districts of Sikkim relies on springs and lakes to fulfill their water demand for domestic and agricultural purposes [Citation18]. The study area “Poison Lake” comes under Rinchenpong, west district, of Sikkim which is an almost dry lake bounded by latitude 27°14′17.538″N to 27°14′20.0724″N and longitude 88°16′20.4492E″ to 88°16′21.0468″E, with an area of 2027 square metre and an altitude of 1382 m (Figure ). The richest natural resources of Sikkim are forest cover, which is mostly deciduous, subtropical and coniferous.
Figure 2. Location of the Poison Lake and its surrounding topography.
3. Geological setting of the study area
The state of Sikkim is located in the eastern Himalayas and is classified as a high-risk seismic zone IV as per BIS: 1893 [Citation19]. The Poison Lake is located at an altitude of 1382 m, on a north-south trending ridge at a distance of approximately 500 m south of the Rinchenpong village, in the district of south Sikkim.
Geologically the lake is situated in the low-grade metamorphosed rocks of the Daling Group, representing the Precambrian Lesser Himalayan Sequence (LHS). Towards the east of the lake lies the Rangit window, bounded by the Ramgarh thrust [Citation20]. The Rangit window exposes the Gondwana Group rocks of the Permian age, and the rocks of the Buxa Group belonging to the Proterozoic–early Cambrian era [Citation20]. Lithologically the study area comprises purple phyllites and quartzites, greyish green phyllites and quartzites and Greyish green and purple phyllites enclosing grains of sheared quartz veins. The presence of the earthquake epicentres and lineaments near the poison lake is shown in Figure . Major lineament orientation is reported as NW-SE and named Teesta lineament [Citation21]. The nearest epicentre of the earthquake, having a moment magnitude (Mw) of 4.94 and a focal depth of 10 km, occurred in the year 2012, and is located approximately 1.66 km from the study area [Citation22].
Figure 3. Geological setting (Lithostratigraphy, Lineament and Seismicity) of the Poison Lake and its surrounding area (Source: Bhattacharya and Mitra [Citation20], Hazarika and Ravi Kumar [Citation21], GSI [Citation22]).
![Figure 3. Geological setting (Lithostratigraphy, Lineament and Seismicity) of the Poison Lake and its surrounding area (Source: Bhattacharya and Mitra [Citation20], Hazarika and Ravi Kumar [Citation21], GSI [Citation22]).](/cms/asset/3839f418-0d37-48f7-90fd-2753b39a1f40/tusc_a_2153426_f0003_oc.jpg)
4. Materials and methodology
The electrical resistivity of different geological materials is different and in rocks, it depends on various physical properties of the rock material as well as on the porosity, permeability, pore fluid and salinity of pore fluid within the rock. Therefore, the electrical resistivity of an earth material depends on the above-mentioned parameters [Citation23] and it is extremely useful in detecting the anomalous zones having dissimilar resistivity values compared to the surrounding material. These anomalous zones can be different geological strata or fracture zones of particular strata [Citation17]. The resistivity is also known as specific resistance, which is just in the verse of the conductivity. In the field, DC was injected via two current electrodes in the subsurface and two potential electrodes were used to measure the potential difference [Citation24]. To overcome the noise coming from the telluric current, a low-frequency AC (Frequency < 20 Hz) was used instead of a DC [Citation23]. Materials used in the present study were Aqua metre CRM-500, Electrode (Current and Potentials), Rechargeable battery, Measuring Tape, Hammer, Coiled wire, Global positioning system (GPS), Lime (CaCo3), Recording Sheet and Clinometers. The same instrument i.e. Aqua metre CRM-500 was recently used for the assessment of groundwater study in the Thamirabarani sub-basin of India [Citation16].
The in-situ seepage of water from the lake may be possible if there are either fractures or joints or holes present in subsurface hard rock. Therefore, the seepage location is an anomalous resistivity zone compared to the surrounding area. An electrical resistivity profiling survey is generally used to find out the lateral variation of resistivity of sub-surface material. Out of the different geometrical configurations of profiling surveys, the alpha- Wenner profiling survey provides good resolution and can give reliable outcomes [Citation7]. The geometrical configuration of the alpha- Wenner array is shown in Figure , where C1 and C2 are current electrodes, through which current (I) is injected into the sub-surface and P1 and P2 are the potential electrodes, through which potential difference (V) is measured. All four electrodes are aligned along the same straight line [Citation13]. We can calculate the apparent resistivity of the sub-surface using the following formula
(1)
(1)
where
= Apparent resistivity of the sub-surface; a = separation between successive electrodes.
Figure 4. The Wenner Array Layout (Source: Kearey et al. [Citation23], Telford et al. [Citation24]).
![Figure 4. The Wenner Array Layout (Source: Kearey et al. [Citation23], Telford et al. [Citation24]).](/cms/asset/a7d62b57-89c6-4cb0-81ec-d66156043d1c/tusc_a_2153426_f0004_oc.jpg)
After acquiring areal profiling data, locations having anomalous variations of resistivity over the study area are identified. This is usually done by SURFER software. The input resistivity values acquired from different locations of the survey area are used for generating a resistivity contour plot as an output. Contour plotting of Wenner 2D profiling data can indicate the seepage location. Actually, the seepage locations on the contour plot are the locations where contour lines are close and very dense due to rapid variation of sub-surface resistivity values. Therefore, using an electrical resistivity profiling survey (Using Wenner array Configuration), seepage/fracture locations in the study area can be identified. This method only provides the surface location of fracture or seepage point but is unable to give any information related to lithology, depth and orientation of fractures within the sub-surface. Therefore, after the identification of seepage location(s), it is essential to perform vertical electrical sounding (VES) for further confirmation of seepage locations, evaluation of sub-surface lithology and finding out the depth of fracture from the ground level.
In VES four electrodes are used, out of them, two are potential electrodes and the rest two are current electrodes. Current electrodes are used to inject continuous current within the subsurface and potential electrodes are used to measure potential difference [Citation13]. The geometry of symmetric and asymmetric Schlumberger configuration is shown in Figures and , respectively with the necessary formula for calculating geometric factor (having the dimension of length) and apparent resistivity [Citation23].
Figure 5. The Schlumberger (Symmetric) Array Layout [Citation23].
![Figure 5. The Schlumberger (Symmetric) Array Layout [Citation23].](/cms/asset/cbc69234-ae62-4e56-94c6-8cbb2ca6ea40/tusc_a_2153426_f0005_oc.jpg)
Figure 6. The Schlumberger (Asymmetric) Array Layout [Citation23,Citation24].
![Figure 6. The Schlumberger (Asymmetric) Array Layout [Citation23,Citation24].](/cms/asset/3cd4f758-18eb-4dd7-90e4-8c62d633b753/tusc_a_2153426_f0006_oc.jpg)
Finally, the Azimuthal resistivity survey (ARS) was used to carry out the identified fracture or seepage locations on the ground level above the anomalous sub-surface point [Citation1] for the determination of the only orientation of fracture. The azimuthal resistivity survey method is a “method” and not an “array” because it is less of an array and more of an electrode orientation or method.
The full azimuthal Schlumberger geometry is shown in Figure . Here, current electrodes (red coloured circles), for a particular azimuth are kept at a fixed separation (24 m) and potential electrodes (green coloured circles) are moved along the same azimuthal direction for getting apparent resistivity data. After completing the measurement for one azimuthal direction, the same procedure was followed for the next azimuthal direction. The next azimuthal directions are obtained by rotating the collinear array at a constant angle (45°). The apparent resistivity of the sub-surface is calculated using the following equation
(2)
(2)
where L = half of the separation between the current electrodes; a = half of the separation between potential electrodes; X = separation between the centre of current electrodes and potential electrodes; V = Measure potential difference; I = Current injected into the ground through current electrodes [Citation26].
Figure 7. Full-azimuthal Schlumberger Geometry. The collinear array is rotated from N10°W azimuth, at a step of 45°, through 360°. Complementary angles are 180° offset (Source: Ogunbo et al. [Citation25]).
![Figure 7. Full-azimuthal Schlumberger Geometry. The collinear array is rotated from N10°W azimuth, at a step of 45°, through 360°. Complementary angles are 180° offset (Source: Ogunbo et al. [Citation25]).](/cms/asset/92aa70f5-4146-40ec-9883-324db9750639/tusc_a_2153426_f0007_oc.jpg)
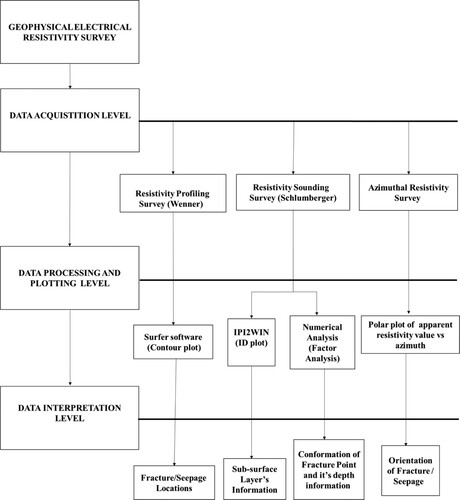
The flow chart of methodology ain the present study is shown elow (Figure ).
Figure 8. Flow chart of the methodology.
4.1. Data acquisition
In the present study, geo-electrical areal profiling using the Wenner electrode array configuration was employed (Figure ). A total of 22 Wenner profiling were carried out within the poison lake area. For all profiling lines, the current electrode spacing (C1, C2) was 42 m and the potential electrode spacing (P1, P2) was 14 m. As the alpha – Wenner configuration (Figure ) was employed, the corresponding geometrical factor is 87.92 m because for this electrical configuration geometrical factor (G) follows the below relation:
(3)
(3)
where a = spacing between successive electrodes.
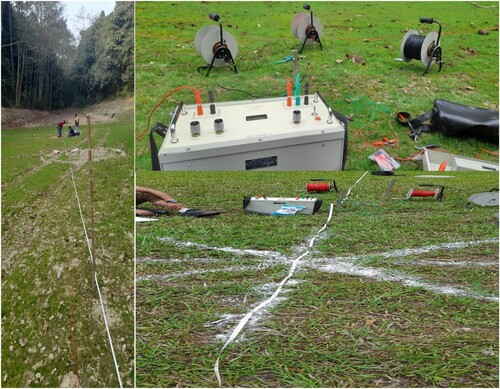
Figure 9. The Wenner profiling survey at the Poison Lake, Sikkim.
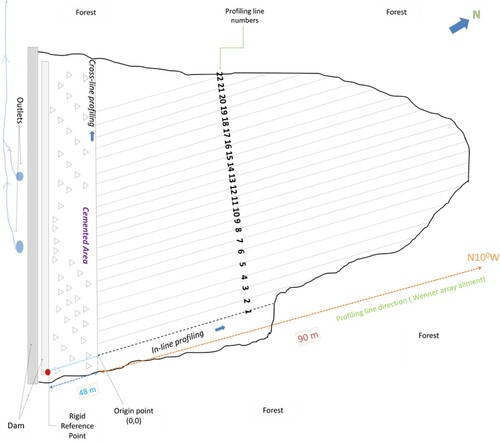
The direction of all Wenner profiling lines was oriented N10° W and the initial position of line 1 was taken as the origin (0,0) position, which was 48 m apart from the left corner of the dam (Figure ). The rigid and stable left corner of the dam was taken as the fixed reference point of this entire geophysical survey. The successive line interval was taken as 1 m in order to trace all minor and major sub-surface fractures and joints. Hence the initial positions of line 1 and line 22 were (0, 0) and (0, 21), respectively. For convenience, the inline direction was taken as the X-axis and the crossline direction was taken as the Y-axis. The length of different profile lines was different due to the uneven shape of the lake. The length of those profiling lines varies from 42 m to 112 m, but for all profiling lines the same parameter of the Wenner electrode array configuration was used i.e. spacing between current electrodes (C1, C2) was 42 m and potential electrode (P1, P2) was 14 m. The interval between successive data was constant at 14 m for all profiling.
Using those profiling data, the contour of resistivity data was plotted with the help of surfer software. Close contour locations were identified. Those are the probable fractures or seepage locations at ground level and then vertical electrical sounding (VES), using the Schlumberger array configuration (Figure ), was performed over those identified close contour locations for the further confirmation of seepage position or fracture locations. VES data also provide sub-surface lithological information. The factor analysis of VES data was also used to validate the fracture locations and their depth within the sub-surface from the surface level of the lake.
The Schlumberger array configuration was used to perform the Vertical electrical sounding (VES) in the poison lake (Figure ). A total of four (4) soundings were carried out in the identified close contour locations. Out of four VES, two VES were carried out over the seepage locations (namely, VES-2 & VES -3) and another two were right (VES-4) and left (VES-1) of those two seepage locations. In the VES technique, two electrodes C1 and C2 were used as current electrodes for injecting the current in the subsurface strata, and the obtained potential was measured via P1 and P2 potential electrodes. (Figure ). The position of the potential electrodes was kept at one point, while the positions of the current electrodes were changed continuously up to the pre-decided length. The positions of potential electrodes were also increased as the spacing between the current electrodes escalated to get sufficient potential values. The spacing between current and potential electrodes was changed by maintaining the ratio of the spacing between the current electrodes to that potential electrode, (L/l) from 3 to 20. Here maximum current electrode spacing ranges from 104 m to 124 m. Finally, to find out the direction of the seepage, an Azimuthal resistivity survey was carried out cantering the seepage location as identified previously by the Wenner 2D profiling survey. This azimuthal resistivity technique was used with a non-symmetric or asymmetric Schlumberger (Figure ) type of electrode array for finding out the direction of flow of seepage water (i.e. fracture orientation) [Citation15]. The fixed current electrode spacing (C1, C2) and potential electrode spacing (P1, P2) were 24 m and 4 m, respectively. For a particular line, only potential electrodes were moved forward keeping the separation between P1 and P2 constant i.e. equal to 4 m. The estimations were carried out in four directions starting from the N10° W at an interval of 45° anti-clockwise. The fieldwork of the Azimuthal resistivity survey is shown in the lower right corner of Figure . Larger electrode spacing could not be used due to the unavailability of the surrounding area.
Figure 10. Fieldwork carried out at the Poison Lake, Sikkim, India.
5. Results and discussion
5.1. Electrical profiling survey
The result of the electrical profiling survey using the Wenner electrode array configuration is shown in Table .
Table 1. Geo-electrical areal profiling survey using the Wenner array configuration at the Poison Lake.
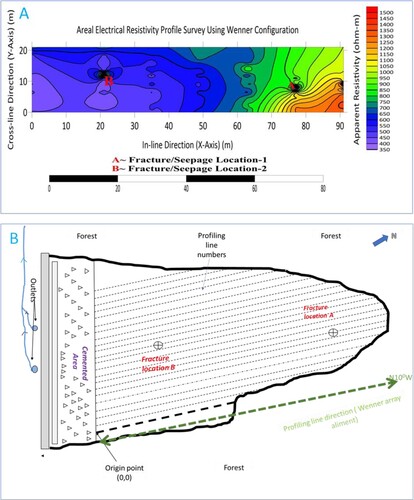
Taking all profiling data, using surfer software, the contour of resistivity data was plotted, as shown in Figure (A). At two locations the apparent resistivity contours are close and they are indicated by red letters A and B in Figure (A). These two locations have been identified as seepage/fracture locations, which are responsible for the seepage of lake water. The same locations have been represented in Figure (B) also, which shows the actual profiling points.
Figure 11. (A) Contour plot of the Geo-Electrical Areal Profiling Survey using the Wenner Array configuration (B) Field location of two identified fractures at the Poison Lake.
5.2. Electrical-sounding survey
Two VES were performed using the Schlumberger array method at two identified seepage locations, as indicated in Figure (A,B), namely, VES-2 and VES-3, and the other two, namely, VES-1 and VES-4 were conducted on the left and right of VES-2 and VES-3, respectively. All the VES survey data are shown in Table .
Table 2. An electrical sounding survey using the Schlumberger array configuration at the Poison Lake.
Apparent resistivity vs AB/2 was prepared on a log-log plot using IPI2Win software. This programme was used to perform qualitative analysis and interpretation of the field curves, the software provides the number, thickness and resistivity of sub-surface layers. Figure (B,C) show fracture signatures as indicated by the dotted green circle because here sounding data show a significant variation or change in resistivity in those locations. But no significant changes in resistivity values were shown in Figure (A,D). Hence no fracture or seepage is present on VES-1 and VES-4 sounding lines.
Figure 12. (A to D) Apparent resistivities vs. AB/2 for VES-1 to 4 were plotted on a log-log plot using IPI2Win software.[A]: ρ1<ρ2>ρ3<ρ4 (KH- Type) VES-1, [B]:ρ1>ρ2<ρ3<ρ4 (HA-Type)VES-2 [C]: ρ1>ρ2<ρ3<ρ4 (HA- Type) VES-3 [D]: ρ1<ρ2<ρ3<ρ4 (AA-Type) VES-4.
![Figure 12. (A to D) Apparent resistivities vs. AB/2 for VES-1 to 4 were plotted on a log-log plot using IPI2Win software.[A]: ρ1<ρ2>ρ3<ρ4 (KH- Type) VES-1, [B]:ρ1>ρ2<ρ3<ρ4 (HA-Type)VES-2 [C]: ρ1>ρ2<ρ3<ρ4 (HA- Type) VES-3 [D]: ρ1<ρ2<ρ3<ρ4 (AA-Type) VES-4.](/cms/asset/d7501a55-dd83-4996-a377-50668473682a/tusc_a_2153426_f0012_oc.jpg)
5.3. Numerical analysis (factor) of Schlumberger resistivity sounding data
It is a statistical technique that explains the changeability among obtained and corresponding variables showing fewer unobserved variables known as factors [Citation14]. The data obtained for apparent resistivity are further calculated, and the apparent resistivity ratio of an electrode separation of AB/2 (distance of the current electrode from the centre) to the cumulative apparent resistivity of earlier separation is calculated. The obtained ratio is called “factor”, generally denoted by F which can be expressed as follows:
(4)
(4)
where 2, 4 and 6 indicate the AB/2 positions.
The obtained VES data were used for the calculation of the factor; the obtained factor data are shown in Table . They revealed fracture zones at varying depths.
Table 3. Delineation of fractured using numerical analysis (factor) of the Schlumberger resistivity sounding data.
The obtained factor value for the correlated apparent resistivity has been plotted for the VES (all four soundings) on a double log scale, as presented in Figure (A,B). In the factor plot the flat sections are shown in boxes, and against the related values AB/2 separation shows fractured rocks (Schist).
Figure 13. (A to B) Apparent resistivity and its corresponding factor plot for the four VES (Log-Log plot).
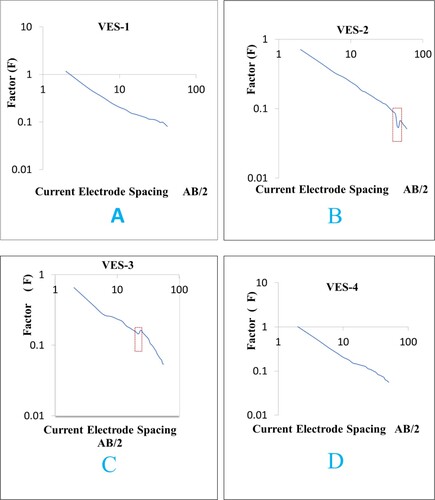
The VES-2 factor analysis has shown a flat segment, from 42 to 46 m as per the current electrode separations of AB/2. Similarly, the VES-3 factor analysis also shows a flat segment (the presence of fracture zone) from 18 to 22 m. Hence, the factor analysis is extremely helpful in delineating the fracture zones, which are located at A and B points, as shown in Figure .
5.4. Azimuthal resistivity survey
An azimuthal resistivity survey was carried out at location B, as shown in Figure , to find out the direction of fracture orientation or seepage direction. The result is shown in Table . The apparent resistivity along the fracture direction is low as compared to other directions. In the polar plot of apparent resistivity values versus azimuth as shown in Figure , it is clear that the maximum resistivity values are in the N80°E direction and the minimum along the N10°W direction. Hence the fracture orientation is along the N10°W and S10°E directions. Previous studies in the study area [Citation20–22] also reported the Teesta lineament (Figure ) with NW-SE orientation and earthquake epicentres. Since the direction of delineated subsurface fractures and reported lineament is nearly the same, both might be earthquake-generated structures and validate the study findings. Furthermore, the subsurface water flow direction is controlled by the subsurface structures (joint, fracture, faults, etc) in hard rock; therefore, the seepage direction should be along the fracture direction, as shown in Figure by a green colour arrow. As the topographic gradient is higher toward the north direction than the south direction, the subsurface water seepage direction could be north to south.
Figure 14. Polar plot of apparent resistivity values versus azimuth. The orientation of the arrow (Green colour) shows the orientation of the dominant fracture orientation or seepage direction.
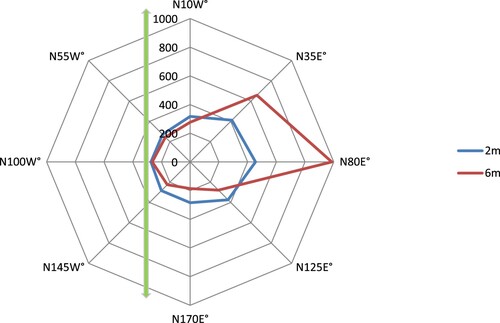
Table 4. Result of the azimuthal resistivity survey at location B using the Schlumberger array.
6. Conclusion
The important conclusion of the study are as follows:
The Poison lake, which was a perennial lake, has become seasonal. On-site investigation suggests that water is seeping out at the bottom of the lake through the sub-surface rocks.
A series of electrical resistivity survey, i.e. profiling using the Wenner array layout and vertical electrical sounding using the Schlumberger array configuration depicted two fracture/seepage locations (namely, A and B) at the bottom of the Poison lake with an apparent resistivity of approximately 540 ohm-m and 1162 ohm-m, respectively.
Furthermore, the Azimuthal resistivity survey at location B shows that the maximum resistivity values are in the N80°E direction and the minimum along the N10°W direction. Hence the fracture orientation is along the N10°W direction. This direction is further complemented by the topographic slope at the Poison Lake which is high in the N10°W direction and low in the N170°E direction. Therefore, the seepage water is moving from N10°W to N170°W due to pressure height differences.
The Poison lake, which was a resourceful lake in terms of water resources and recreation purposes, is drying up. Our preliminary study suggests that the two fractures/seepage locations identified at the bottom of the lake are the main reasons for water seepage. Therefore, proper renovation/blockage of the fracture is necessary to rejuvenate the lake.
However, the shape of the poison lake is not rectangular. Hence, this irregular shape and dimension of the lake make it difficult to analyze deeper lithological information by carrying out deeper soundings and profiling.
Acknowledgement
The authors thanks and acknowledge to the, Climate Change Division, Department of Science and Technology (DST), Government of India, for (DST/CCP/CoE/186/2019(G), dated: 03/03/2019.) financially supporting the establishment of “DST's Centre of Excellence on Water Resources, Cryosphere and Climate Change Studies” at the Department of Geology, Sikkim University, (PI- Dr. Anil Kumar Misra).
Disclosure statement
No potential conflict of interest was reported by the author(s).
References
- Salam R, Parnadi WW. Laboratory-scaled azimuthal resistivity survey for fracture detection. 2021 IOP Conf Ser: Earth Environ Sci. 2021;873:012079. doi:10.1088/1755-1315/873/1/012079
- Kumar S, Singh P, Sushil R, et al. Microtremor measurement to evaluate site characteristics by horizontal to vertical spectral ratio technique in Sikkim, Northeast Himalayas, India. Quat Int. 2021;585:134–142. doi:10.1016/j.quaint.2020.11.028
- Elis VR, Bondioli A, Ustra AT, et al. Resistivity imaging for identification of fracture zones in crystalline bedrock in Brazil. Sustainable Water Resour Manage. 2019;5(3):1089–1101. doi:10.1007/s40899-018-0287-8
- Ait Bahammou Y, Benamara A, Ammar A, et al. Fracture zone detection for groundwater exploration integrating Resistivity Profiling and Very Low-Frequency electromagnetic methods (Errachidia basin, Morocco). Contrib Geophys Geod. 2019;49(2):181–194. doi:10.2478/congeo-2019-0009
- Olabode OP, Adeniji A. Application of electrical resistivity in evaluating a section of road conditions—a case study in Ifaki-Oye-Ikole Ekiti Highway, Nigeria. Arabian J Geosci. 2022;15(12):1169. doi:10.1007/s12517-022-10449-z
- Dakir I, Benamara A, Aassoumi H, et al. Application of induced polarization and resistivity to the determination of the location of metalliferous veins in the taroucht and tabesbaste areas (Eastern Anti-Atlas, Morocco). Int J Geophys. 2019;2019:1–11. doi:10.1155/2019/5849019
- Singh U, Sharma PK. Study on geometric factor and sensitivity of subsurface for different electrical resistivity tomography arrays. Arabian J Geosci. 2022;15(7):560. doi:10.1007/s12517-022-09844-3
- Twihri A, Mlayah A, Gabtni H, et al. Contribution of geophysical and geochemistry methods to identify the groundwater mineralization: a case of the Bulla Regia aquifer (Northwestern Tunisia). Arabian J Geosci. 2022;15(10):1005. doi:10.1007/s12517-022-10213-3
- Szalai S, Kovács A, Kuslits L, et al. Characterisation of fractures and fracture zones in a carbonate aquifer using electrical resistivity tomography and pricking probe methodes. J Geosci Environ Protection. 2018;6(4):1–21. doi:10.4236/gep.2018.64001
- Yadav GS, Pratap B. New approach of gradient profiling for tracking of low resistivity shallow fracture in hard rock area for groundwater exploration. Arabian J Geosci. 2018;11(19):601. doi:10.1007/s12517-018-3937-0
- Kotb ADM, Nabeh M, Adham A. Integrated remote sensing, VES, and TEM to evaluate the Rafah coastal aquifers for sustainable development—a case study. Arabian J Geosci. 2021;14(17):1697. doi:10.1007/s12517-021-08106-y
- Aizebeokhai AP, Ogungbade O, Oyeyemi KD. Application of geoelectrical resistivity for delineating crystalline basement aquifers in Basiri, Ado-Ekiti, Southwestern Nigeria. Arabian J Geosci. 2021;14(1):51. doi:10.1007/s12517-020-06440-1.
- Muhammad S, Ehsan MI, Khalid P. Optimizing exploration of quality groundwater through geophysical investigations in district Pakpattan, Punjab, Pakistan. Arab J Geosci. 2022;15(8):721. doi:10.1007/s12517-022-09990-8
- Andrade R. Delineation of fractured aquifer using numerical analysis (factor) of resistivity data in a granite terrain. Int J Geophys. 2014;2014:1–8. doi:10.1155/2014/585204
- AL-Menshed FH, Thabit JM. The use of an azimuthal resistivity survey to detect the flow direction of hydrocarbons in the unsaturated zone at Karbala Governorate, Iraq. Environ Earth Sci. 2016;75(19):1328. doi:10.1007/s12665-016-6120-5
- Antony RA, Richard AS. Assessment of groundwater study using geophysical and geochemistry mapping in Thamirabarani sub-basin, Karunkulam area, Southern India. Arabian J Geosci. 2022;15(3):228. doi:10.1007/s12517-021-09357-5
- Adabanija MA, Kolawole LL, Afolabi AO, et al. Investigating aquifer structure in a low-latitude crystalline basement complex of southwestern Nigeria using radial vertical electrical sounding. Arabian J Geosci. 2021;14(4):238. doi:10.1007/s12517-021-06622-5
- Dubey SK, Ranjan RK, Misra AK, et al. Variability of precipitation extremes and drought intensity over the Sikkim state, India, during 1950–2018. Theor Appl Climatol. 2022. doi:10.1007/s00704-022-03931-x
- BIS: 1893–2002. Criteria for earthquake design of structures.
- Bhattacharyya K, Mitra G. A new kinematic evolutionary model for the growth of a duplex — an example from the Rangit duplex, Sikkim Himalaya, India. Gondwana Res. 2009;16:697–715.
- Hazarika P, Ravi Kumar M. Seismicity and source parameters of moderate earthquakes in Sikkim Himalaya. Nat Hazards. 2012;62(3):937–952. doi:10.1007/s11069-012-0122-8
- GSI. Bhukosh-geoscientific data repository; 09-08-2022. https://bhukosh.gsi.gov.in/
- Kearey P, Brooks M, Hill I. An introduction to geophysical exploration. 3rd ed. Paris: Blackwell Science Ltd; 2002.
- Telford WM, Geldart LP, Sheriff RE. Applied geophysics. 2nd ed. Cambridge University Press; 1990. doi:10.1017/CBO9781139167932
- Ogunbo JN, Mamukuyomi EA, Adepoju WS, et al. Panoramic azimuthal Schlumberger vertical electrical sounding for fracture orientation and anisotropy quantification. Heliyon. 2018;4(12):e00998. doi:10.1016/j.heliyon.2018.e00998
- Al-Zubedi AS, Thabit JM. Use of 2D azimuthal resistivity imaging in delineation of the fracture characteristics in Dammam aquifer within and out of Abu-Jir fault zone, central Iraq. Arabian J Geosci. 2016;9(1):22. doi:10.1007/s12517-015-2070-6