
 ?Mathematical formulae have been encoded as MathML and are displayed in this HTML version using MathJax in order to improve their display. Uncheck the box to turn MathJax off. This feature requires Javascript. Click on a formula to zoom.
Abstract
In the present investigation, Hematite rhombus nanoplates (α-Fe2O3-RNPs) were synthesized from Ferric chloride salts by hydrothermal method. The α-Fe2O3-RNPs were characterized by X-ray powder diffraction (XRD), Scanning electron microscope (SEM), Energy-dispersive X-ray spectroscopy (EDX), Fourier transformation infrared (FTIR), X-ray photon spectroscopy (XPS), Brunauer–Emmett–Teller (BET) specific surface area, UV-visible spectroscopy, Photoluminescence (PL) and Electrochemical impedance spectroscopy (EIS) techniques. The photocatalytic response was confirmed via the degrading of two different pollutant dyes such as cationic methylene blue (MB) and anionic methylene orange (MO). The degradation was performed under diverse optimizing specifications of process variables. The response time, catalyst amount, dye initial concentration, and recyclability showed versatile effects during dye degradation. The α-Fe2O3-RNPs hold potent antibacterial activity against P. acne and Enterococcus faecium (E. faecium). Based on the results, the hydrothermal method is feasible and facile for the synthesis of α-Fe2O3-RNPs for photocatalytic and antibacterial activity.
1. Introduction
In the last few decades, with the development taking place in every part of life, one of the most critical environmental challenges is water quality. The eminent population compactness and the degree of industrial enterprise have activated the hydrosphere to embody impure with the inorganic and organic substances at an accelerative order. To some extent, this problem is solved by efficient development in the field of nanotechnology. There is an immense involution of researchers in the discipline of nanotechnology imputable to tunable attributes of the immiscible materials at the nanoscale level [Citation1–6].
Recently, nanostructured metal or metallic oxide semiconducting materials own specific optic, electric, biosensing and photocatalyst attributes compared to their bulk form [Citation7,Citation8]. Particularly, Iron oxide nanostructures with their unique properties have attracted many investigators because of their facile manufacturing ways, low-priced, atoxic behaviour, magnetic, electronic and optic appliances [Citation9,Citation10]. Amongst diverse forms of iron oxides, hematite (α-Fe2O3), maghemite (γ- Fe2O3) and wustite (FeO), the hematite is an n-type semiconductor (Eg = 2.1 eV) photocatalyst (A photocatalyst is a material that stimulated by light photon and whose presence raises the value of a chemical response but itself persists unvaried at the final stage of the chemical reaction) has acquired intense interest owing to bio-safe, inexpensive, abundance existence, the most familiar sort of iron oxide, high index to absorb a photon of visible light (absorbs light up to 600 nm), ineradicable in most aqueous solutions and environment-friendly nature for eloquent solar energy (adequate to 40% of the solar-spectrum) conversion [Citation11–13]. The structure of α-Fe2O3 is a hexagonal crystal system in which the Fe atom is surrounded by six O atoms. However, as it is reported its photocatalytic response is limited due to its short diffusion length (2–4 nm), short excited-state lifetime (1 ps) and α-Fe2O3 also has crystal size-dependent photocatalytic activity [Citation14–17]. The physical and chemical properties of these materials depend largely on the shape, size and morphology of the nanostructure which ultimately affects the surface to volume ratio and generates quantum confinement effects [Citation18–20].
Recently, two-dimensional nanostructures have got so much attention compared to three multidimensional nanostructures of the same materials owed to substantial anisotropy which stimulates specific attributes [Citation21–23]. The surface of two-dimensional nanostructures incorporates a multitude of atoms ordered in a single crystal. The presence of an eminent part of atoms on the surface establishes two-dimensional nanostructures as superior catalysts [Citation24,Citation25]. There are many reported methods regarding the preparation of α-Fe2O3 catalysts including sol–gel, co-precipitation, hydrolysis, solvothermal and hydrothermal methods [Citation26–30]. One of these methods hydrothermal method is efficient, facile, and a protocol that gives high productivity, furthermore morphology could be controlled by controlling temperature, surfactant and reaction time [Citation31,Citation32].
Gastrointestinal problems are the major health issues in the global village due to the massive application of antibiotics, development in the medicinal industry and contaminated foods [Citation33]. About 400 species have been identified in the gastrointestinal tract or on the skin, including Staphylococcus aureus, which produces a toxin and causes infections [Citation34]. Due to this, nanoparticles get the attention of researchers as an antimicrobial agent to stunt the growth of bacteria. The efficacy of nanoparticles as antimicrobial agents depends upon the species of microbial, size, shape, and nature of nanoparticles [Citation35]. In this study, we prepared the α-Fe2O3-RNPs to check the antibacterial activity of bacterial species via the agar diffusion method.
In this study, we synthesized α-Fe2O3 powder by hydrothermal method and then characterized for their morphological, optical, and structural correspondences by applying versatile characterization techniques, such that XRD, FE-SEM, EDX, FTIR, XPS, UV-visible, BET surface area, PL and EIS techniques. The photocatalytic response of as prepared α-Fe2O3-RNPs was investigated against two different anionic and cationic dyes. It was observed that the photocatalytic attributes and efficiencies are toned through the surface structures of the photocatalysts letting in expanse, porousness, and particle size. PL spectra of as produced α-Fe2O3-RNPs catalyst revealed, owing to local d-band transition nature Fe2O3 doesn't exhibit photoluminescent expelling in bulk form but a significant emission peak in the spectrum green region owed to quantum confinement effects. The photoluminescent emissions were caused by the surface defects which may arise from the deep level impurities and owed to improve Fe–O bonding separation. This excellent PL behaviour endows it with potential applications in the optical field. Articles reporting all this information about hematite α-Fe2O3-RNPs are very rare.
2. Materials and methods
2.1. Synthesis procedure
All the chemicals and reagents were of analytic grade and applied with no additional refinement. For the typical synthesis, Ferric chloride (FeCl3) 0.70 g was dissolved in 30 ml water and stirred vigorously for 1 h, then 3% wt of 2, 2-bipyridine and CTAB was added drop wisely into the solution. The pH of the solution was adjusted at 4; the resultant solution was shifted to a 100 mL Teflon-lined stainless-steel autoclave and put into a muffle furnace at 200°C. The reaction lasted for 22 h and then allowed the autoclave to cool near room temperature naturally. The colour of the solution was changed during this hydrothermal treatment from yellow to red. The reddish precipitates were collected and Water-washed complied by ethanol washing (thrice) to assure the remotion of unreacted ions then calcined at 600°C for 2 h. The colour of the reddish precipitates powder changed into deep brown powder after calcined treatment and the obtained product was taken for further physiochemical characterizations.
2.2. Characterization
To explore the Hematite catalyst various characterization techniques were applied. For crystallization and phase, XRD (Bruker D8-Advance X-ray diffractometer) was used. For shape, dimensions and structure study, SEM (Hitachi-S5500) was used. For chemical composition, Energy Dispersive X-ray Spectroscopy (EDX) was used. For elemental analysis and bond location and surface analysis, XPS (Thermo Fischer Scientific) was used. For the attached functional group's analysis, FTIR (Nicolet Magna-550 spectrometer) was used. For the surface area analysis, BET (Micro metrics ASAP 2010) was used. For the charges transportation within the α-Fe2O3-RNPs catalyst, PL (Hitachi F-4500) and EIS (Chi-760D) were used.
2.3. Photocatalytic activity
The photocatalytic activity (PCA) was measured under visible radiation using a Xe-lamp. For the photolysis and photocatalysis of the aqueous solution of MB and MO dyes, a photochemical setup equipped with a 300W Xe-lamp (Perkin Elmer-35) was used. A magnetized scaremonger was exploited for stimulating the sample to attain a consistent flow of visible light throughout the solution. The dyes solutions of varying concentrations were set up in ultrapure water and the catalyst was imparted at circumstantial ratios. To dissolve the catalyst, the sonication process was executed for 10 min. To attain the adsorption–desorption equilibrium, unenlightened stirring was accomplished for 30 min. A sample of unenlightened stirring was picked up and examined to get the spectra. The visible light irradiated samples were collected at different times and filtered out through a micron syringe filter. Then the persisting absorption of dyes was checked through spectrophotometric analysis. While the experiments were carried out in a glass beaker with a capacity of 250 millilitres. A precise quantity of catalyst was mixed with 50 millilitres of dyes solutions. The pH of the dye’s solutions was attuned using the acid-based solution. The percentage of dyes degradation was evaluated by applying the relation as presented in equation (1).
(1)
(1)
The analytical analysis of the kinetics of MO and MB dyestuffs debasement is measured by applying the pseudo-first-order model as given below [Citation36,Citation37].
(2)
(2) where Ce is the initial dyestuff concentration at equilibrium, and Ct represents the concentration subsequently at the time “t” Whereas, k is the pseudo-first-order rate constant. Pseudo-first-order kinetic model is typically worked out for the system where the quantity of the initial pollutant is low [Citation38–40].
2.4. Antibacterial activity
The agar diffusion method was employed to determine the antimicrobial activity of α-Fe2O3-RNPs against P. acnes (MTCC-1951, gram-negative) and Enterococcus faecalis (ATCC 29212, gram-positive). 1% solution of each substance was prepared in DMSO 10mg/ml. The solution was filtered through a Millipore filter (0.22 µm). Gram -ive and Gram + ive bacteria were incubated in nutrient broth for 24-hour at 37°C under aerobic conditions. Each plate containing 15 ml media was incubated for 24-hour at 37°C under aerobic conditions. Discs of 10 mm diameter were prepared from Whatman filter paper No.1 and autoclaved. 25, 50, and 100 µl of required solution were added to each sterile disc.25, 50, and 100 µl of required solution were added over the agar plates. Sterile paper discs impregnated with test material were placed on agar. The plates were incubated for 24 h at 37°C and the zone of inhibition (ZOI) was recorded in diameter millimetres.
3. Results and discussion
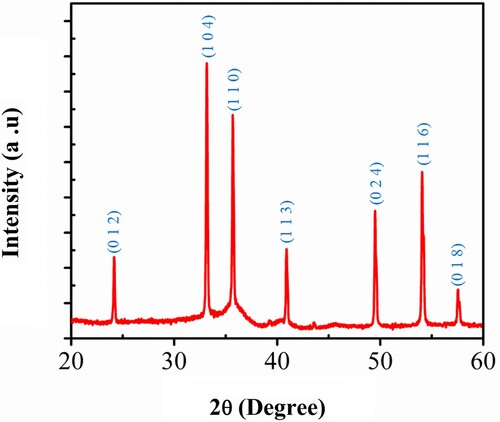
Figure (a) shows the XRD pattern of the Fe2O3 sample, which can be assigned to Hematite with crystal system Rhombohedral, reference Code JCPDS no. 33-0664, with space group (R-3c) and space group number 167. All diffraction peaks are found of pure α-Fe2O3 cell consist of lattice parameters a = 5.03 Å, b = 5.03 Å and c = 13.74 Å and α = 90.00, β = 90.00 and γ = 120.00. No other diffraction peaks were noticed within the detection limit indicating the as-synthesized sample is α-Fe2O3.
Figure 1. XRD pattern for the hematite α-Fe2O3-RNPs prepared by hydrothermal method.
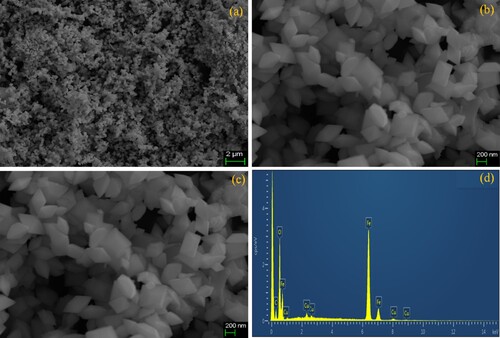
For dimension, morphology and topographic study SEM analysis were performed and the obtained results are depicted in Figure (a-c) where pure Fe2O3 with Hematite rhombus nanoplates morphology aredetected in the range of width and thickness 100 ∼ 250 nm and 350 ∼ 365 nm. It is contemplation that this formation of nanoplates is due to the chelation of metal cations in the solution. For chemical composition and elemental confirmation, the EDX mapping was performed as shown in Figure (d). No other elements are found then the Fe, O while the C and Cu peaks originated from the sample holding grid and from the background carbon tape.
Figure 2. (a-c) SEM micrographs of the resulting α-Fe2O3-RNPs products synthesized, (d) EDS of α-Fe2O3-RNPs sample prepared by the hydrothermal autoclave method.
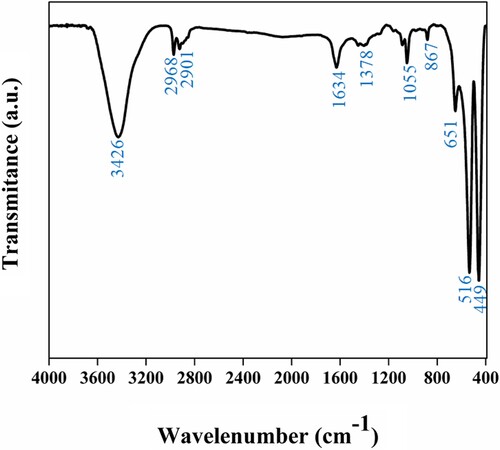
For identification of chemical bond as well as to confirm the attached functional group with the α-Fe2O3, Fourier transforms infrared spectroscopy (FTIR) was executed in the range from 400–4000 cm−1 wavenumber. FTIR spectra of α-Fe2O3 in Figure exhibit that Fe2O3 contain C = H stretching at peak 1634 cm−1.and C–O and CO–H stretching at peaks 1055 and 1378 cm−1 individually. Large broadband at 3426 cm−1 is associated with an expanding O-H vibration in the OH¯ groups. A strong band of less than 700 cm−1 is provided with Fe-O stretch mode. The band of Fe-O is visible at 516 cm−1 in a stretch mode of Fe2O3 [Citation41].
Figure 3. FTIR spectra of the resulting α-Fe2O3-RNPs catalyst synthesized by hydrothermal method.
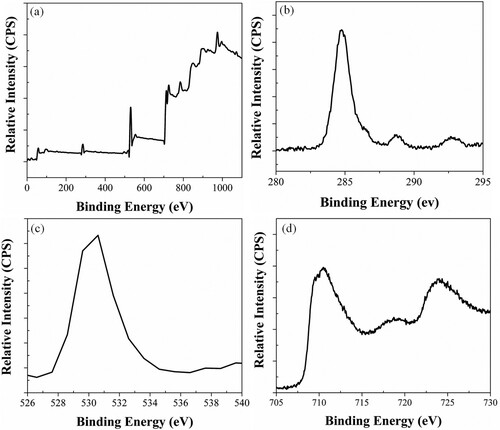
To further confirm the purity, surface state and composition of α-Fe2O3 XPS analysis was performed. Figure (a) shows survey scan XPS spectra of the α-Fe2O3-RNPs. The detailed XPS elemental analysis confirms the presence of iron, carbon, and oxygen as deliciated in Figure (b-d). Figure (b) indicates the high-resolution spectrum of C1s from 280 to 292 eV, where the energy bonds of C at 284.70 and 288.20 eV endure to C–C and C–H. Figure (c) shows the O1s core level spectrum where the dominant oxide peak at around 529.9 eV. Figure (d) shows the photoelectron peaks of Fe at 711 and 725 eV is the characteristic doublets of Fe 2p3/2 and 2p1/2. The core levels suggest that the valency of iron and oxygen are +3 and −2, respectively. These results also confirmed our XRD, and EDX results as well as are in good correspondence with the literature esteems of α- Fe2O3 [Citation42].
Figure 4. XPS of the α-Fe2O3-RNPs (a) survey spectrum, (b) core level of C 1s spectra, (c) core level O 1s spectra and (d) core level Fe 2p spectra.
4. Photocatalytic evaluation
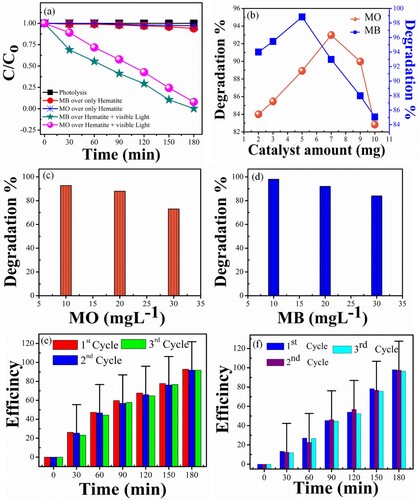
The photocatalytic activity of α-Fe2O3-RNPs was investigated by the decomposition of methylene blue (MB) and methyl orange (MO) dye. The concentration of MB and MO photodegradation under visible light is revealed in Figure (a). For comparison purposes, decomposition without catalyst and catalyst without light was also investigated. The concentration of the MB and MO dyes solutions gradually decreased in the front of α-Fe2O3-RNPs catalyst and visible radiation, while accrediting the function of visible light, degradation was re-examined under visible light with no photocatalyst. No significant photocatalytic activeness was noticed only 1% in 3 h; Fe2O3 demonstrated the same low catalytic activity without light. The concentration of MB and MO decreased only by 4% and 3% when there was no visible light. These results suggest that the photocatalytic activity of MO and MB over Fe2O3 depends on visual acuity [Citation18,Citation35]. The photocatalytic efficiency of α-Fe2O3-RNPs reaches up to 92 and 98% for MO and MB dyes, respectively in 3 h (Figure a). The offend difference in the productivity is attributed to the dye's structural characters and photodynamic derived bandgap of α-Fe2O3-RNPs. The effect of catalyst dose was also examined, and it was observed that a 5–7 mg amount of α-Fe2O3-RNPs gives optimum results (Figure b), at a higher amount the excess generation of OH¯ radicals starts recombination within the photocatalyst instead of at the surface that leads to a reduction in the efficiency. On the contrary case at a low dose of α-Fe2O3-RNPs the generation of OH¯ radicals is insufficient to obtain the optimum yield, as a result, there is a low photocatalytic response. Dye concentration influence was also examined by taking different dilutions of 10, 20 and 30 mg/L of solutions (Figure c, d). An increment in the dye concentration reduces the photocatalytic activity because the number of dye molecules is increased while the OH¯ radicals are the same secondly the light penetration power also reduces due to high scattering. For stability and reusability of α-Fe2O3-RNPs photocatalyst, the photoactivity was repeated thrice and the obtained error bar graphs are inserted in Figure (e, f). From these outcomes, it is observed that α-Fe2O3-RNPs photocatalyst comprises good stability and recyclability which is very important for practical purposes.
Figure 5. (a) Plot of C/C0 for the decolourization of MO and MB dyes under visible light irradiations. (b) α-Fe2O3-RNPs dosage effect, (c) Effect of the initial dye concentration on photocatalytic degradation of MO (d) Effect of the initial dye concentration on photocatalytic degradation of MB (e) Error bar graph of Photocatalytic activity of α-Fe2O3-RNPs against MO with cycling (f) Error bar graph of Photocatalytic activity of α-Fe2O3-RNPs against MO with cycling.
The optical energy band gap is a fundamental characteristic that adds to the efficiency of the semiconductor photocatalyst, as is well known. The energy band locations of α-Fe2O3 are determined using the Kubelka–Munk function corresponding to (αhν)2 =A(hν - Eg)n/2 and the UV-visible spectra of Fe2O3. Where A is a constant value, Eg is the energy of the bandgap, h is Planck's constant, and n is the frequency of light. In Fe2O3, the energy band “Eg” value is evaluated to be 2.2 eV, which is consistent with prior literature [Citation43–45].
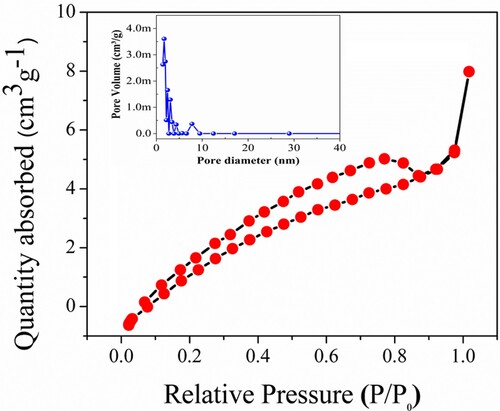
The photocatalytic decaying chemical mechanism is interconnected with the adsorption-degradation-releasing process, as the adsorbent of pollutants on the surface of photocatalysts is involved in the photo-induced response. The BET surface area measurements were also carried out to assure the surface area of the α-Fe2O3-RNPs in the relative pressure at (P/Po) ranges from 0.05–0.25 as demonstrated in Figure . The specific surface area (SBET) of α-Fe2O3-RNPs is 7.907 m2g−1. The expanse is sufficient and causes raised dye surface assimilation over the α-Fe2O3-RNPs surface. The adsorption curve represents a type IV curve revealing the creation of nanopores within the nanostructure and characters of H3 hysteresis. The mean volume and diameter of the pore were calculated as 0.0554 cm3g−1 and 1.685 nm, respectively. The presence of nanopores enables fast mass transport, more light-harvesting and helps to trap more and more dye molecules across the α-Fe2O3-RNPs catalyst surface. Hence, these aggregated light reflectance and surface assimilation over the α-Fe2O3-RNPs surface collectively enrich the photocatalytic activity and results in fast dye degradation [Citation42,Citation46–50].
Figure 6. N2 adsorption-desorption isotherm dispersal curves for surface area (inset) the pore dispersing curves of as-synthesized α-Fe2O3-RNPs catalyst.
The rate of electron–hole pair formation and recombination reaction affects photocatalytic activity, as is well known. The photoluminescence (PL) spectra reveal information on charge generation, migration, and re-integration in photocatalysts. According to the literature, the lower peak intensity of the resulting PL spectra indicates a successful charge transfer within the semiconductor. The low PL intensity suggests a low charge carrier recurrence rate. As a result, the low recombination concentration allows for greater dye photocatalyst degradation. Figure (a) shows the PL spectra of as produced α-Fe2O3-RNPs catalyst, Owed to the local d-band transition nature it does not exhibit photoluminescent expelling in bulk form but a significant emission peak in the spectrum green region when reached in quantum confinement nanoscale, resulting in a small bandgap and increased photocatalytic activity of α-Fe2O3-RNPs. These photoluminescence emissions were maybe either emitted by Superficial defects which might originate by the deep level trap constituted ascribable Fe vacancy or possibly referable to alteration in the oxygen atomic co-ordinates in α-Fe2O3-RNPs, besides improving Fe-O bonding interval, resulting in enhancement of the magnetic coupling of the neighbouring Fe3+ [Citation45,Citation51].
Figure 7. (a) Photoluminescence spectra of α-Fe2O3-RNPs, (b) EIS spectra of the bare and α-Fe2O3 electrode.
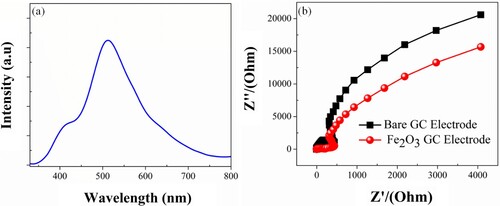
Electrochemical impedance spectroscopy (EIS) is a valuable tool for analysing the conduction, and transport of electrons and materials. Figure (b) shows a modified graph of α-Fe2O3-RNPs-GCE. The α-Fe2O3-RNPs spectrum collective with a semicircle at high frequencies and low frequencies is a straight line. The results show that Fe2O3-RNPs-GCE processes well-controlled electron transfer at high frequencies and a well-ordered distribution at low frequencies. The Nyquist frequency range of Fe2O3-RNPs-GCE is incredibly high compared to the bare GCE which indicates that the modified Fe2O3-RNPs-GCE has higher electrochemical performance and electron transmission is higher than that of bare GCE. The result shows that the modified Fe2O3-RNPs-GCE lowers the electron transport impedance and progressive transformation into an electron transfer process, suggestive of a reduced recombination rate [Citation52–54].
5. Evaluation of antibacterial activity of α-Fe2O3-RNPs
Table represents the antibacterial activity of α-Fe2O3-RNPs is screened against P. acne and E. faecium. The α-Fe2O3-RNPs nanoparticles presented the antibacterial activity towards the examined human pathogenic gram-negative strain P. acne at different concentrations of 25 μL (12 ± 0.985 mm), 50 μL(11.5 ± 0.985 mm) and 100 μL (12 ± 0.985 mm). Antibacterial activity of α-Fe2O3-RNPs was recorded as follows 25 μL (17 ±0.985 mm), 50 μL(13.25 ± 0.985 mm) and 100 μL (13.5±0.985 mm). The exact antimicrobial mechanism of nanoparticles fluctuates from species to species, particles size and shape. For possible mechanism, as α-Fe2O3 is highly stable at room temperature there is less contribution of metal ions in contrast to reactive oxygen species (ROS). The created electron–hole pairs (ehps) develop reactive oxygen and superoxide radicals (•O2¯) and hydroxyl radicals (OH¯) into bacterial cells. These •O2¯ and •OH¯ radicals cause the desorption of the membrane and lead to the death of bacteria. α-Fe2O3 NPs interact with negatively charged lipopolysaccharides (LPs) of gram-negative and teichoic acids or lipoteichoic acids of the gram-positive cell wall to mutate the permeability of cells via disruption in the efflux of H+ pump, cell seepage as well as cell death. In addition, different interactions like electrostatic, dipole–dipole, hydrogen bond and van der wall's interactions with chemical constituents of the cell wall are responsible for the disruption of cellular distraction function and disorganization of the membrane. Thus, α-Fe2O3 NPs mutate the respiratory chain of bacterial metabolism to increase the production of super-oxides, reactive nitrogen species and hypohalous acids which ultimately yield the degradation of the disulfide bond between Cs-Cs of amino acids as well as DNA damages Figure . A previous investigation by L. Gabrielyan et al., 2019 proved that Fe3O4 NPs possess antibacterial activity by ATPase-metabolism, H + -fluxes and oxidative stress [Citation55]. Palanivel Sathishkumar et al., 2016 examined the anti-acne activity of silver nanoparticles AgNPs against P.acnes [Citation56]. Jing Huang et al., 2021 proved that prepared chitosan-α-Fe2O3/GdF exhibit strong antibacterial activity against Escherichia coli, Pseudomonas aeruginosa, Bacilus subtilis, and Staphylococcus aereus [Citation57]. However, the exact role of α-Fe2O3-RNPs on the antibacterial action is yet to be understood clearly. But the possible mechanism of antibacterial activity of α-Fe2O3-RNPs was shown in Figure . Thus α-Fe2O3-RNPs can act as an alternative antimicrobial agent to prevailing antibiotics.
Figure 8. Proposed antibacterial and anti-acne activity of α- Fe2O3-RNPs against selected pathogenic microbes.
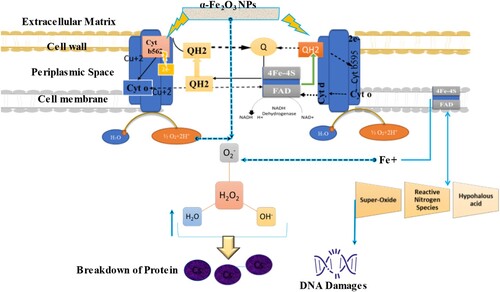
Table 1. ZOI (mm) values of the synthesized α-Fe2O3-RNPs against the pathogenic microbe.
6. Conclusion
In conclusion, we used a hydrothermal technique to successfully manufacture Fe2O3 with Hematite rhombus nanoplates (α- Fe2O3-RNPs) shape. For physiochemical analysis, XRD, SEM, FTIR, XPS, BET, PL, and Electrochemical Impedance spectroscopy were used extensively. The photocatalytic response of α-Fe2O3-RNPs was tested against Mo and MB dyes for practical applications. Because of the low impedance, α-Fe2O3-RNPs had strong photolytic degradation activity, resulting in improved electron–hole separation. As a result, the α-Fe2O3-RNPs are a very efficient photocatalyst that aids and guides future photocatalyst development to address dye contamination and industrial water pollution. Finally, the antibacterial and anti-acne ability of the α-Fe2O3-RNPs against P. acne and E. faecium bacteria is also determined and discussed.
Acknowledgements
Dr. Muhammad Munir sajid thanks Dr. Zhengjun Zhang for supporting character interpretation techniques, Advanced Key Laboratory for New Ceramics, School of Science and Engineering, University of Tsinghua, Beijing, China, 100084. The manuscript was written through the contributions of all authors. All authors have given approval to the final version of the manuscript. Muhammad Munir Sajid: Methodology, Material Experiments, Writing-Original draft preparation, photocatalysis data Analysis, Investigation; Thamer Alomayri: Material Characterization, Data Analysis, Reviewing and Editing; Haifa Zhai: Supervision, Conceptualization, Material Characterization, Validation, Data Analysis, Writing, Reviewing, Editing and Resource Management.
Disclosure statement
No potential conflict of interest was reported by the author(s).
Data availability
Data will be made available on request.
Additional information
Funding
References
- Tombuloglu H, et al. Uptake, translocation, and physiological effects of hematite (α-Fe2O3) nanoparticles in barley (Hordeum vulgare L. Environ Pollut. 2020;266:115391.
- Sarma GK, Gupta SS, Bhattacharyya KG. Nanomaterials as versatile adsorbents for heavy metal ions in water: a review. Environmental Science and Pollution Research. 2019;26(7):6245–6278.
- Borah P, Kumar M, Devi P (Eds). Types of inorganic pollutants: metals/metalloids, acids, and organic forms. In Inorganic pollutants in water. Elsevier; 2020. p. 17–31.
- Gusain R, et al. Adsorptive removal and photocatalytic degradation of organic pollutants using metal oxides and their composites: A comprehensive review. Adv Colloid Interface Sci. 2019;272:102009.
- Qi H, Sun X, Sun Z. Cu-doped Fe2O3 nanoparticles/etched graphite felt as bifunctional cathode for efficient degradation of sulfamethoxazole in the heterogeneous electro-fenton process. Chem Eng J. 2022;427:131695.
- Hitam C, Jalil A. A review on exploration of Fe2O3 photocatalyst towards degradation of dyes and organic contaminants. J Environ Manag. 2020;258:110050.
- Vikas RS, et al. The role of metals in nanocomposites for UV and visible light-active photocatalysis. Green Photocatalytic Semiconductors: Recent Advances and Applications. 2021: 307–335.
- Maksoud MA, et al. Engineered magnetic oxides nano-particles as efficient sorbents for wastewater remediation: a review. Environ Chem Lett. 2021;20(1):519–562.
- Li X, et al. Current investigations into magnetic nanoparticles for biomedical applications. J Biomed Mater Res A. 2016;104(5):1285–1296.
- Sangaiya P, Jayaprakash R. A review on iron oxide nanoparticles and their biomedical applications. J Supercond Novel Magn. 2018;31(11):3397–3413.
- Bekkar D. Elaboration and optimization of iron oxide thin films deposited via spray pyrolysis. Applications in water treatment. 2021, University of Eloued .
- Shtewi FA, Mohammed W, Abdulsalam A. Green synthesis and characterization of iron oxide nanoparticles using MenthaPiperita leaves extract. International Science and Technology Journal. 2021;24:355–372.
- Stolarczyk JK, et al. Challenges and prospects in solar water splitting and CO2 reduction with inorganic and hybrid nanostructures. ACS Catal. 2018;8(4):3602–3635.
- Zhao C, et al. Comparative study on electronic structure and optical properties of α-Fe2O3, Ag/α-Fe2O3 and S/α-Fe2O3. Metals (Basel). 2021;11(3):424.
- Kim C-Y. Atomic structure of hematite (α-Fe2O3) nano-cube surface; synchrotron X-ray diffraction study. Nano-Structures & Nano-Objects. 2020;23:100497.
- AlSalka Y, et al. Iron-based photocatalytic and photoelectrocatalytic nano-structures: facts, perspectives, and expectations. Appl Catal, B. 2019;244:1065–1095.
- Bharath G, et al. Sunlight-Induced photochemical synthesis of Au nanodots on α-Fe2O3@ reduced graphene oxide nanocomposite and their enhanced heterogeneous catalytic properties. Sci Rep. 2018;8(1):1–14.
- Rufus A, Sreeju N, Philip D. Size tunable biosynthesis and luminescence quenching of nanostructured hematite (α-Fe2O3) for catalytic degradation of organic pollutants. J Phys Chem Solids. 2019;124:221–234.
- Ali A, et al. Synthesis, characterization, applications, and challenges of iron oxide nanoparticles. Nanotechnol, Sci Appl. 2016;9:49.
- Magro M, et al. New perspectives on biomedical applications of iron oxide nanoparticles. Curr Med Chem. 2018;25(4):540–555.
- Kannan K, et al. Nanostructured metal oxides and its hybrids for photocatalytic and biomedical applications. Adv Colloid Interface Sci. 2020;281:102178.
- Chang H, et al. α-Fe2O3 nanorods embedded with two-dimensional 0 0 1 facets exposed TiO2 flakes derived from Ti3C2TX MXene for enhanced photoelectrochemical water oxidation. Chem Eng J. 2019;370:314–321.
- Huang Y, et al. Facile synthesis of α-Fe2O3 nanodisk with superior photocatalytic performance and mechanism insight. Sci Technol Adv Mater. 2015;36:731–737.
- Li X, Wang J. One-dimensional and two-dimensional synergized nanostructures for high-performing energy storage and conversion. InfoMat. 2020;2(1):3–32.
- Nguyen VH, et al. Recent advances in two-dimensional transition metal dichalcogenides as photoelectrocatalyst for hydrogen evolution reaction. J Chem Technol Biotechnol. 2020;95(10):2597–2607.
- Chen J, et al. A facile urea-hydrolysis calcination process for the preparation of α-Fe2O3 nanoparticles and α-Fe2O3 nanorods and their fabrication mechanisms. AIP Adv. 2020;10(2):025028.
- Mansour H, et al. Co-precipitation synthesis and characterization of tin-doped α-Fe2O3 nanoparticles with enhanced photocatalytic activities. J Phys Chem Solids. 2018;114:1–7.
- Yin H, et al. Controlled synthesis of hollow α-Fe2O3 microspheres assembled with ionic liquid for enhanced visible-light photocatalytic activity. Front Chem. 2019;7:58.
- Rana S, et al. Low temperature hydrothermal method for synthesis of crystalline Fe2O3 and their oxygen evolution performance. Electroanalysis. 2020;32(11):2528–2534.
- Boumaza S, et al. Preparation and photocatalytic H2-production on α-Fe2O3 prepared by sol-gel. Int J Hydrogen Energy. 2018;43(6):3424–3430.
- Nassar MY, Ahmed IS, Hendy HS. A facile one-pot hydrothermal synthesis of hematite (α-Fe2O3) nanostructures and cephalexin antibiotic sorptive removal from polluted aqueous media. J Mol Liq. 2018;271:844–856.
- Abdelrahman EA, et al. Facile synthesis of Fe2O3 nano-particles from Egyptian insecticide cans for efficient photocatalytic degradation of methylene blue and crystal violet dyes. Spectrochim Acta, Part A. 2019;222:117195.
- Ishaq AR, et al. Outline of animals and plants-based antimicrobial agents (NAA) in antimicrobial food packaging (AFP): a new paradigm in food industry. International Journal of Agriculture. Biology & Environment (e-ISSN 2582-6107). 2020;1(2):4–15.
- Ishaq A, et al. Prospect of microbial food borne diseases in Pakistan: a review. Braz J Biol. 2021;81:940–953.
- Slavin YN, et al. Metal nanoparticles: understanding the mechanisms behind antibacterial activity. J Nanobio-technol. 2017;15(1):1–20.
- Wu W, Huang Z-H, Lim T-T. Recent development of mixed metal oxide anodes for electrochemical oxidation of organic pollutants in water. Appl Catal, A. 2014;480:58–78.
- Sajid MM, et al. Study of the interfacial charge transfer in bismuth vanadate/reduce graphene oxide (BiVO4/rGO) composite and evaluation of its photocatalytic activity. Res Chem Intermed. 2020;46(2):1201–1215.
- Fu Y, Sun X, Wang X. BiVO4–graphene catalyst and its high photocatalytic performance under visible light irradiation. Mater Chem Phys. 2011;131(1-2):325–330.
- Oladoja N, Aboluwoye C, Oladimeji Y. Kinetics and isotherm studies on methylene blue adsorption onto ground palm kernel coat. Turk J Eng Environ Sci. 2009;32(5):303–312.
- Akika F, et al. Structural and optical properties of Cu-substitution of NiAl2O4 and their photocatalytic activity towards Congo red under solar light irradiation. J Photochem Photobiol A. 2018;364:542–550.
- Maji SK, et al. Synthesis, characterization and photocatalytic activity of α-Fe2O3 nanoparticles. Polyhedron. 2012;33(1):145–149.
- Ahmmad B, et al. Green synthesis of mesoporous hematite (α-Fe2O3) nanoparticles and their photocatalytic activity. Adv Powder Technol. 2013;24(1):160–167.
- Zhang X, et al. Synthesis, optical and magnetic properties of α-Fe2O3 nanoparticles with various shapes. Mater Lett. 2013;99:111–114.
- Mimouni I, et al. Effect of heat treatment on the photocatalytic activity of α-Fe2O3 nanoparticles: towards diclofenac elimination. Environmental Science and Pollution Research. 2021;29:1–13.
- Manikandan A, et al. One-pot low temperature synthesis and characterization studies of nanocrystalline α-Fe2O3 based dye sensitized solar cells. J Nanosci Nanotechnol. 2015;15(6):4358–4366.
- Khan SB, et al. Morphological influence of TiO2 nanostructures (nanozigzag, nanohelics and nanorod) on photocatalytic degradation of organic dyes. Appl Surf Sci. 2017;400:184–193.
- Kim TW, Choi K-S. Nanoporous BiVO4 photoanodes with dual-layer oxygen evolution catalysts for solar water splitting. Science. 2014;343:990–994.
- Khan MYA, et al. Visible light photocatalytic degradation of crystal violet dye and electrochemical detection of ascorbic acid & glucose using BaWO4 nanorods. Mater Res Bull. 2018;104:38–43.
- Fujishima A, Rao TN, Tryk DA. Titanium dioxide photocatalysis. J Photochem Photobiol C. 2000;1(1):1–21.
- Higashimoto S, Sakiyama M, Azuma M. Photoelectrochemical properties of hybrid WO3/TiO2 electrode. effect of structures of WO3 on charge separation behavior. Thin Solid Films. 2006;503(1-2):201–206.
- Wu Q, et al. Facile synthesis and optical properties of prussian blue microcubes and hollow Fe2O3 microboxes. Mater Sci Semicond Process. 2015;30:476–481.
- Kadam S, et al. Electrodeposition of Fe2O3 nanoparticles and its supercapacitive properties. in AIP Conference Proceedings. 2016. AIP Publishing LLC.
- Bashir A, et al. Investigation of electrochemical performance of the biosynthesized α-Fe2O3 nanorods. Surfaces and Interfaces. 2019;17:100345.
- Wang Q, et al. Fabrication of direct Z-scheme α-Fe2O3/FeVO4 nanobelts with enhanced photoelectrochemical performance. ChemistrySelect. 2018;3(2):809–815.
- Gabrielyan L, et al. Effects of iron oxide (Fe3O4) nanoparticles on Escherichia coli antibiotic-resistant strains. J Appl Microbiol. 2019;126(4):1108–1116.
- Sathishkumar P, et al. Anti-acne, anti-dandruff and anti-breast cancer efficacy of green synthesised silver nanoparticles using Coriandrum sativum leaf extract. J Photochem Photobiol B. 2016;163:69–76.
- Huang J, et al. Bioinspired heteromultivalent Chitosan-α-Fe2O3/Gadofullerene hybrid composite for enhanced antibiotic-resistant bacterial pneumonia. J Biomed Nanotechnol. 2021;17(6):1217–1228.