
 ?Mathematical formulae have been encoded as MathML and are displayed in this HTML version using MathJax in order to improve their display. Uncheck the box to turn MathJax off. This feature requires Javascript. Click on a formula to zoom.
Abstract
Statistical approaches have been established for optimizing fermentation practices and because of encouraging outcomes of these methods, several industries are harmonising in using them for maximum productivity of biological metabolites. Statistical methods are feasible and reliable in performing experiments and analysing results as compared to conventional bioprocessing methodologies. Similarly, strain improvement is also a significant strategy. In the current study, combinatorial approach that involves combining of classical mutagenesis and statistical optimization is attempted to scale-up productivity levels of dextransucrase. Enzyme productivity increased 2.56-fold as compared to wild-type. Plackett-Burman design revealed fermentation temperature, sucrose and peptone concentrations as significant factors. Response surface methodology further enhanced enzyme yield from 29.2 DSU ml−1 to 96.9 DSU ml−1. Overall results revealed remarkable improvement in dextransucrase yield (8.5-fold) depicting significance of currently designed combinatorial approaches. Dextran was produced after this statistically proven approach and based on its structural features its diversified applications are suggested.
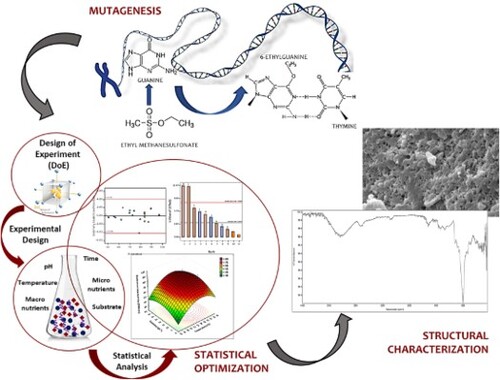
GRAPHICAL ABSTRACT
1. Introduction
Dextran is an alpha-glucan homopolysaccharide secreted by dextransucrase-producing lactic acid bacteria such as Leuconostoc, Weissella, Streptococcus, Pediococcus and Lactobacillus species [Citation1,Citation2]. Dextran biosynthesis is the result of the biocatalytic performance of dextransucrase [E.C. 2.4.1.5] by transferring the glucose moiety from sucrose to the reducing end of the growing dextran chain. The branching pattern and linkages of the synthesized polymer depend on the producing lactic acid bacterial genus [Citation3]. Dextran, biosynthesized by Weissella species, is more linear in structure and predominantly contain higher α-1,6 linkages with rare α-1,3 branches [Citation4]. Dextran has garnered special attention for its various industrial applications. In the food industry, it is used as an additive to improve the solidification and textural properties of dairy and other fermented food products [Citation5,Citation6]. Dextran modulates the growth of gut microbiota including Prevotella, Bacteroides, Bifidobacterium lactis, Bifidobacterium infantis and Lactobacillus acidophilus and can be used as a prebiotic [Citation7,Citation8]. Dextran hydrogels are also prepared by crosslinking the polymer with different functional groups and are used for different biomedical applications [Citation9–11]. Recently, a dextran-based nanohybrid system was developed as a drug delivery system for the treatment of cancer [Citation12]. Dextran hydrogels are also used for biosensors [Citation13]. In another study, dextran-based cationic amphiphilic hydrogels were prepared and used for dye adsorption [Citation14]. According to a report, the annual worldwide production of dextran is around 2000 tonnes to 100,000 tonnes [Citation15]. The productivity cost as and properties of a polymer are significantly influenced by different upstream processing, bioprocessing and downstream processing conditions. An efficient approach requires new microbial innovation technologies to obtain the high titre at an economically viable cost, suitable for industrial applications. Different mathematical modelling strategies have been proposed to improve the biocatalyst efficiency without any significant increase in capital outlay [Citation16,Citation17]. Among various techniques, improvement in microbial strain is considered the most substantial and major prerequisite for enhanced metabolite production.
Strain improvement generally involves genetic alterations by mutagenesis followed by selection, screening and optimization of fermentation parameters to generate a hyper-productive strain. Mutagenesis is a highly effective and conventional tool for strain improvement because microbes are usually unable to produce commercial products in high titers [Citation18]. A mutation is often synergistically performed with statistically designed fermentation experiments to allow the maximum expression of the mutant strain. Optimization of fermentation conditions is necessary to ensure that all the essential components are present in the medium at a non-inhibitory concentration. Among the optimization techniques, the design of experiment (DoE) has gained attention due to its accuracy and efficiency in bioproduct synthesis. DoE is a multivariate approach that requires fewer experimental runs for the screening of significant factors, it can also compute the interactions and estimate the optimum conditions for the fermentation factors [Citation19]. Classical DoE design includes full factorial, fractional factorial, Plackett-Burman design (PBD), Taguchi’s method and Response Surface Methodology (RSM). Among them, PBD and RSM are considered the most effective approaches and are frequently used for analyzing more variables.
For the improvement of dextransucrase and dextran yield, similar classical mutagenesis and optimization strategies have been employed previously using different lactic acid bacterial strains. However, the majority of the studies focused are either related to the mutational analysis of Leuconostoc species or the statistical optimization of Leuconostoc and Weissella species [Citation20,Citation21]. No related information is available regarding the combined effect of mutagenesis and statistical optimization on dextransucrase biosynthesis by Weissella species. Therefore, in the current study, the microbial strain was first exposed to mutational analysis and further followed by statistical optimization of dextransucrase biosynthesis for the mutant strain to improve and facilitate the upstream bioprocessing of dextransucrase. Dextran produced was also analyzed.
2. Materials and methods
2.1. Microorganism used and culture conditions
Weissella confusa KIBGE-IB38 [GenBank Accession Number: KY411713] used in the current study was indigenously isolated and identified based on polyphasic characteristics [Citation22]. The culture was stored in 15% glycerol at −20°C. Sub-culturing was carried out after every two weeks on tomato juice agar slants (yeast extract, 1.0%; tomato juice extract 20.0% with pH 7.5) and maintained at 4°C.
The inoculum was prepared by transferring the culture into a basal medium which consists of (gL−1): sucrose, 20.0; yeast extract, 5.0; peptone, 5.0; dipotassium hydrogen phosphate, 15.0; calcium chloride, 0.05; sodium chloride, 0.01; magnesium sulphate, 0.01 and manganese chloride, 0.01. Then, 10% of the inoculum was transferred to a fermentation flask of the same medium and incubated at 25°C for 08 h. The pH of the fermentation medium was adjusted to 7.5 before autoclaving at 121°C for 15 min.
2.2. Mutation and screening for dextransucrase production
For mutagenesis, bacterial cells were cultivated in the above-mentioned basal medium but containing glucose (10.0 gL−1) instead of sucrose (20.0 gL−1) and incubated for 06 h (log phase) at 25°C. After incubation, bacterial cells were harvested at 40,000 × g for 10 min at 4°C. The cell pellet was washed twice and re-suspended in sterilized normal saline. The optical density (O.D) of the bacterial culture was measured spectrophotometrically at 600 nm and adjusted to 6 × 10⁸ CFU ml−1 with McFarland standard. The cell suspension (1.5 ml) was mixed with 0.4 ml ethyl methanesulfonate (377 mM) and kept for different intervals of 5, 15, 30, 45, 60, 120, 180 and 240 min at 25°C for mutagenesis. Then an equal volume of the freshly prepared filter-sterilized sodium thiosulphate (10%) was added to quench the reaction of ethyl methanesulfonate (EMS) [Citation23]. The treated cells were serially diluted up to a factor of 10−6. The dilutions of 10−4, 10−5 and 10−6 were plated onto glucose (2.0 gL−1) containing agar plates and incubated at 25°C for up to 48 h. After mutation, EMS variant colonies were selected and tested both qualitatively and quantitatively for dextransucrase production. Initially, the mutants were screened by transferring the bacterial cells into 100 gL−1 sucrose-containing medium and analyzed visually by turbidity of the medium. Later, for quantitative analysis, an enzyme activity assay was performed. The mutants, which showed higher dextransucrase yield, were selected, and sub-cultured repeatedly several times to check and confirm the enzyme production efficiency. Among them, the mutant, which exhibited maximum dextransucrase production, was selected for subsequent experimental studies.
2.3. Computational techniques
After successful mutational analysis, fermentation conditions for the selected mutant strain of W. confusa KIBGE-IB38M17 were statistically optimized using a multivariate approach.
2.3.1. Plackett-Burman design (PBD)
Plackett-Burman was performed to screen the nine fermentation parameters: time, temperature, sucrose, pH, yeast extract, peptone, dipotassium hydrogen phosphate, sodium chloride and calcium chloride. Along with these, two dummy variables were also part of the experimental work for the estimation of error. In PBD, a 12-run experimental model was constructed by evaluating the “n” variables in the “n + 1” experimental trial. All the independent variables were set at high (1) and low (−1) levels. The levels of the experimental variables were selected based on the results of our preliminary performed one-factor-at-a-time (OFAT) optimization studies [Citation22]. The coded values of all the variables and their levels are elaborated in Table . The experimental data were fitted to the first-order polynomial equation:
(1)
(1)
Table 1. Experimental ranges and coded levels of independent variables for dextransucrase production.
where Y denotes the response or dextransucrase activity; βo, shows the model intercept; βi, is the linear coefficient and Xi represents the level of the independent variables. The effect of each independent variable is the difference between the average response at low and high levels and is calculated using the following equation:
(2)
(2)
E(Xi) represents the effect of the variables; Pi + and Pi- show the response of dextransucrase yield for the trials in which variables are set at high and low levels, respectively, and n is the total number of experimental runs. For the estimation of experimental error, variances among dummy variables were also estimated:
(3)
(3)
Veff represents the variance of the effect; Ed shows the effect of the dummy variables and n is used for the total number of dummy variables [Citation24].
2.3.2. Response surface methodology
After preliminary screening of fermentation variables for dextransucrase production, response surface methodology through central composite design (CCD) was performed to study the optimized levels of the selected variables for enhanced enzyme yield. In CCD, a 20-run experiment was conducted with three selected variables (fermentation temperature, sucrose, peptone) from PBD at five levels. The levels are based on the 8 factorial (1, −1),6 centre (0) and 6 axial (1.68, −1.68) points in all the experimental trials. The results obtained from these experiments are fitted and analyzed through a second-order polynomial model:
(4)
(4) where Y represents response or dextransucrase yield; β0, is the model interception; βi, is the linear coefficient; βii, is the squared coefficient; βij shows the interaction coefficient, whereas Xi and Xj are the coded levels of independent variables. To validate the authenticity of the response surface model, a confirmatory experiment was carried out under the optimized conditions which are predicted by the model.
2.4. Dextran production
For dextran production, bacterial fermentation was carried out by the biocatalysis of dextransucrase under the statistically optimized conditions (sucrose, 100.0 gL−1 instead of 10.0 gL−1), utilizing the mutant strain of Weissella confusa KIBGE-IB38M17. The dextran produced was purified by ethanol precipitation following the earlier described method [Citation25].
2.5. Scanning electron microscopy (SEM)
SEM was performed to study the topological characteristics of dextran. The dried sample of dextran was applied to the stub of SEM with double-sided tape and targeted with gold (Au) particles up to 300 Å on an auto coater (JFC-1500, Jeol Japan). The topological characteristics of the coated sample were studied using a scanning electron microscope (JSM-6380A, Jeol Japan) under different magnification powers at 10.0 kV.
2.6. Fourier-transform infrared (FTIR) spectroscopy
The FTIR spectra of dextran were recorded using a Thermo Nicolet™ iS™ 5 FTIR spectrophotometer coupled with an iD 5 ATR accessory featuring a Zinc Selenide (ZnSe) lens with a fixed incidence angle of 42°. OMNIC software was used for collecting the spectra of dextran. The FTIR spectrum was scanned in the spectral range from 4000 to 550 cm−1 using 128 scans with a resolution of 4 cm−1.
2.7. Statistical analysis
Design-Expert® software (Version 10, Stat-Ease Inc., USA) was used for the statistical modelling and data analysis. Contour plots and three-dimensional surface plots were generated with STATISTICA® (Version 10.0, StatSoft Inc., Tulsa, USA). These plots were computed to find out the effect of different interactions on the response. One-way analysis of variance (ANOVA) and Tukey’s post hoc test were performed with P < 0.05. All the experimental work was carried out in triplicates and the mean values were reported.
2.8. Analytical method
The culture supernatant was harvested at 40,000 × g for 15 min at 4°C. Enzyme activity assay was performed by incubating the enzyme (50 µl) with 0.1 M citrate phosphate buffer (pH 5.0) containing sucrose (365 mM) as the substrate at 35°C for 15 min. The amount of reduced sugar was estimated, as described previously [Citation26]. One unit of dextransucrase activity was defined as the amount of enzyme required to convert 1.0 mg of sucrose into fructose and dextran per hour under standard assay conditions at 35°C and pH 5.0.
3. Results and discussion
3.1. Mutagenesis for the enhanced production of dextransucrase
Improvement of microbial strains provides economic feasibility for commercial applications of biological products during upstream bioprocessing. Several mutational analysis techniques, including random mutagenesis and site-directed mutagenesis, have been reported to enhance the biosynthesis of microbial metabolites [Citation16,Citation20]. Among different approaches, mutagenesis through chemical mutagenic agents, includingN-methyl-N′-nitro-N-nitrosoguanidine (NTG), ethyl methanesulfonate (EMS) and ethidium bromide, is a cost-effective and widely used method of choice [Citation27,Citation28].
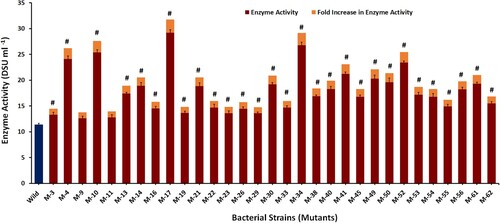
In the current study, wild-type W. confusa KIBGE-IB38 was exposed to EMS for different time intervals to induce the production of dextransucrase. The bacterial colonies not exposed to EMS were considered as control. The results revealed that the plates of 10−5 diluent showed colonies in the countable range and were thus selected. The percent survival rate of the mutants was estimated with respect to the wild-type strain. With an increase in the exposure time the multiplication of the bacterial cells gradually decreased, and no colony was observed after 60 min of exposure with EMS. The bacterial survival rate of the mutants generated was 67%, 36%, 19%, 9% and 1% after 5, 15, 30, 45 and 60 min, respectively. Initially, 120 mutant colonies were randomly picked from the plates of all the dilutions followed by a two-stage screening procedure for dextransucrase productivity. In the first stage, 84 colonies were primarily selected from these 120 colonies, by qualitatively testing in a sucrose (100 gL−1)-containing medium. In the second stage, the dextransucrase production of these selected EMS variants was quantitatively detected by enzyme activity assay and was compared with that of the wild-type strain. The results revealed that out of 84 mutants, 31 mutants expressed elevated dextransucrase levels, 09 showed the same enzyme activities, whereas the remaining 44 colonies showed lower enzyme titre as compared to the wild type. The 31 mutants, which exhibited higher enzyme activities, were sub-cultured repeatedly in a dextransucrase production medium to further confirm the stability of the mutants. After repeated sub-culturing, all 31 mutants retained their enzyme-synthesizing abilities. The dextransucrase yield of these selected 31 colonies is represented in Figure . A significant increase in enzyme activity was observed in M-17, exhibiting a 2.56-fold increase in dextransucrase yield to 29.2 DSU ml−1 in comparison to the wild-type strain (11.4 DSU ml−1). This selected hyper-secretory mutant strain was now designated as W. confusa KIBGE-IB38M17.
Figure 1. Dextransucrase productivity by wild and mutant strains of Weissella confusa KIBGE-IB38. Tukey’s test was performed. # represents a significant difference as compared to the wild with P < 0.001.
In this study, EMS was an enhancer for dextransucrase production. The alteration in enzyme productivity might be due to EMS, since EMS is an ethylating agent, it reacts with the O6 of guanine and forms a complex of O6-ethylguanine. This complex binds with the thymine instead of cytosine during the replication and substitutes nucleotide [Citation29]. Iliev et al., [Citation30] reported the potential mutagenic effects of EMS on dextransucrase yield using Leuconostoc mesenteroides strain Lm 28. Some other classical mutagenic approaches have also been reported for enhanced dextransucrase production by L. mesenteroides using UV irradiation [Citation31]. The wild-type strain of L. mesenteroides had an enzyme yield of 12 DSU ml−1 h−1, whereas the mutant type exhibited a yield of 81 DSU ml−1 h−1, with the enhancement of 6.75 times[Citation20]. Dextransucrase from Pediococcus pentosaceus exhibited 72% enzyme production, with an increase in the specific activity of 0.58 U mg−1 from wild-type strain to 1.0 U mg−1 from the mutant type [Citation32]. In a previous report, a 46% higher dextransucrase yield with 0.55 U mg−1 from wild type as compared to 0.8 U mg−1 from mutant stain was observed after UV mutation by L. mesenteroides NRRL B-640 [Citation33]. The current findings suggest that EMS could also be used for improved production of dextransucrase from a mutant strain of W. confusa as it produced 96.9 DSU ml−1 equivalent to 5.05 U mg−1 which is much higher than the previously reported enzyme activities for dextransucrase.
3.2. Multivariate approach for hyper-production of dextransucrase from W. confusa KIBGE-IB38M17
Industrially, an efficient bioprocessing protocol requires the use of effective, feasible and easily maintained culture conditions to scale up the productivity of the microbial products. Optimization techniques provide favourable conditions to microbial cell factories for their growth and metabolite production; however, optimization of multiple parameters is not an easy task and requires excessive wet-lab experimentation. Several optimization approaches, including one-factor-at-a-time [Citation34], self-directing optimization [Citation35] and statistical optimization protocols [Citation36], have been explored. Every approach has its own advantages and drawbacks; therefore, the optimization protocol should be selected very carefully depending upon the type of metabolite and the microbial culture used. Hence in the current study after strain improvement, fermentation parameters of the hyper-secretory mutant strain of W. confusa KIBGE-IB38M17 were statistically optimized to improve its dextransucrase productivity. Researchers have also used these statistical approaches to optimize the fermentation parameters for dextransucrase production [Citation37,Citation38]. But none of them is related to the optimized production of dextransucrase from the mutant strain of W. confusa.
3.2.1. Screening of fermentation variables using Plackett-Burman design
PBD was conducted to determine the significance of fermentation parameters on dextransucrase production. The fermentation parameters include different environmental (time, temperature, pH) and nutritional variables (sucrose, yeast extract, peptone, dipotassium hydrogen phosphate, sodium chloride and calcium chloride). PBD was adopted in this study because it screens a large number of variables in fewer experimental runs as compared to other approaches such as full factorial or fractional factorial design [Citation39]. The designed experiment of Plackett-Burman was according to the Design Expert® software, which is elaborated in Table . In this table, each row represents an experimental run and each column specifies an independent or dummy variable. To reduce the effect of dummy variable experiments were conducted in a randomized manner. The obtained experimental results explained a wide range of variations in enzyme production ranging from 10.40 to 64.20 DSU ml−1 in all 13 experimental trials. The variation in enzyme productivity depicted the importance of employing a multifactorial design for dextransucrase production. For statistical interpretation, analysis of variance (ANOVA) was applied and the factors with P < 0.05 were considered significant. Along with this, the Pareto chart was also constructed to determine the magnitude and importance of the effect of each independent variable on the response (Figure ). Normally, the Pareto chart estimates the absolute value based on the effect of the variable and predicts two reference lines (Bonferroni limit and t-value limit) then, these reference lines characterize the significance of the factors [Citation40]. The results of the statistical analysis revealed that in the current PBD model, four independent variables, including fermentation temperature (0.0056), sucrose (0.027), peptone (0.0059) and yeast extract (0.0376), exhibited a significant P-value (P < 0.05). Among these four experimental variables, factors B (temperature), C (sucrose) and F (peptone) exerted a positive impact on the response, suggesting that high levels of these variables the yield of dextransucrase increases. Whereas, factor E (yeast extract) showed a negative standardized effect, demonstrating that at a high concentration level of yeast extract, the dextransucrase response decreases. It was previously reported that the factors that have exerted a positive effect on the response are further selected for optimization studies [Citation17,Citation41]. Therefore, in this study, temperature, peptone and sucrose concentrations were considered for RSM as they are the most significant factors with a positive impact on the dextransucrase yield.
Figure 2. Pareto chart illustrating the effect of independent variables on dextransucrase production (the blue colour represents a negative effect and the orange colour represents a positive effect).
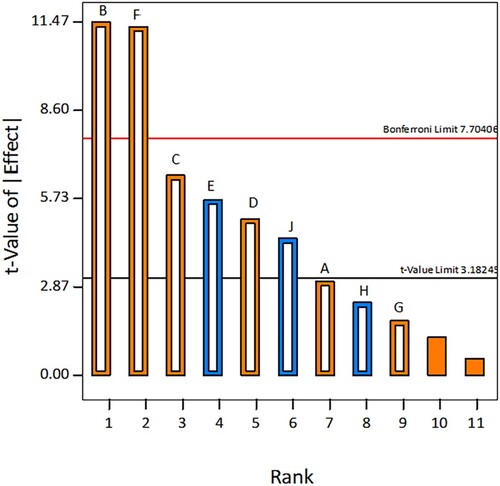
Table 2. Plackett-Burman experimental design of independent variables with the experimental and predicted values for dextransucrase production.
In other reports, similar results were also stated for dextransucrase production by Leuconostoc and Weissella species [Citation42,Citation43]. Some of the significant factors which are highly associated with the growth of the microbial cells as well as the production of the enzymes are the carbon and nitrogen sources used during the fermentation process. Dextransucrase, an extracellular inducible enzyme, generally requires sucrose as a specific substrate for its enzymatic activity. During the production of dextransucrase, sucrose is considered one of the most important carbon sources for enzyme production from Weissella species [Citation3]. Here, sucrose acts as an enzyme inducer and fructose and glucose released after catalysis are also used by the microbial cells for their cultivation. Therefore, this factor is more significant than other chemical and physical fermentation parameters. Peptone was incorporated as a nitrogen source in the fermentation medium as it also facilitates cell multiplication and bacterial cultivation. Fermentation temperature is also one of the most important physiological parameters for cell multiplication as well as the production and stability of the enzyme. As if this physical parameter is changed beyond the optimal range, then the bacterial cell multiplication rate is either lowered or halted. Because of a slight shift in temperature, it will also slow down the bacterial log phase, thus ultimately inhibiting the enhanced enzyme production.
The model equation used in this study, which demonstrated the effect of each independent variable, is as follows:
(5)
(5) where Y is the response or dextransucrase production; A, B, C, D, E, F, G, H and J represent the independent variables and their coefficients represent the effect of each variable on the response.
Regression analysis was carried out for statistical interpretation of the currently designed PBD model (Table ). The results revealed that the model is significant with the coefficient of determination (R2value) of 0.981, exhibiting that 98.1% variability in the response is explained by the experimental variables of the model and there is only a negligible chance that this large value could be due to the experimental noise. The correlation coefficient values of adjusted R2 (0.924) and predicted R2 (0.784) exhibited a strong agreement between experimental and predicted values. Whereas the low coefficient of variance (C.V.) of 11.17, advocates the higher reliability of this model. Adequate precision was used to estimate the signal (S) to noise (N) ratio and the S/N value of 15.62 demonstrates an adequate signal. The small value of PRESS (Predicted Residual Error Sum of Square) also displayed the better fitness of the current experimental design. The obtained data authenticated the model and advocated that a response surface design could be further used for the optimization of dextransucrase production with the selected variables of the PBD.
Table 3. ANOVA of Plackett-Burman design for dextransucrase production.
3.2.2. Optimization of selected fermentation variables using RSM
The combined effect of three independent variables (fermentation temperature, sucrose and peptone concentrations) was estimated by a central composite design. CCD is one of the most widely used types of RSM [Citation44]. In CCD, the selected significant factors were set at five different levels (−1, 1, 0, 1.68 and −1.68). The designed matrix and their respective experimental and predictive values are represented in Table . The results of the experimental values showed variation in dextransucrase yield (50.50 DSU ml−1 to 96.90 DSU ml−1) in all twenty experimental runs, demonstrating the significance of the selected statistical strategy. Quadratic regression analysis of variance (ANOVA) was applied to the experimental data and the results were analyzed based on the following second-order polynomial equation:
(6)
(6)
Table 4. Central composite experimental design of independent variables including the coded levels, actual values, predicted values and residuals for dextransucrase production.
where Y represents the response and X1, X2, and X3 correspond to the coded independent variables for dextransucrase productivity.
F-value (17.23) and P-value (0.0195) were considered significant and exhibited the model adequacy. Lack of fit was also calculated. Generally, it is a diagnostic tool for testing the significance of pure error and lack of fit error. Pure error is based on the repetition of the experimental measurements, whereas lack of fit relies on the performance of the model. In most cases, the significance of lack of fit is estimated through F-value and a non-significant value is most probably desirable [Citation45]. In the current study, the non-significant Prob > F value of 0.1481 exhibited the validity of the experimental model (Table ). R2 value is 0.9993 authenticating the 99.93% variability in the model. The coefficient of variance was also estimated. It is the degree of precision with which the results are compared. Normally, the higher value of the coefficient of variance exhibits less reliability of the model. However, in the current model the coefficient of variance is lower (0.62%) and advocates high reliability for the model (Table ).
Table 5. ANOVA of central composite model for dextransucrase production.
3.2.3. Diagnostic plots
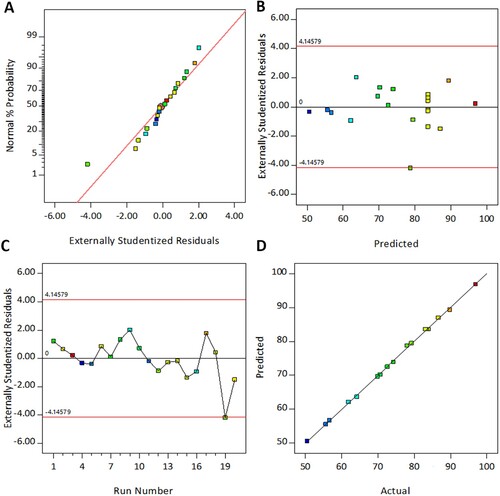
To validate the assumption of analysis of variance (ANOVA) and confirms the adequacy of the model, four diagnostic plots were constructed. Figure A illustrates the normal probability plot of the residuals. In general, residual analysis is an efficient tool for assessing the model validity and residual is the difference between the experimental and theoretical values for the response [Citation46]. Figure A represents that the residuals of the present model are distributed normally and follow a straight line, thus, fulfilling the normal distribution assumption. The graphical relationship between the residuals and the predicted value is displayed in Figure B. This plot shows that all the residuals are randomly scattered in the upper and lower bounds and verifies the homoscedasticity assumption. Whereas, in Figure C, graphs of residuals versus experimental run indicate that all the residual points are randomly spread in the upper and lower bound and do not exhibit any particular pattern, therefore, satisfying the independent assumption. For further confirmation, the actual and predicted values for dextransucrase production were plotted. In this plot, the distribution of the data close to the straight line indicates better fitness of the experimental values with that of the software-generated theoretical results (Figure D). Hence, all the diagnostic plots met the assumptions of analysis of variance and authenticated the model.
Figure 3. Diagnostic Plots for dextransucrase production. (A) Normal probability plot of residuals (B) Residuals vs. Predicted values (C) Residuals vs. Experimental runs (D) Actual vs. Predicted values.
3.2.4. Response surface plots of the independent variables
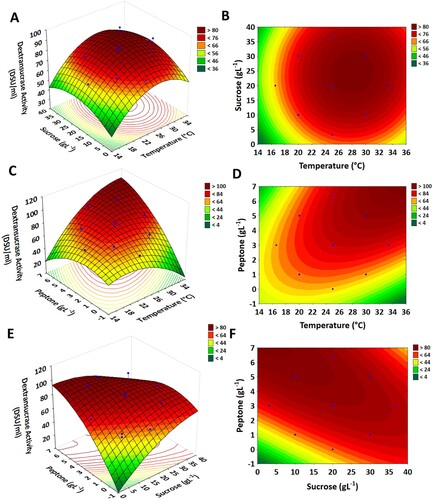
Three-dimensional response surface and contour plots were generated to determine the effect of interaction between the independent variables and their impact on the response. Figure A illustrates the correlation between fermentation temperature (X1) and sucrose concentration (X2). The surface plot was constructed by ranging X1 and X2 from the highest to the lowest range while keeping peptone concentration (X3) at the median level. A gradual increase in enzyme production was noticed by elevating temperature and sucrose concentrations at optimum points (30 gL−1 and 30°C). Further increase resulted in a decrease in enzyme production response. Because of the high amount of sucrose in the fermentation medium increases the viscosity of the medium and causes a substrate-inhibitory action. Also, at higher concentrations, the multiplication of bacterial cells is reduced which affects the yield of the enzyme. Whereas, at higher temperature ranges an adversarial effect on enzyme yield was noticed which might be due to the denaturation of heat-sensitive enzymes and proteins. Similarly, in other studies, low temperature favours the dextransucrase production, while at higher temperature a decline in enzyme yield was noted. Weissella cibaria JAG8 attained maximum enzyme yield (5.8 U ml−1) at 24°C with an incubation period of 12 h [Citation42]. Moreover, the interaction between these two variables (fermentation temperature and sucrose) was non-significant as shown by the circular contour lines and a non-significant probability value (P = 0.0594). Figure B depicts the interaction of peptone with fermentation temperature. Peptone is a source of amino acids, peptides and proteins in the fermentation medium. The effect of peptone concentration on dextransucrase productivity was tested and it was found that peptone is a significant factor in dextransucrase production. The interactive effect between peptone and temperature was positive (synergistic) in nature as shown by the regression equation coefficient (+7.33). In the case of increasing the peptone concentration and temperature range, an increment in enzyme yield up to a certain point was observed. Thereafter, the decrease in enzyme yield might be due to the alteration in microbial cell wall hydrophobicity as it is affected by the presence or absence of the peptone in the fermentation medium. In addition, higher peptone concentration can also induce the production of various proteolytic enzymes which can further inhibit the production of dextransucrase. Whereas, in the case of peptone and sucrose, a higher dextransucrase activity was observed at their higher concentrations (Figure C).
Figure 4. Contour and three-dimensional response surface plots showing the effect of independent variables on dextransucrase production. (A and B) temperature vs. sucrose (C and D) temperature vs. peptone (E and F) sucrose vs. peptone.
3.2.5. Validation of the experimental model
The optimum conditions of the fermentation variables for dextransucrase production estimated by RSM were temperature (X1): 30°C, sucrose (X2): 10.0 gL−1 and peptone (X3): 5.0 gl−1. Under these optimized conditions, the theoretically predicted value of the dextransucrase production was 96.84 DSU ml−1. To verify the prediction of the currently designed RSM model, a confirmatory experiment was carried out in triplicates under the above-optimized conditions and the mean value obtained by this was 95.11 DSU ml−1. This result thus validated the 98% authenticity of the current RSM model. The obtained results of the optimized model exhibited an approximately 3.3-fold enhancement in dextransucrase production (96.9 DSU ml−1) as compared to enzyme production after mutation in an unoptimized medium (29.2 DSU ml−1). In another study, statistical optimization resulted in a 3.0-fold increase in dextransucrase production from W. confusa Cab3 [Citation47]. Similarly, a significant increase in dextransucrase production was also observed by statistical optimization using Leuconostoc dextranicum B-1146 [Citation48]. In our previous work, a 4.62-fold increase in dextransucrase yield was noted after statistical optimization exploiting wild-type strain of W. confusa KIBGE-IB38 [Citation49]. However, in the current study, the combinatorial strategy of mutation and statistical optimization of the mutant strain of W. confusa KIBGE-IB38M17 revealed a remarkable increase of about 8.5-fold in dextransucrase production.
3.3. Morphological structure studies of dextran
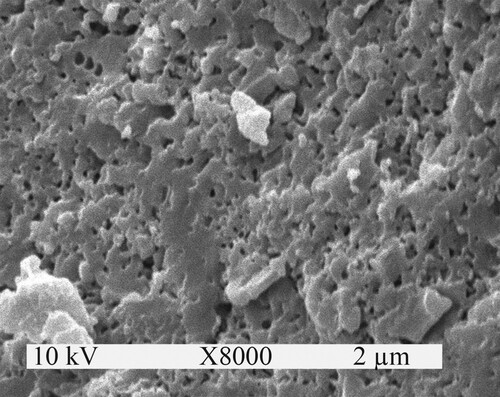
The surface morphology of dextran produced by the biocatalysis of dextransucrase was studied by SEM. Dextran polymer exhibited a compact structure with small pore size distribution (Figure ). The porous structure can hold a substantial amount of water and can be used as an additive in the food industry. The small pore structure may also be responsible for the compactness and stability of the polymer during storage and under extreme environmental conditions. Biopolymers can be exploited using their hydroxyl group that is generally present on the α-1,6 D-glucose residues. The hydroxyl group also increases the crystallinity of the polymers and may also provide compactness and stability to its structure.
Figure 5. SEM analysis of dextran produced by the biocatalysis of dextransucrase.
3.4. Functional group analysis of dextran
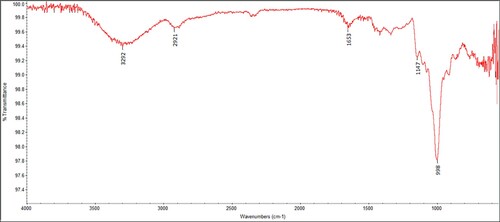
FTIR spectroscopic analysis of dextran was performed to investigate the nature of the functional group present in dextran. Monomeric units and their linkages were identified in the spectral locations between 4000 cm−1 and 550 cm−1. The spectrum of dextran is represented in Figure . The band located at 3292 cm−1 represents hydroxyl stretching, whereas the bands noted in the region of 2921 and 1653 cm−1 are due to the C − H stretching and carboxyl stretching, respectively. The spectrum obtained in the current study exhibited major characteristic peaks reported previously for dextran [Citation28,Citation50–53]. Purified dextran produced from W. confusa KIBGE-IB38 also exhibited all the functional groups, monomeric units and linkages present in the standard commercial-grade dextran procured from sigma [Citation54]. These peaks were noted at different locations in the spectrum. The peak at 1147 cm−1 is due to the valent vibration of the C − O−C bond as well as due to the glycosidic bridge. The peak at 1102 cm−1 represents C − O bond vibration at the C-4 position of D-glucose. The peak at 998 cm−1 represents great chain flexibility around the α-1,6 glycosidic bond. Along with these, three characteristic peaks were also identified at 915, 844 and 817 cm−1 and assigned to the α-1,3-D-glucan. The FTIR spectral analysis revealed that dextran produced from the W. confusa KIBGE-IB38M17 exhibited both the α-1,6 and α-1,3 linkages in its structure.
Figure 6. FTIR spectrum of dextran produced by the biocatalysis of dextransucrase.
4. Conclusion
It is proposed that the multivariate combinatorial approach adopted in the present work, which involves the mutation and statistical optimization of fermentation parameters for Weissella confusa KIBGE-IB38M17, synergistically improved dextransucrase biosynthesis. The results exhibited a significant improvement in dextransucrase yield with 8.5-fold as compared to the wild type (Weissella confusa KIBGE-IB38) under unoptimized conditions. The findings demonstrated that upstream bioprocessing has a crucial impact on dextransucrase production during fermentation and by employing a highly selective combinatorial strategy, the enzyme biosynthesis efficiencies can be improved significantly. Morphological and structural characteristics of dextran were also studied. Further characterization of dextransucrase and dextran from the wild (KIBGE-IB38) and mutant (KIBGE-IB38M17) strains of W. confusa is in progress which would depict its applications.
Disclosure statement
No potential conflict of interest was reported by the author(s).
Additional information
Funding
References
- Wang B, Song Q, Zhao F, et al. Isolation and characterization of dextran produced by Lactobacillus sakei L3 from Hubei sausage. Carbohydr Polym. 2019;223:115111.
- Baruah R, Maina NH, Katina K, et al. Functional food application of dextran from Weissella cibaria RBA12 from pummelo (Citrus maxima). Int J Food Microbiol. 2017;242:124–131.
- Maina HN, Tenkanen M, Maaheimo H, et al. NMR spectroscopic analysis of exopolysaccharides produced by Leuconostoc citerum and Weissella confusa. Carbohydr Res. 2008;343:1446–1455.
- Netsopa S, Niamsanit S, Sakloetsakum D, et al. Characterization and rheological behaviour of dextran from Weissella confusa R003. Int J Polym Sci. 2018;6:1–10.
- Ispirili H, Sagdic O, Yilmaz MT, et al. Physicochemical characterisation of an α-glucan from Lactobacillus reuteri E81 as a potential exopolysaccharide suitable for food applications. Process Biochem. 2019;79:91–96.
- Wang B, Song Q, Zhao F, et al. Purification and characterization of dextran produced by Leuconostoc pseudomesenteroides PC as a potential exopolysaccharide suitable for food applications. Process Biochem. 2019;87:187–195.
- Amaretti A, Bottari B, Morreale F, et al. Potential prebiotic effect of a long-chain dextran produced by Weissella cibaria: an in vitro evaluation. Int J Food Sci Nutr. 2020;71:1–9.
- Tingirikari MJR, Kothari D, Goyal A. Superior prebiotic and physicochemical properties of novel dextran from Weissella cibaria JAG8 for potential food applications. Food Funct. 2014;5:2324–2330.
- Ghaffari R, Salimi-Kenari H, Fahimipour F, et al. Fabrication and characterization of dextran/nanocrystalline β-tricalcium phosphate nanocomposite hydrogel scaffolds. Int J Biol Macromo. 2020;148:434–448.
- O’Connor NA, Jitianu M, Nunez G, et al. Dextran hydrogels by crosslinking with amino acid diamines and their viscoelastic properties. Int J Biol Macromo. 2018;111:370–378.
- Lui V, Qi C, Tao K, et al. Sericin/dextran injectable hydrogel as an optically trackable drug delivery system for malignant melanoma treatment. ACS Appl Mater Inter. 2016;8:6411–6422.
- Tiryaki E, Elalmus YB, İkizler BK, et al. Novel organic/inorganic hybrid nanoparticles as enzyme-triggered drug delivery systems: dextran and dextran aldehyde coated silica aerogels. J Drug Deliv Sci Tec. 2020;56:101517.
- Saftics A, Turk B, Sulyok A, et al. Dextran-based hydrogel layers for biosensors. In: Chandra P, Prakash R, editors. Nanobiomaterial engineering. Singapore: Springer; 2020. p. 139–164.
- Stanciu MC, Nichifor M. Influence of dextran hydrogel characteristics on adsorption capacity for anionic dyes. Carbohydr Polym. 2018;199:75–83.
- Rehm BH. Bacterial polymers: biosynthesis, modifications and applications. Nat Rev Microbiol. 2010;8:578–592.
- Ostafe R, Fontaine N, Frank D, et al. One-shot optimization of multiple enzyme parameters: tailoring glucose oxidase for pH and electron mediators. Biotechnol Bioeng. 2020;117:17–29.
- El-Naggar NEA, El-Shweihy NM, El-Ewasy SM. Identification and statistical optimization of fermentation conditions for a newly isolated extracellular cholesterol oxidase-producing Streptomyces cavourensis strain NEAE-42. BMC Microbiol. 2016;16:1–20.
- Chen XY, Gänzle MG. Site directed mutagenesis of dextransucrase DsrM from Weissella cibaria: transformation to a reuteransucrase. J Agr Food Chem. 2016;64:6848–6855.
- Ortiz GE, Ponce-Mora MC, Noseda DG, et al. Pectinase production by Aspergillus giganteus in solid-state fermentation: optimization, scale-up, biochemical characterization and its application in olive-oil extraction. J Ind Microbiol Biot. 2017;44:197–211.
- Siddiqui NN, Aman A, Qader SAU. Mutational analysis and characterization of dextran synthesizing enzyme from wild and mutant strain of Leuconostoc mesenteroides. Carbohydr Polym. 2013;91:209–216.
- Majumder A, Bhandari S, Purama RK, et al. Enhanced production of a novel dextran from Leuconostoc mesenteroides NRRL B-640 by response surface methodology. Ann Microbiol. 2009;59:309–315.
- Zafar SB, Siddiqui NN, Shahid F, et al. Bioprospecting of indigenous resources for the exploration of exopolysaccharide producing lactic acid bacteria. J Genet Eng Biotechnol. 2018;116:17–22.
- Smith MR, Zahnely J, Goodman N. Glucosyltransferase mutants of Leuconostoc mesenteroides NRRL B-1355. Appl Environ Microb. 1994;60:2723–2731.
- Vidal RF, Martínez A, Moulis C, et al. A novel dextransucrase is produced by Leuconostoc citreum strain B/110-1-2: an isolate used for the industrial production of dextran and dextran derivatives. J Ind Microbiol Biot. 2011;38:1499–1506.
- Sarwat F, Qader SAU, Aman A, et al. Production and characterization of a unique dextran from an indigenous Leuconostoc mesenteroides CMG713. Int J Biol Sci. 2008;4:379–386.
- Kobayashi M, Matsuda K. The dextransucrase isoenzymes of Leuconostoc mesenteroides NRRL B-1299. Biochim Biophys Acta. 1974;370:441–449.
- Liu YF, Hsieh CW, Chang YS. Effect of acetic acid on ethanol production by Zymomonas mobilis mutant strains through continuous adaptation. BMC Biotechnol. 2017;17:1–10.
- Shukla R, Shukla S, Bivolarski V, et al. Structural characterization of insoluble dextran produced by Leuconostoc mesenteroides NRRL B-1149 in the presence of maltose. Food Technol Biotech. 2011;49:291–296.
- Hartman PS, Barry J, Finstad W, et al. Ethyl methanesulfonate induces mutations in Caenorhabditis elegans embryos at a high frequency. Mutat Res-Fund Mol M. 2014;766:44–48.
- Iliev I, Vassileva T, Ignatova C, et al. Gluco-oligosaccharides synthesized by glucosyltransferases from constitutive mutants of Leuconostoc mesenteroides strain Lm 28. J Appl Microbiol. 2008;104:243–250.
- Dols M, Remaud-Simeon M, Monsan PF. Dextransucrase production by Leuconostoc mesenteroides NRRL B-1299 comparison with L. mesenteroides NRRL B-512F. Enzyme Microb Tech. 1997;20:523–530.
- Kothari D, Tyagi A, Patel S, et al. Dextransucrase from the mutant of Pediococcus pentosaceus (PPm) is more stable than the wild type. 3 Biotech. 2011;1:199–205.
- Agrawal M, Shukla R, Goyal A. UV-mutagenesis of Leuconostoc mesenteroides NRRL B-640 for generation of a mutant (B640M) with hyper-producing dextransucrase activity. Curr Trends Biotechnol Pharm. 2011;5:1445–1453.
- Satapathy S, Soren JP, Mondal KC, et al. Industrially relevant pectinase production from Aspergillus parvisclerotigenus KX928754 using apple pomace as the promising substrate. J Taibah Univ Sci. 2021;15:347–356.
- Felse PA, Panda T. Self-directing optimization of parameters for extracellular chitinase production by Trichoderma harzianum in batch mode. Process Biochem. 1999;34:563–566.
- Leonard J, Seth B, Sahu BB, et al. Statistical optimization for enhanced bacoside A production in plant cell cultures of Bacopa monnieri. Plant Cell Tiss Org. 2018;133:203–214.
- Abedin RM, El-Borai AM, Shall MA, et al. Optimization and statistical evaluation of medium components affecting dextran and dextransucrase production by Lactobacillus acidophilus ST76480. 01. Life Sci J. 2013;10:1346–1353.
- Singh A, Majumder A, Goyal A. Artificial intelligence-based optimization of exocellular glucansucrase production from Leuconostoc dextranicum NRRL B-1146. Bioresour Technol. 2008;99:8201–8206.
- Miller A, Sitter RR. Using the folded-over 12-run Plackett-Burman design to consider interactions. Technometrics. 2012;43:44–55.
- Vaidya R, Vyas P, Chhatpar HS. Statistical optimization of medium components for the production of chitinase by Alcaligenes xylosoxydans. Enzyme Microb Tech. 2003;33:92–96.
- Kholi P, Sharma N, Gupta R. Statistical optimization of production conditions of alkaline pectin lyase from Bacillus cereus using response surface methodology. Biocatal Biotransfor. 2017;35:417–426.
- Rao TJM, Goyal A. A novel high dextran yielding Weissella cibaria JAG8 for cereal food application. Int J Food Sci Nutr. 2013;64:346–354.
- Shukla S, Goyal A. Development of efficient fermentation process at bioreactor level by Taguchi's orthogonal array methodology for enhanced dextransucrase production from Weissella confusa Cab3. Adv Microbiol. 2012;2:277–283.
- Izevbekhai OU, Gitari WM, Tavengwa NT, et al. Application of synthesized acetylated silica in the remediation of oily wastewater. J Taibah Univ Sci. 2020;14:1033–1041.
- Noordin MY, Venkatesh VC, Sharif S, et al. Application of response surface methodology in describing the performance of coated carbide tools when turning AISI 1045 steel. J Mater Process Tech. 2004;145:46–58.
- Amdoun R, Khelifi L, Khelifi-Slaoui M, et al. Optimization of the culture medium composition to improve the production of hyoscyamine in elicited Datura stramonium L. hairy roots using the response surface methodology (RSM). Int J Mol Sci. 2010;11:4726–4740.
- Shukla S, Goyal A. Optimization of fermentation medium for enhanced glucansucrase and glucan production from Weissella confusa. Braz Arch Biol Techn. 2011;54:1117–1124.
- Majumder A, Goyal A. Enhanced production of exocellular glucansucrase from Leuconostoc dextranicum NRRL B-1146 using response surface method. Bioresource Technol. 2008;99:3685–3691.
- Zafar SB, Asif T, Qader SAU, et al. Enhanced biosynthesis of dextransucrase: a multivariate approach to produce a glucosyltransferase for biocatalysis of sucrose into dextran. Int J Biol Macromol. 2018;115:776–785.
- Siddiqui NN, Aman A, Silipo A, et al. Structural analysis and characterization of dextran produced by wild and mutant strains of Leuconostoc mesenteroides. Carbohydr Polym. 2014;99:331–338.
- Wang T, Deng L, Li S, et al. Structural characterization of a water-insoluble (1→ 3)-α-D-glucan isolated from the Penicillium chrysogenum. Carbohydr Polym. 2007;67:133–137.
- Zhang P, Zhang L, Cheng S. Chemical structure and molecular weights of α-(1→ 3)-D-glucan from Lentinus Edodes. Biosci Biotech Bioch. 1999;63:1197–1202.
- Seymour FR, Julian RL, Jeanes A, et al. Structural analysis of insoluble D-glucans by Fourier-transform infrared difference-spectrometry: correlation between structures of dextrans from strains of Leuconostoc mesenteroides and of D-glucans from strains of Streptococcus mutans. Carbohyd Res. 1980;86:227–246.
- Aman A, Siddiqui NN, Qader SAU. Characterization and potential applications of high molecular weight dextran produced by Leuconostoc mesenteroides AA1. Carbohydr Polym. 2012;87:910–915.