
 ?Mathematical formulae have been encoded as MathML and are displayed in this HTML version using MathJax in order to improve their display. Uncheck the box to turn MathJax off. This feature requires Javascript. Click on a formula to zoom.
Abstract
Undoped and doped polyvinyl pyrrolidone/ carboxymethyl cellulose (PVP/CMC: 50/50%) blended polymers with melanin were formed. X-ray diffraction analysis confirmed the amorphous nature of all blends. Scanning electron microscopy results confirmed the smooth and homogeneous surface of the undoped and doped PVP/CMC blend with melanin. The optical parameters and fluorescence spectra of the PVP/CMC blend were investigated as functions of melanin content. The direct optical band gap (Eg) for the used melanin is 2.86 eV. The direct and indirect Eg values for the PVP/CMC blend are 5.1 and (4.9, 3.2) eV, respectively. The direct and indirect Eg values were reduced to (4.5, 3.23) and (2.2, 1.33) eV as the amount of melanin became 3 wt % in the doped blend. The effect of melanin doping on the dielectric constant, dielectric loss, AC conductivity, complex impedance, Nyquist plot of the complex impedance, and electric modulus of the PVP/CMC blend was also studied.
KEYWORDS:
1. Introduction
Polymer blends are used in many industries due to their diverse and beneficial properties.
The enhanced optical, electrical, structural, thermal, and mechanical properties of polymer blends make them ideal for such applications. Doped blended polymers with suitable fillers are considered the most effective method for producing new materials that can be applied in abundant applications, such as household, industry, and military fields [Citation1]. Polyvinyl pyrrolidone (PVP) is an amorphous biodegradable polymer that is soluble in water without toxicity. PVP has excellent electrical, thermal, and transparency features. PVP stores charge differently depending on dopant concentration [Citation2]. Plant fibrous tissue contains semicrystalline polysaccharide cellulose gum (sodium salt-carboxymethyl cellulose; CMC) [Citation3]. PVP and cellulose chitosan form homogenous films easily [Citation2].
Melanin, a natural pigment dispersed in vivo, shields from the sun and has strong wide-band UV–visible absorption [Citation4]. Natural melanin pigments play an imperative role in the antioxidation processes of the human body, animals, and certain types of bacteria [Citation5]. Natural melanin has an optical band gap between 2.8 and 3.2 eV [Citation4]. Recently, scientists demonstrated that the conductivity of melanin, as a photoconductor, is strongly affected by the relative humidity at room temperature. These features qualify melanin for use as a soft solid in electronic applications such as photovoltaic, sensor, and photothermal detectors [Citation5]. The remarkable short-wavelength shielding and high visible light pass features of polymer nanocomposite were easily gained by changing the melanin crystallite size. A reduction in the crystallite size of melanin caused a rise in the UV-shielding and visible light transparency features [Citation1]. Bai et al. increased the optical absorption of melanin-like polymers [Citation6]. The optical properties of the biopolymer PVA were enhanced as it was doped with melanin [Citation7].
The optical bandgap of the CMC–PVP blend was reduced as the amount of nano NiO or Er2O3 doping increased [Citation3,Citation8]. The optical parameters of CMC/PVP films in the THz range were improved as they were filled with nano Zn0.95Al0.05O [Citation2]. Hybrid MWCNTs/Ag nanofiller was used to reinforce a PVP/CMC blend to be used in multifunctional optoelectronic and nanodielectric applications [Citation9]. Bone repair applications used zinc and manganese-substituted hydroxyapatite/CMC/PVP electrospun composites [Citation10]. The linear and nonlinear optical characteristics of the PVA/dye extracted from red-flash leaf films have been tuned by changing the dye amount [Citation11]. As they filled with nano-Y2O3, poly(ethylene glycol)-poly(vinyl chloride) films revealed a low transmittance, a relatively high refractive index, and a small band gap [Citation12]. The high thermal stability, decomposition temperature, transmittance, and conductivity of PVP/CMC/α-Fe2O3 nanorods nominated them for applications in the packaging industry, treating some chronic wounds, optical windows and fibers [Citation13]. A considerable drop in the band gap of the methylene blue (MB)/PVA composite is detected with increasing MB doping amounts [Citation14]. The dielectric features of PVA were reduced as it was loaded with different amounts of melanin. Melanin doping could enhance the medical, electronic, and industrial applications of PVA [Citation7]. An ultraviolet-protective thin film was created by Albano et al. using silver nanowires coated in PVA-melanin [Citation15]. High electrical conductivity and biodegradability were found in composites made from naturally derived melanin and polyvinyl alcohol [Citation16].
This study aims to study the optical, fluorescence, and dielectric features of the novel biomaterial (PVP/CMC-melanin) blends.
2. Methods and materials
This study used abundant, low-cost natural Nigella sativa melanin (NSM) extracted in King Saud University's pilot plant labs [Citation4]. The PVP/CMC blended polymer (50/50%) was cast from 0.5 g of polyvinyl pyrrolidone (PVP, MW = 40,000 g/mol, sigma Aldrich) and 0.5 g of CMC (in the form of the sodium carboxymethyl cellulose, MW = 90,000, sigma Aldrich) dissolved in 50 ml of distilled water at room temperature (RT) and 50°C, respectively. After that, the two solutions were combined for five hours at room temperature. The solution was placed in a Petri dish in an electric oven at 45 °C for 5 days. The earlier procedures were carried out again using melanin (0.1, 0.5, 1 and 3) wt% using the next relation:
(1)
(1) where wf and wp are the weights of melanin and PVP/ CMC blend, respectively.
Blends are 120–220 µm thick (digital micrometer accuracy ±1 µm). A PANalytical diffractometer (X'pert MPD, Philips, copper source, λ = 1.5406 Å, step size: 0.02°, counting time of 10 s /step, 45 kV, 40 mA) collected x-ray diffraction data. Using a scanning electron microscope, the blends’ morphology and element analysis were discovered (JEOL, Akishima, Tokyo, Japan, JED-2200 Series). Using a luminescence spectrophotometer (FP-8200 JASCO), the fluorescence data were gathered under excitation wavelengths of 317 and 434 nm. A spectrophotometer (JASCO–V-670) with an integrating sphere assembly measured diffused reflectance (R), absorbance (A), and transmittance (T) for all samples in the wavelength range = 200-800 nm. Similar steps in refs. [Citation17,Citation18] corrected the R values before further calculations. Tauc's relation [Citation19] was used to calculate the direct and indirect optical energy gaps (Eg):
(2)
(2) where h, ν, D, d, and α ( = 2.303A/d) are Planck's constant, the incident light frequency, a constant known as the disorder parameter, the blended polymer thickness, and the absorption coefficient, respectively. s≡ 0.5 or 2 for direct or indirect optical transition, respectively.
The refractive index (n) and extinction coefficient (k) of the different samples were obtained using the formula in Ref. [Citation20].
(3)
(3)
(4)
(4) The capacitance (C) and dissipation factor (tan δ) of the blends were measured at room temperature using the LCR-8105G apparatus in the frequency range 100 Hz-1 MHz under an applied ac voltage (2 V). The blends were measured as a circular disk with a diameter of 13 mm and a thickness of 0.12-0.22 mm. The complex impedance (Z* = Z′+iZ′′), complex dielectric constant (ϵ* = ϵ′+iϵ″), complex electric modulus (M* = M′+iM′′), and alternating current conductivity (σac) of the various blends were calculated using the following relationships [Citation21]:
(5)
(5)
(6)
(6)
(7)
(7)
(8)
(8)
(9)
(9)
(10)
(10)
(11)
(11) where (Z′ and Z″), (M′ and M″), C0, f and ϵo are the real and imaginary parts of (impedance, electric modulus), empty capacitance, frequency, and permittivity of free space, respectively.
3. Results and discussion
3.1. Structural investigations
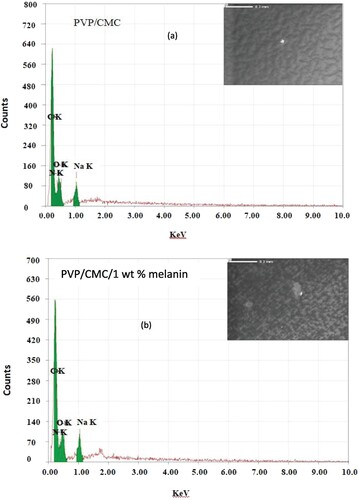
Figure displays the XRD data for the melanin as well as the XRD data for the PVP/CMC and PVP/CMC/x wt% melanin blends. The XRD patterns of all blends exhibited the same tendency of high diffuse scattering overlapped with some weak and broad peaks, demonstrating the low degree of crystallinity of all blends. Also, all blends have no diffraction lines associated with melanin. The broad humps around 2θ ∼ 13-14° and 20-21° are associated with characteristic peaks of PVP and CMC polymer, respectively [Citation22,Citation23]. Figure represents the SEM images and the corresponding EDs results for PVP/CMC with and without melanin (3 wt %). All SEM images exhibited smooth and homogeneous surface morphology, with a small white patch demonstrating partial miscibility. The corresponding EDS results pointed to the existence of carbon (C), oxygen (O), nitrogen (N), and sodium (Na) in all blends. The presence of sodium (Na) is associated with the sodium carboxymethyl cellulose (CMC) polymer.
Figure 1. XRD diffraction data for PVP/CMC/x wt% melanin polymers.
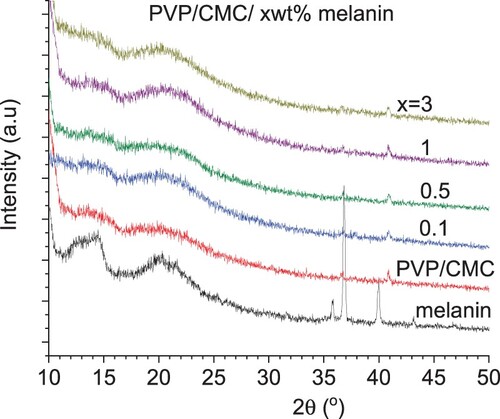
Figure 2. SEM and EDS images for PVP/CMC (a) without and (b) with melanin (1 wt %).
3.2. Optical features
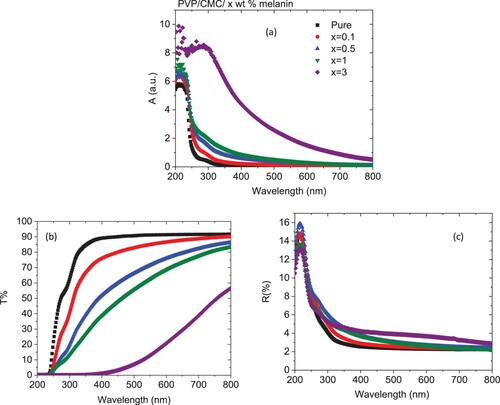
Figure depicts the absorption, transmittance, and reflectance spectra of pure and doped PVP/CMC blends with melanin in the wavelength range (λ) 200-800 nm. The absorption data for all blends displayed harmonic constant features that demonstrated a high miscibility performance within the undoped and doped chains, Figure (a). A progressive increase in the absorbance data of the PVP/CMC blend as it was loaded with different melanin ratios has been noticed. Similar results were detected for the PVP/CMC loaded with Au or PbO [Citation24,Citation25]. All blends displayed an absorption band and a shoulder at ∼217 and 289 nm which were attributed to the n → π* electronic transition (oxazine rings in the blended system) and the principal benzenoid π → π* type transitions, respectively [Citation26]. In addition, the absorption data shifted to the higher wavelength (red shift) as the amount of melanin increased, which demonstrated the clear variations in the optical band gap value of the host blend. Similar result was obtained as PVP doped with Zn1–xSnxS or single-walled carbon nanotubes/polyvinyl alcohol (SWCNTs/PVA) blend doped with Cd0.9Co0.1S or graphene/PVA filled with FeS [Citation27–29]. The development in the absorbance spectra, especially at higher concentrations of melanin in the λ between 250-400 nm of the doped blend, demonstrated their opportunity to be used as UV-blocking materials. Also, the rise in the absorption values of the blend as it is doped with 3 wt % melanin in the visible range can be ascribed to two reasons: first, the presence of melanin may result in a lessening in the amount of hydrogen bonds that are created between blend chains, which might enhance the host blend's amorphousness. Second, the presence of melanin may alter the internal structure in a way that reduces the amount of flaws and, as a result, relieves stress [Citation30]. Figure (b) displays the wavelength-dependent transmittance data for all samples. As the quantity of melanin in the host PVP/CMC blend grew, transmittance percentage decreased. This reflects the influence of the melanin presence on the scattering phenomenon, which is the key parameter for the transmission through doped blends. The fundamental mechanism of scattering shows the interaction between the incident photon beam and matter, which is brought on by changes in the host blends [Citation31]. Surface and grain boundary scattering were considered the main common scattering processes that are responsible for the reduction of the transmittance data. Additionally, all doped blends in the whole range had higher reflectance than the undoped PVV/CMC, with the exception of those in the range less than 250 nm; reflectance is dependent on the quantity of melanin. The variations in the reflectance spectra may be attributed to the modifications in the packing density of the PVP/CMC as a result of the doping amount [Citation32].
Figure 3. (a) Absorbance, (b) transmittance and (c) reflectance spectra for PVP/CMC/x wt% melanin polymers.
By extrapolating the linear portion of the graph between (αhν)2 and hν, shown in Figure (a), one can determine the direct optical band gap (Eg) for the melanin used in this study. The chart shows that the Eg value is 2.86 eV. This value is closer to that of an inorganic semi-conductor than that of an organic pigment [Citation4]. Also, the direct and indirect Eg values for all blends can be obtained from the graphs between (αhν)2 or (αhν)0.5 and hν, Figure (b), c, respectively. As demonstrated from the plots, the direct and indirect Eg values for the PVP/CMC blend are 5.1 and (4.9, 3.2) eV, respectively. These values were reduced to (5.08, 5.04, 4.95, (4.5, 3.23)) and ((4.3, 3.01), (4.11, 2.5), (4.1, 2.27), (2.2, 1.33)) eV for direct and indirect transition as the PVP/CMC blend was doped with (0.1, 0.5, 1 and 3) wt % melanin, respectively, Figure (d,e). Similar results were detected as PVA was doped with a different concentration of melanin; the Eg of PVA reduced from 5.1–3.42 eV as the contents of melanin increased to 4 wt % [Citation33]. Also, the Eg value of polystyrene and PVA/PVP were reduced as it was doped with nickel oxide and (tin sulfide or Co0.9Cu0.1S), respectively [Citation34–36]. The reduction in Eg values may be associated with the increase in the degree of disordering and hence, the creation of novel localized states within the band of the PVP/CMC blend and, consequently, melanin doping.
Figure 4. Tauc’ relation for (a) direct optical band gap for melanin powder, (b) direct and (c) indirect optical band gaps and (d, e) composition dependence of direct and indirect energy gaps for PVP/CMC/x wt% melanin polymers.
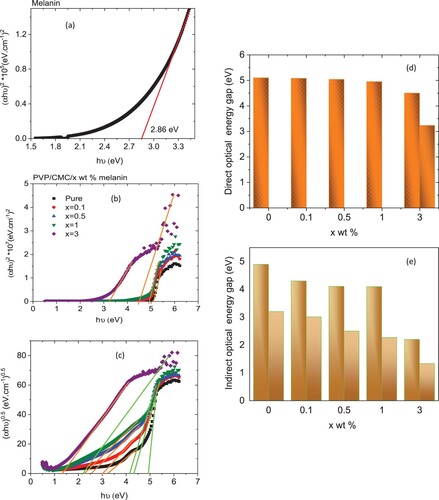
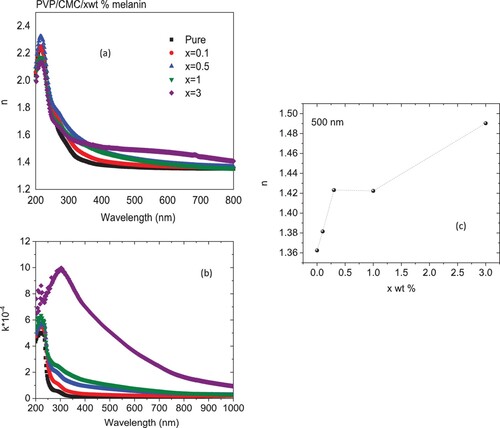
Figure (a) displays the refractive index (n) data for all blends. It is clear from the chart that in the visible range, the n values for host blend enlarged irregularly as the amount of melanin increased, Figure (c). Similar effect was detected as polyvinyl alcohol/graphene nanocomposite films loaded with iron oxide [Citation37] or PVP/PVA loaded with non-stoichiometric SnS [Citation38]. The increase in the n value indicated the existence of modifications within the intermolecular blend structure upon doping. Also, this increase in the value of n indicated the creation of novel intermolecular bonds between melanin and the host blend, which raised the density and decreased the development of novel hydrogen bonding between blend chains. The decrease in n values with λ demonstrated that the polarization state of the blend molecules decreased under the influence of the incident low energy photons due to the blend molecules’ high inertia. The extinction coefficient (k) is associated with the fraction of electromagnetic energy lost owing to scattering and absorption per unit thickness in a specific medium. Figure (b) reveals wavelength-dependent values of k for all blends. The k spectrum was raised as the content of melanin raised, while it decreased as the wavelength increased. Similar outcomes were found when PVA was doped with various amounts of melanin or when a PVA-CMC mixture was loaded with niobium carbide nanoparticles [Citation39,Citation40]. The presence of melanin causes a decrease in the number of hydrogen bonds that are formed between the PVP/CMC blend, which raises the blend's degree of amorphousness. Also, this increase may result from the increasing number of defects as a result of doping.
Figure 5. Changes of (a) extinction coefficient, (b) refractive index with the wavelength and (c) composition dependent of the refractive index at 500 nm for PVP/CMC/x wt% melanin polymers.
3.3. Fluorescence (FL) characteristics
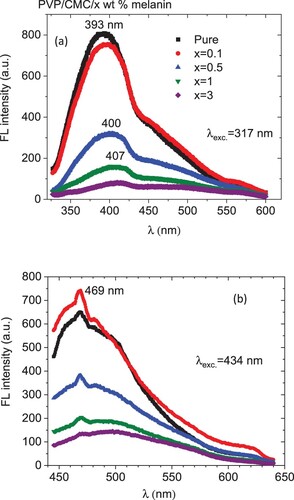
The measured FL spectra of the PVP/CMC/ x wt.% melanin are shown in Figure (a,b) for the two excitation wavelengths of 317 and 434 nm. The obtained spectra demonstrate the known light-emitting features of PVP polymer. Under the excitation wavelength of 317 nm, the emission spectrum revealed a broad peak in the range 350-550 nm with a shoulder to the right and a tip at around 393 nm for pristine PVP/CMC, Figure (a). Upon loading with melanin, the tip position increased while the maximum intensity decreased. Under excitation at 343 nm, the emission spectrum comprises a broad, asymmetric peak like a hump with a tip at 469 nm. Similar emission spectra were obtained in the literature: under the excitation wavelength of 325 nm, asymmetric emission peak was observed for PVP at 394 nm [Citation41]. Using an excitation wavelength of 308 nm, an emission peak is detected at 390 nm [Citation42]. The PVP excitation spectra exhibited two peaks at 285 and 332 nm which were attributed to the C = O and N–C groups present in PVP, respectively [Citation43,Citation44]. As a result, the current observed luminescence when excited with 317 and 434 nm wavelengths is attributed to electronic transitions in PVP molecular orbitals caused by the existence of C = O and N–C groups, respectively [Citation45,Citation46]. Inspecting Figure , one can notice the fluorescence quenching upon loading melanin into the PVP/CMC matrix. As a fundamental phenomenon, fluorescence quenching has been widely studied owing to its importance in many applications [Citation47]. In general, fluorescence quenching may occur due to the loss of energy of an excited state in nonradiative mode, caused by collision with a quencher molecule, or due to the formation of a poorly fluorescent supramolecular complex. For the present system, PVP/CMC/ x wt.% melanin, the melanin molecules act as quenchers via the cross-linking between the –OH (or –NH–) functional groups of melanin and the carbonyl groups (C = O) of PVP. The present system may be nominated as a catalyst for photocatalysis applications.
Figure 6. FL spectra for PVP/CMC/x wt% melanin polymers under different excitation wavelengths.
3.4. Dielectric characteristics
Figure displays the frequency-dependent dielectric constant (ϵ′) and loss (ϵ′′) spectra for PVP/CMC and PVP/CMC/x wt% melanin blended polymer films at RT. At a lower frequency, the ϵ′ exhibited a maximum value. In this range, the blend's ϵ′ reduced first as melanin reached 0.5 wt %, then enlarged again with more melanin doping. In contrary as amount of TiO2 or nanoceramic Li4Ti5O12 increased in PVA/CMC/graphene nanoplatelets blend or PEO/PVP blend the ϵ′ value increased, respectively [Citation48,Citation49]. This highest value of ϵ′ at lower frequency is ascribed to the considerable participation of the interfacial polarization (IP) “Maxwell–Wagner-Sillars (MWS) mechanism” that is present within the hybrid inorganic–organic structures owing to the change in the permittivity/conductivity values for the melanin and the host PVP/CMC blend [Citation50,Citation51]. The values of ϵ′ for all blends decreased as the frequency increased. Because dipoles cannot rotate with the applied field direction at higher frequencies, the value of ϵ′ reduces. In addition, the electrostatic interactions of melanin with dipolar groups of the PVP/CMC blend affected the dipolar ordering of polar PVP/CMC, causing a variation in the values of dielectric permittivity for the doped blend [Citation52]. The enhancement in ϵ′ value indicated the increasing the host matrix's capacity for energy storage [Citation48]. The values of ϵ′′ for blends are higher at lower frequencies, and they reduce as the frequency increases. The ϵ′′ value decreased as the amount of melanin increased up to 0.5 wt % after that, it increased with further increases in the content of melanin. This variation in the value of ϵ′′ is caused by differences in the charge carrying capacity of the blend after doping with different amounts of melanin [Citation52,Citation53]. Changes in polarization are associated with shifts in the dielectric constant and loss values. The accumulation of charge diffusion along the direction of the field is related to polarization. In addition, polarization was attenuated due to a decrease in charge accumulation due to diffusion in the direction of the field [Citation7].
Figure 7. (a) Dielectric constant and (b) dielectric loss for PVP/CMC/x wt% melanin polymers.
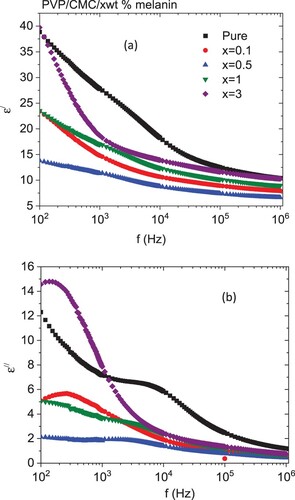
Figure reveals the frequency dependence of the AC conductivity for all blends. As revealed from the plot, the AC conductivity (σac) increased as the frequency increased. Furthermore, as the amount of melanin increased up to 0.5 wt %, the σac decreased, then increased with further melanin doping. The variations in the electrical conductivity might be ascribed to the variation of the space-charge polarization [Citation54]. Additionally, the amount of melanin affected the gap between localized states inside the blend, and as a result, the potential barriers separating them were affected, hence the movement of the charges changed. Furthermore, further doping of melanin increased the amorphous degree in the blend; consequently, the free volume around the blend network increased, and therefore the mobility of polarons and bipolrons increased [Citation55].
Figure 8. Variations of the AC electrical conductivity with frequency for PVP/CMC/x wt% melanin polymers.
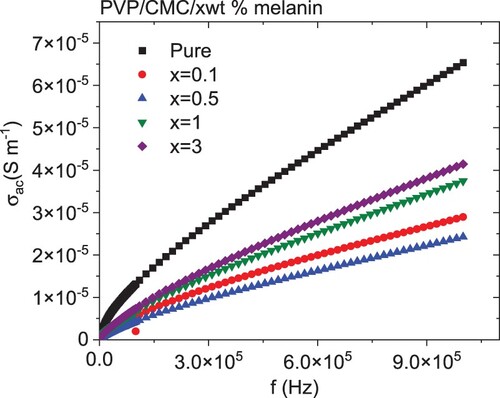
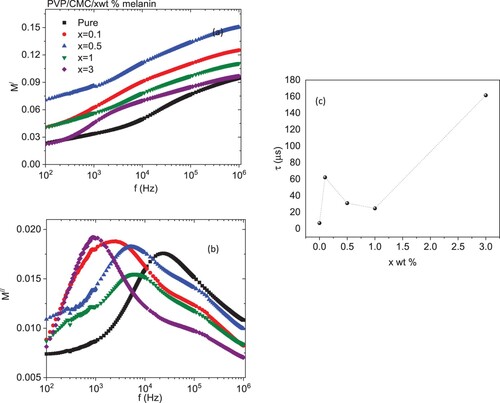
Figure illustrates the frequency dependence of the real (Z′) and imaginary (Z″) components of the complex impedance for all blends. As revealed from the graphs, the values of Z′ and Z″ were reduced monotonically with increasing frequency. The decrease in Z′ with the frequency is attributed to the decrease in interface polarization [Citation56]. The highest values of Z″ values at low frequencies pointed to the existence of dipolar relaxation. The values of Z′ and Z″ of the doped blends are higher than the undoped blend. The variation in melanin content in the blend changed the number of interconnected pathways within the blend, causing a variation in the blend's electrical conductivity [Citation56]. The Nyquist plot of the complex impedance (Z′ versus Z″) for all samples is depicted in Figure . All samples exhibited a similar ideal Nyquist tendency. All blends have a lower semicircle as compared with a pure PVP/CMC blend, except for one with 3 wt % melanin, which has a higher semicircle as compared with all blends. This reduction in the semicircle is attributed to a lowering in interfacial charge-transfer resistance. The frequency-dependent real (M′) and imaginary (M′′) of electric modulus for the pure and doped PVP/CMC blends with melanin are represented in Figure . All blends exhibited step-like plots of their frequency dependent M′ values, while each M′′ spectrum has a relaxation peak. This peak can be attributable to the MWS dynamics, which are associated with the heterogeneity of structures [Citation50]. The values of M′ have low values at the lower frequency range as a consequence of the insignificant influence of electrode polarization, indicating that the electrode influence has a minor polarization [Citation50]. This indicated that doped blends have a higher capacitive nature than the undoped blend, especially blends with 0.5 wt % of melanin [Citation57]. The M′ values increased as the amount of melanin increased up to 0.5 wt % then decreased with further doping of melanin. Moreover, the M′′ spectra reflect the influence of melanin in addition to the blend in the dynamics of the relaxation mechanism and the mobility of the charge carriers. The intensity of this peak increased as the blend was doped with different amounts of melanin, except for the blend loaded with 1 wt % melanin, where it decreased. Also, the position of this peak in general was shifted to a lower frequency as compared with an undoped blend. The shift of the peak towards the lower frequency range with changed melanin amounts is connected with the change in conductivity [Citation58]. The predicted relaxation time (τ) [τ ≈ 1/2πf] changed significantly from 6.89 to 161.6 µs, Figure (c), where f is the M″ peak frequency [Citation48]. These variations indicated the interaction of melanin with the host PVP/CMC blend.
Figure 9. Variations of (a) real and (b) imaginary of the impedance with frequency for PVP/CMC/x wt% melanin polymers.
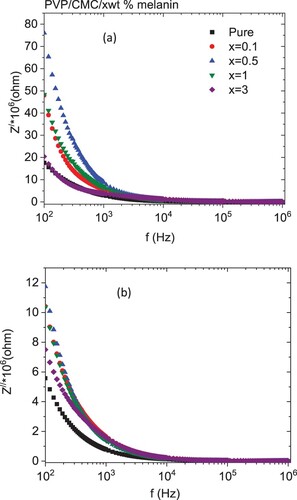
Figure 10. Nyquist plot for PVP/CMC/x wt% melanin polymers.
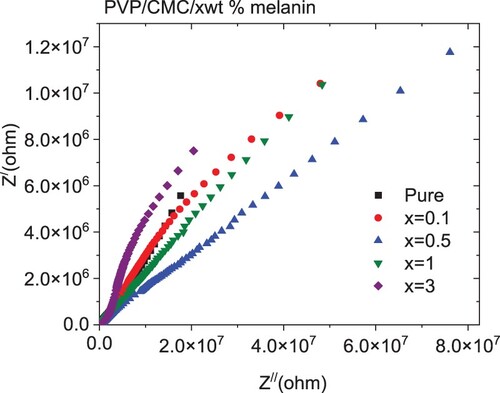
Figure 11. Variations of (a) real and (b) imaginary of electric modulus with frequency and (c) composition dependence of relaxation time for PVP/CMC/x wt% melanin polymers.
4. Conclusion
As the PVP/CMC blend was filled with different melanin ratios, the absorbance data increased. The direct and indirect Eg values of the host blend are affected by the doped content of melanin. The n values for the host blend increased irregularly as the amount of melanin increased. The maximum FL intensity was decreased upon loading the blend with melanin. The dielectric constant, dielectric loss, and AC conductivity decreased first as the amount of melanin reached 0.5 wt % then increased again with further increases in melanin. The amount of melanin has an effect on the Nyquist plot. Doped blends have a more capacitive nature than undoped blends, especially those containing 0.5 wt% melanin. The present system may be nominated as a catalyst for photocatalysis applications and UV-blocking materials.
Acknowledgment
The authors are grateful to the Deanship of Scientific Research, King Saud University for funding through Vice Deanship of Scientific Research Chairs.
Disclosure statement
The authors declare that they have no conflict of interest.
Research data policy and data availability statements
The authors confirm that the data supporting the findings of this study are available within the article [and/or] its supplementary materials.
Authors’ contribution
All authors have contributed, discussed the results and approved the final manuscript.
Additional information
Funding
References
- Wang Y, Wang X, Li T, et al. Effects of melanin on optical behavior of polymer: from natural pigment to materials applications. ACS Appl Mater Interfaces. 2018;10:13100.
- Hameed TA, Mohamed F, Turky G, et al. Carboxymethylcellulose/polyvinylpyrrolidone filled with Al-doped ZnO nanoparticles as a promising film for optoelectronic applications. Opt Mater. 2022;134:113097.
- El-naggar AM, Heiba ZK, Kamal AM, et al. Structural, thermal, and linear/nonlinear optical performance of PVA/CMC polymer blend doped with ZnS/V prepared at different temperatures. J Polym Res. 2022;29(11):1.
- Madkhali N, Alqahtani HR, Al-Terary S, et al. Control of optical absorption and fluorescence spectroscopies of natural melanin at different solution concentrations. Opt Quantum Electron. 2019;51:227.
- Riley PA. Melanin. Int J Biochem Cell Biol. 1997;29(11):1235.
- Bai W, Yang P, Liu H, et al. Boosting the optical absorption of melanin-like polymers. Macromolecules. 2022;55(9):3493.
- Ghannama MM, Awadb B, Al-Ayedb MS, et al. Improving the physical properties of polyvinyl alcohol (PVA)-melanin doping. Egypt J Chem. 2021;64(7):3665.
- El Askary A, El-Sharnouby M, Awwad NS, et al. Optical, thermal, and electrical conductivity strength of ternary CMC/PVA/Er2O3 NPs nanocomposite fabricated via pulsed laser ablation. Physica B. 2022;637:413910.
- Morsi MA, Pashameah RA, Sharma K, et al. Hybrid MWCNTs/Ag nanofiller reinforced PVP/CMC blend-based polymer nanocomposites for multifunctional optoelectronic and nanodielectric applications. J Polym Environ. 2022. doi:10.1007/s10924-022-02656-2.
- Kandasamy S, Narayanan V, Sumathi S. Zinc and manganese substituted hydroxyapatite/CMC/PVP electrospun composite for bone repair applications. Int J Biol Macromol 2020;145:1018.
- Haripadmam PC, Thanuja TH, Varsha GS, et al. Nonlinear optical absorption in PVA films doped by the novel natural dye extract from C. redflash leaves. Opt Mater 2021;112:110804.
- Mohammed G, El-Gamal S, Sayed AME, et al. Synthesis, structural, optical and electrical characterization of Y2O3 poly(ethylene glycol)–poly(vinyl chloride) based nanocomposite solid polymer electrolytes. Polym Int. 2023. doi:10.1002/pi.6472.
- El Sayed AM, Desoky A, Mohamad M. Synthesis, structural, thermal, optical and dielectric properties of chitosan biopolymer; influence of PVP and α-Fe2O3 Nanorods. J Polym Res. 2018;25:175.
- Ghoshal D, Bhattacharya D, Mondal D, et al. Methylene Blue/PVA composite film for flexible, wide-scale UV–VIS laser cut-off filter. Mater Res Express. 2019;6:075332.
- Albano LGS, Paulin JV, Trino LD, et al. Ultraviolet-protective thin film based on PVA–melanin/rod-coated silver nanowires and its application as a transparent capacitor. J Appl Polym Sci. 2019;136:47805.
- Eom T, Jeon J, Lee S, et al. Naturally derived melanin nanoparticle composites with high electrical conductivity and biodegradability. Part Part Syst Charact. 2019;36:1900166.
- El-naggar AM, Heiba ZK, Mohamed MB, et al. Thermal, linear and nonlinear optical properties of PVA/PVP/PEG blends loaded with nanovanadium-doped nano tin disulfide. J Mater Sci: Mater Electron. 2022;33(34):25743.
- El-naggar AM, Heiba ZK, Kamal AM, et al. Impact of loading PVA/CMC/PVP blend with CdS0.9M0.1 non-stoichiometrically doped by transition metals (M). Opt Mater. 2022;133:113085.
- El-naggar AM, Heiba ZK, Kamal AM, et al. Enhancing the linear and nonlinear optical properties by ZnS/V-doped polyvinyl alcohol/carboxymethyl cellulose/polyethylene glycol polymeric nanocomposites for optoelectronic applications. J Mater Sci: Mater Electron. 2022;33(33):25127.
- Heiba ZK, Mohamed MB, El-naggar AM, et al. Structural and the optical characteristics of PbSx thin films. J Mater Sci: Mater Electron. 2022;33(29):23270.
- El-Naggar AM, Heiba ZK, Kamal AM, et al. Structural, optical, and dielectric performance of PVA/PVP/PEG blend loaded with nano CoFe2−xErxO4 ferrite. J Mater Sci: Mater Electron. 2023;34(6):566.
- El Hotaby W, Sherif HHA, Hemdan BA, et al. Assessment of in situ-prepared polyvinylpyrrolidone-silver nanocomposite for antimicrobial applications. Acta Phys Pol 2017;131(6):1554.
- El-naggar AM, Heiba ZK, Kamal AM, et al. Impact of loading PVA/CMC/PVP blend with CdS0.9M0.1 non-stoichiometrically doped by transition metals (M). Opt Mater (Amst). 2022;133:113085.
- Morsi MA, Rajeh A, Menazea AA, et al. Nanosecond laser-irradiation assisted the improvement of structural, optical and thermal properties of polyvinyl pyrrolidone/carboxymethyl cellulose blend filled with gold nanoparticles. J Mater Sci: Mater Electron. 2019;30:2693.
- Al-Attiyah KH, Hashim A, Obaid SF. Fabrication of novel (carboxy methyl cellulose–polyvinylpyrrolidone–polyvinyl alcohol)/lead oxide nanoparticles: structural and optical properties for gamma rays shielding applications. Int J Plast Technol. 2019;23:39.
- Ali HE, Khairy Y. Microstructure and optical properties of Ni2+ doped PVA for optoelectronic devices. Physica B Condens. 2019;570:41.
- Badawi A. Enhancement of the optical properties of PVP using Zn1-xSnxS for UV-region optical applications. Appl Phys A. 2021;127:51.
- Badawi A, Alharthi SS, Assaedi H, et al. Cd0. 9Co0. 1S nanostructures concentration study on the structural and optical properties of SWCNTs/PVA blend. Chem Phys Lett. 2021;775:138701.
- Badawi A, Mersal GAM, Shaltout AA, et al. Exploring the structural and optical properties of FeS filled graphene/PVA blend for environmental-friendly applications. J Polym Res. 2021;28:270.
- Mohamed MB, Abdel-Kader MH. Effect of annealed ZnS nanoparticles on the structural and optical properties of PVA polymer nanocomposite. Mater Chem Phys. 2020;241:122285.
- Venkatram N, Rao DN, Akundi MA. Nonlinear absorption, scattering and optical limiting studies of CdS nanoparticles. Optica Pub Group Express. 2005;13:867.
- Kafashan H, Azizieh M, Vatan HN. Ultrasound-assisted electrodeposition of SnS: Effect of ultrasound waves on the physical properties of nanostructured SnS thin films. J Alloys Compd. 2016;686:962.
- Awad B, Aly AA, Ghannam MM. Melanin doping potential effect on the optical properties polyvinyl alcohol. Int J Adv Res Chem Sci. 2018;5(12):24.
- El-Khiyami SS, Ismail AM, Hafez RS. Characterization, optical and conductivity study of nickel oxide based nanocomposites of polystyrene. J Inorg Organomet Polym Mater. 2021;31:4313.
- Badawi A. Engineering the optical properties of PVA/PVP polymeric blend in situ using tin sulfide for optoelectronics. Appl Phys A. 2020;126:335.
- Alharthi SS, Badawi A. Tailoring the linear and nonlinear optical characteristics of PVA/PVP polymeric blend using Co0.9Cu0.1S nanoparticles for optical and photonic applications. Opt Mater (Amst). 2022;127:112255.
- Badawi A, Alharthi SS, Althobaiti MG, et al. The effect of iron oxide content on the structural and optical parameters of polyvinyl alcohol/graphene nanocomposite films. J Vinyl Addit Technol. 2022;28:235.
- Alharthi SS, Althobaiti MG, Alkathiri AA, et al. Exploring the functional properties of PVP/PVA blend incorporated with non-stoichiometric SnS for optoelectronic devices. J Taibah Univ Sci. 2022;16(1):317.
- Pota G, Zanfardino A, Napoli MD, et al. Bioinspired antibacterial PVA/Melanin-TiO2 hybrid nanoparticles: the role of poly-vinyl-alcohol on their self-assembly and biocide activity. Colloids Surf B. 2021;202:111671.
- Hashim A, Hadi Q. Synthesis of novel (polymer blend-ceramics) nanocomposites: structural, optical and electrical properties for humidity sensors. J Inorg Organomet Polym Mater. 2018;28:1394.
- Behera M, Ram S. Intense quenching of fluorescence intensity of poly(vinyl pyrrolidone) molecules in presence of gold nanoparticles. Appl Nanosci. 2013;3:543.
- Fediv VI, Yu. Rudko G, Isaieva OF, et al. Photoluminescence excitation in nanocomposites polyvinylpyrrolidone/ZnO. J Nano-Electron Phys. 2018;10:02019.
- Tang IH, Sundari R, Lintang HO, et al. Polyvinylpyrrolidone as a new fluorescent sensor for nitrate ion. Malaysian J Anal Sci. 2016;20(2):288.
- Minh TT, Van BP, Van TD, et al. The optical properties and energy transition process in nanocomposite of polyvinyl-pyrrolidone polymer and Mn-doped ZnS. Opt Quan Electron. 2013;45:147.
- Ram S, Fecht H-J. Modulating up-energy transfer and violet-blue light emission in gold nanoparticles with surface adsorption of poly(vinyl pyrrolidone) molecules. J Phys Chem C. 2011;115:7817.
- Manzoor K, Vadera SR, Kumar N, et al. Energy transfer from organic surface adsorbate-polyvinyl pyrrolidone molecules to luminescent centers in ZnS nanocrystals. Solid State Commun. 2004;129(7):469.
- Arık M, Celebi N, Onganer Y. Fluorescence quenching of fluorescein with molecular oxygen in solution. J Photochem Photobiol A. 2005;170:105.
- Al-Muntaser AA, Pashameah RA, Alzahrani E, et al. Graphene nanoplatelets/TiO2 hybrid nanofiller boosted PVA/CMC blend based high performance nanocomposites for flexible energy storage applications. J Polym Environ. 2022. doi:10.1007/s10924-022-02748-z.
- Al-Muntaser AA, Pashameah RA, Tarabiah AE, et al. Structural, morphological, optical, electrical and dielectric features based on nanoceramic Li4Ti5O12 filler reinforced PEO/PVP blend for optoelectronic and energy storage devices. Ceram Int. 2023. doi:10.1016/j.ceramint.2023.02.204.
- Sengwa RJ, Choudhary S, Dhatarwal P, et al. Nonlinear optical and dielectric properties of TiO2 nanoparticles incorporated PEO/PVP blend matrix based multifunctional polymer nanocomposites. J Mater Sci: Mater Electron. 2019;30:12275.
- Alsulami QA, Rajeh A. Synthesis of the SWCNTs/TiO2 nanostructure and its effect study on the thermal, optical, and conductivity properties of the CMC/PEO blend. Results Phys. 2021;28:104675.
- Morsi MA, Abdelaziz M, Oraby AH, et al. Effect of lithium titanate nanoparticles on the structural, optical, thermal and electrical properties of polyethylene oxide/carboxymethyl cellulose blend. J Mater Sci: Mater Electron. 2018;29:15912.
- Al-Muntaser AA, Abdelghany AM, Abdelrazek EM, et al. Enhancement of optical and electrical properties of PVC/PMMA blend films doped with Li4Ti5O12 nanoparticles. J Mater Res Technol. 2020;9:789.
- Chen X, Tseng JK, Treufeld I, et al. Enhanced dielectric properties due to space charge-induced interfacial polarization in multilayer polymer films. J Mater Chem C. 2017;5(39):10417.
- Al-hakimi AN, Asnag GM, Alminderej F, et al. Enhanced structural, optical, electrical properties and antibacterial activity of selenium nanoparticles loaded PVA/CMC blend for electrochemical batteries and food packaging applications. Polym Test. 2022;116:107794.
- Al-Saleh MH, Al-Anid HK, Husain YA, et al. Impedance characteristics and conductivity of CNT/ABS nanocomposites. J Phys D: Appl Phys. 2013;46:385305.
- Elashmawi IS, Al-Muntaser AA, Ismail AM. Structural, optical, and dielectric modulus properties of PEO/PVA blend filled with metakaolin. Opt Mater. 2022;126:112220.
- Pagot G, Bertasi F, Vezzù K, et al. Correlation between properties and conductivity mechanism in poly(vinyl alcohol)-based lithium solid electrolytes. Solid State Ionics. 2018;320:177.