
 ?Mathematical formulae have been encoded as MathML and are displayed in this HTML version using MathJax in order to improve their display. Uncheck the box to turn MathJax off. This feature requires Javascript. Click on a formula to zoom.
Abstract
The specific activities of natural radionuclides, 232Th, 226Ra, and 40K, in a Chinese iron beneficiation plant and surrounding soil were analyzed with the high purity germanium gamma (HPGe) spectrometer in this study. Average specific activities of 238U, 232Th, 226Ra and 40K lower than the Chinese averages. To assess radiation impact, various indicators, radium equivalent index (Raeq), absorbed dose rate (DR), annual effective dose (AED), excess lifetime cancer risk (ELCR), external hazard index (Hex), internal hazard index (Hin) and activity utilization index (AUI), were calculated. Mean values were below international limits, indicating no significant health hazards for the local population. Statistical analyses, including skewness and kurtosis calculations, along with techniques like frequency distribution, Pearson's correlation analysis, box plots and cluster analysis, were applied to comprehensively assess distribution patterns and interrelationships among radiological parameters. In summary, there are no potential health hazards associated with the soil in the study region for people.
1. Introduction
The raw iron ore used by a Chinese iron beneficiation plant is accompanied by radioactive elements [Citation1]. The beneficiation process adopts the conventional two-stage crushing, two-stage grinding stone and two-stage magnetic separation fine screening process. Prior to mineral processing, the natural radioactivity of the surroundings is in a balanced state and remains unchanged during the processing stages. However, after processing, during the process of storage and waste disposal natural radionuclides in raw materials will be discharged into the environment along with the generated dust, waste residue and wastewater, causing internal and external radioactive exposure to workers [Citation2,Citation3]. Naturally occurring radioactive materials (NORM) refer to natural radionuclides, predominantly 238U, 232Th, 226Ra, 40K and others, which arise from natural processes rather than human activities. They are ubiquitously present in various components of the natural environment, such as rocks, soil, water, atmosphere, as well as flora and fauna [Citation4–6]. NORM that have been concentrated or exposed to the accessible environment as a result of human activities such as manufacturing, mineral extraction, or water processing are called Technologically Enhanced Naturally Occurring Radioactive Material (TENORM) [Citation7,Citation8]. The radioactive pollution of TENORM is mainly distributed in the process of mining, beneficiation, smelting and use of mineral products. Raw materials used by mineral processing enterprises contain certain natural radionuclides. During the processing, some of radionuclides will be transferred and accumulated, making the radioactive contents of some products or waste much higher than the background level of natural radioactivity, causing certain environmental pollution [Citation9,Citation10].
In the iron ore processing and smelting process, a large amount of waste slag accumulates in outdoor pits on the factory premises. Due to the fact that the factory has not taken any measures to treat these slag heaps, they are simply left exposed in the outdoor environment, posing a potential safety hazard. Proper disposal of radioactive waste is crucial for ensuring the factory's safety, environmental protection and human health. Inadequate disposal can lead to significant safety hazards, including potential loss of life and property, damage to the environment, and serious social consequence. Humans are exposed to ionizing radiation from natural radionuclides and artificial ones in the environment. According to the data of World Nuclear Association (WNA), natural radionuclides account for approximately 85% of the ionizing radiation dose received by the general public annually. Among them, the most prominent ones are radionuclides of the uranium and thorium series and 40K. Soil is an important environmental medium for sustaining life and also serves as an effective indicator of radionuclide pollution [Citation11]. Radionuclides in soil pose the potential threat to the ecological environment and harm human health through various absorption routes, such as direct ingestion, skin contact and ingestion through the soil-food chain and inhalation [Citation12,Citation13]. In order to ascertain the impact of the slag heaps on the surrounding environment within the factory, a comprehensive analysis of natural radioactive nuclides in the soil and a radioactive hazard assessment will be conducted, which will serve as foundational data for the subsequent management of the slag heaps.
It is crucial to evaluate activity concentration through radiological assessment for the monitoring and assessment of radioactive hazards, which provides the foundation for establishing standards and guidelines that are imperative for effective environmental management and remediation efforts [Citation14]. Research on the sources and behaviour of natural radioactive nuclides has been extensive [Citation15–17], encompassing analyses of their spatial distribution in soil and investigations into the effects of associated radioactive ores like iron and phosphate ores on the soil [Citation1,Citation18–21]. This research work aims to determine the activity concentrations and distribution of 238U, 232Th, 226Ra and 40K in soil samples collected from an iron ore beneficiation plant in China. It also aims to assess the radium equivalent index (Raeq), absorbed dose rate (DR), annual effective dose (AED), excess lifetime cancer risk (ELCR), external hazard index (Hex), internal hazard index (Hin) and activity utilization index (AUI). The data collected in this study can be added to the natural radioactivity level database, providing information about the activity concentration distribution of natural radioactive nuclides and the radiation doses received by individuals in contact with this environment. Simultaneously, the findings of this study can furnish regulatory authorities with more precise and effective regulatory approaches, and furnish scientifically grounded, objective, and impartial foundational data and justification for establishing industry threshold standards and related policies.
2. Materials and methods
2.1. Study area
The study area is located in a Chinese iron beneficiation plant, which is located at a mountainous and hilly landform. The northern part is an eroded structural terrain with an altitude of more than 1000 m. The central part is mountainous and hilly with moderate cuts, which is a stage-like landform with successively lower structures. From the south to the sea coast, it gradually becomes an undulating banded plain with low hills with a width of tens of kilometers. Due to the characteristics of the landform, there are a large number of mineral resources in the area. There are many villages around the factory, so the development and utilization of mineral resources would inevitably have an impact on the surrounding environment and individuals.
2.2. Collection and preparation of samples
Radiation environmental monitoring should be conducted for enterprises involved in the extraction, beneficiation, and smelting of radioactive minerals in accordance with Chinese national standard HJ 61-2021 “Technical specification for radiation environmental monitoring”. This includes monitoring of radioactive nuclides such as 238U, 232Th and 226Ra in the soil within 3–5 km around the factory area [Citation22]. Therefore, based on this standard, the current study established five monitoring points in four directions of the beneficiation plant and near the tailings pond. Additionally, 28 villages with dense populations and long-term residency within 3 km of the factory were selected as monitoring sites, as shown in Figure . Soil samples were collected at these monitoring sites to analyze the activity concentrations of 238U, 232Th, 226Ra and 40K, and to evaluate the long-term health effects of the beneficiation plant's operations on the surrounding residents.
Figure 1. Schematic diagram of soil sampling points.
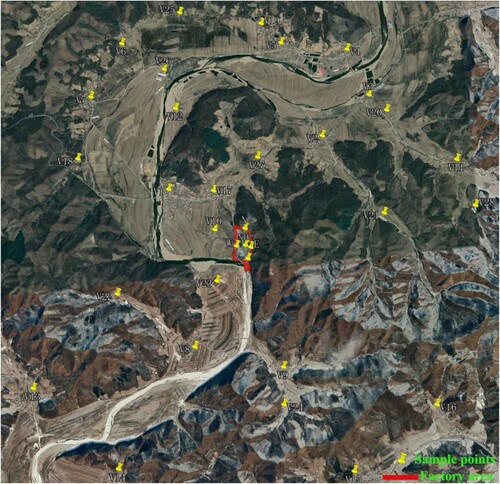
Soil site selection, sample collection and sample processing were conducted based on the HJ/T 166-2004 “The technical specification for soil environmental monitoring” in this study [Citation23]. The soil site selection was carried out using a systematic random approach, dividing the monitoring area into four equal sections. Within each grid, a sampling point was designated, and 5 soil surface samples were collected using the “cloverleaf” sampling method. Topsoil was collected at a depth of 10 cm from the surface. Debris like stones and roots collected from various points in the soil was cleared, mixed on-site, and a 2–3 kg sample was taken, sealed in a double-layered plastic bag, and then placed in a cloth bag of the same size for storage. The soil samples, after removing weeds and gravel, were dried at 100 °C until reaching the constant weight [Citation24]. Subsequently, they were crushed, sieved through a sieve with a mesh size of 0.25 mm, weighed, and transferred into 75 × 70 cm sample boxes, which is consistent in size with the standard source of the calibrated gamma spectrometer [Citation24]. All samples were sealed and placed for at least 30 days to achieve the secular equilibrium between 226Ra and its progeny [Citation24,Citation25]. The samples were collected from the four directions of the beneficiation plant are labelled with the corresponding directions as identifiers: S, N, W and E. The samples gathered near the tailings pond are identified as NTP. The soil samples collected from the 28 villages around the factory are numbered in sequence starting from V1 to V28 according to the order of the villages.
2.3. Radioactivity measurements
The analysis of natural isotopes 232Th, 226Ra and 40K in soil samples was based on the Chinese national standard GB/T 11743-2013 “Determination of radionuclides in soil by gamma spectrometry” [Citation24]. ORTEC GEM30P4-76 high purity germanium gamma spectrometer was used to analyze the samples [Citation26]. The detector has a relative efficiency of 30% and an energy resolution of 1.99 keV for 1332.25 keV gamma energy of 60Co. The detector was calibrated using a standard sample (8NTR/015) which contains a number of radioactive nuclides of 214Am, 238U, 226Ra, 235U, 232Th, 40K, 60Co and 137Cs. The detector is surrounded by a shield made of 10 cm thick lead to reduce the background radiation level of the system and internally filled with 1 mm thick copper plates to reduce the X-ray emissions from cosmic radiation interacting with lead. “Gamma Vision” software was used to analyze the spectral data.
The prepared samples were placed at the central position of the probe for measurement. The background radioactive intensity was measured for 86,400 s, using an empty Marinelli cup. The samples were then measured at a record time of 86,400 s. After that, the background count was subtracted from the spectrum of the sample. The activity concentrations of 40K were calculated directly by its gamma spectra 1460.83 keV. 232Th activity concentration was determined from the gamma peak energies of 208Tl at 583.19 keV and 228Ac at 911.20 keV. 238U measurements were based on the weighted mean of the photo peaks of 234Th (63.29 and 92.8 keV), while 226Ra stem from the determinations of 214Pb at 351.92 keV and 214Bi at 609.31 keV [Citation27,Citation28].
The absolute efficiency is obtained from using the efficiency curve for the standard source through Equation (1) [Citation24]:
(1)
(1) where ε is the efficiency value. ai is the best appropriate parameter determined by the synthesis algorithm. Eγ is energy. The efficiency values were used to calculate the activity concentration of 232Th, 226Ra and 40K.
According to the efficiency curve method, the activity concentration of radioactive nuclides in soil samples is calculated using Equation (2) [Citation24]:
(2)
(2) where ηi represents the efficiency value for the ith full absorption peak of the gamma ray. Pji denotes the emission probability of the jth nuclide emitting the ith gamma ray. Aji (s−1) represents the net peak area counting rate of the ith characteristic peak of the jth nuclide in the measured sample. Ajib (s−1) corresponds to the background net peak area counting rate of the characteristic peak corresponding to Aji. W (kg) is the net weight of the measured sample. Dj is the decay correction factor for the jth nuclide to the time of sampling.
2.4. Radiological hazard indices
2.4.1. Radium equivalent index (Raeq)
A common radiation index was introduced to represent the activity levels of 232Th, 226Ra and 40K [Citation29]. The safe limit Raeq is 370 Bq kg−1 [Citation30]. The mathematical definition of the radium equivalent index (Raeq) is as follows [Citation31]:
(3)
(3) where Raeq (Bq kg−1) is the radium equivalent index. ATh, ARa and AK (Bq kg−1) are the activity concentrations of 232Th, 226Ra and 40K, respectively.
2.4.2. Absorbed dose rate (DR)
According to the specific activity values of 232Th, 226Ra and 40K in the soil, the absorbed dose rate of γ-ray at 1 m above the ground was calculated. It is recommended that the acceptable total absorbed dose rate for the workers in the area should not exceed the global average level of 57 nGy h−1 [Citation30]. It can be calculated by using the Equation (4) [Citation30,Citation32].
(4)
(4) where DR (nGy h−1) is the absorbed dose rate. According to UNSCEAR and the European Commission, the conversion factors for converting the activity concentration, ATh, AU and AK to ADR are 0.604, 0.462 and 0.0417, respectively [Citation30].
2.4.3. Annual effective dose (AED)
AED is defined as the radioactive coefficient used to judge the degree of impact of absorbed dose on health, in the unit of μSv y−1. The recommended AED limit for public exposure is 1 mSv y−1 [Citation33]. The annual effective equivalent dose is calculated by the Equation (5) [Citation34]:
(5)
(5) where AED (μSv y−1) is the annual effective dose. DR (nGy h−1) is absorbed dose rate. The conversion factor (CF) is assigned a value of 0.7 Sv Gy−1. T (h) is the annual exposure time of people outdoors (outdoor occupancy factor p = 0.2, T = 24 × 365 × 0.2 = 1752h) [Citation30].
2.4.4. Excess lifetime cancer risk (ELCR)
ELCR is defined as the cancer risk of people with long-term exposure to carcinogens. UNSCEAR reported that the worldwide average limit value was 0.29 × 10⁻³ [Citation30,Citation35]. The ELCR can be estimated using Equation (6) [Citation31]:
(6)
(6) where ELCR is the excess lifetime cancer risk. AED, DL and RF are the effective annual dose (μSv y−1), life span (70 years) and risk factor (0.05 Sv−1), respectively.
2.4.5. External and internal hazard index (Hex, Hin)
Hex reflects the ionizing hazard of external natural γ-ray radiation. What’s more, there is also the Hin, to ensure that the effective dose of the radiation is not beyond the limits is 1 mSv y−1 [Citation36]. Only when the values of Hex and Hin are both no more than 1, can radiation hazards be insignificant. The Hex and Hin can be calculated by using Equations (7) and (8), as follows [Citation31]:
(7)
(7)
(8)
(8)
2.4.6. Activity utilization index (AUI)
The activity utilization index (AUI) reflects the air dose rate of the combination of 232Th, 226Ra and 40K. The recommended acceptable activity utilization index limit is 1 [Citation30]. Based on appropriate conversion factors and the specific activities of the radionuclides, the AUI can be calculated according to Equation (9) [Citation32], as follows:
(9)
(9) where AUI is the activity utilization index. ATh, ARa and AK (Bq kg−1) are the activity concentrations of 232Th, 226Ra and 40K, respectively. Also, (fTh = 0.604), (fRa= 0.462) and (fK = 0.0417) are the respective fractional contributions from the actual activities of these radionuclides to the total gamma radiation dose rate in the air [Citation30].
2.5. Geo-spatial analysis
With ArcGIS10.6, Kriging spatial interpolation method was used to generate the spatial distribution map of natural radionuclides in the soil of the study area. Utilizing this method, spatial analyses were conducted on prepared maps. The distribution area was assessed for concentrations of 238U, 232Th, 226Ra and 40K. Employing the Kriging technique, an experimental variogram model was developed based on data collected from the research area. Spatial transformation was implemented to identify the optimal model for utilization along with the parameters of the generated maps [Citation37]. The ordinary Kriging formula is represented as follows:
(10)
(10) where Z(Si) represents the recorded value at the specific location (ith), λi signifies the unspecified weight assigned to the recorded value at the same location (ith) and S0 denotes the target estimation location.
The Kriging interpolation method becomes feasible by moving data into the GIS context. Consequently, analyses can be carried out in regions lacking data.
2.6. Multivariate statistical methods
IBM SPSS Statistics is a comprehensive statistical software package created by IBM, designed for tasks such as data management, advanced analytics, multivariate analysis, business intelligence and even criminal investigation. The statistical analysis of multiple variables was executed using IBM SPSS version 23 software, resulting in the generation of box plots based on experimental data.
3. Results and discussions
3.1. Activity concentrations of natural radionuclides in soil samples
The analysis results of specific activities of 238U, 232Th, 226Ra and 40K are shown in Table . The specific activities of 238U, 232Th, 226Ra and 40K in the factory area soil were 11.0 ± 0.7–14.2 ± 0.9, 41.9 ± 2.6–51.2 ±3.2, 12.2 ± 0.8–23.8 ± 1.5, 620.9 ± 39.3–658.8 ±41.7 Bq kg−1, respectively. The specific activities of 238U, 232Th, 226Ra and 40K in the non-factory area soil are 8.7 ± 0.5–12.8 ± 0.8, 35.6 ± 2.2–51.6 ± 3.3, 8.3 ± 0.5–11.7 ± 0.7, 487.1 ± 30.8–609.0 ± 38.5 Bq kg−1, respectively. The specific activities of radionuclides in the soil of the factory area were higher than those in the non-factory area, but all within the range of natural radioactivity levels in Chinese soil, and the ranges of 238U, 232Th, 226Ra and 40K are 1.8–520.0, 1.0–437.8, 2.4–425.8, 11.5–2185.2 Bq kg−1, respectively [Citation38].
Table 1. Specific activities of 238U, 232Th, 226Ra and 40K in soil samples.
The results of this study are compared with these in other countries shown in Table . The activity concentrations of 238U, 232Th, 226Ra and 40K in soil samples were compared with several countries including Vietnam, Bangladesh, Ghana, Malaysia, India, Mumbai, Cameroon, Togo, Thailand, Egypt, Tunisia, Jordan, etc. In this study, the average values of 238U and 226Ra were lower than in other countries. The average value of 232Th was lower than in all countries except Vietnam, Ghana, Mumbai, Egypt, Tunisia and Jordan. The average value of 40K was higher than in all countries except Bangladesh and Cameroon. According to the results of this study, it can be observed that the average activity concentrations of 238U, 232Th and 226Ra in soil samples were lower than the global average values (which are 33, 45 and 32 Bq kg−1 respectively), except for 40 K (420 Bq kg−1) [Citation30]. This could be attributed to agricultural activities in the study area, including agricultural land use and wastewater discharge [Citation51]. There are numerous villages and farmlands surrounding this area, and domestic wastewater from these villages is directly discharged into the surrounding environment without treatment. Additionally, potassium generated from agricultural land use and fertilization processes infiltrates the soil through surface runoff [Citation52].
Table 2. Comparison of average specific activities in soils in the study area with those reported by other researchers in different countries.
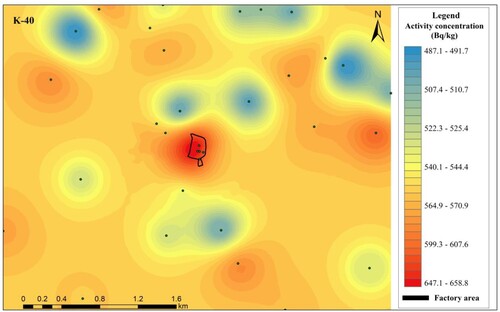
The Geo-Spatial distribution of natural radionuclides in the soil of the study area is shown in Figures . It can be found that the specific activities diffused from the factory area to the surrounding area, and the specific activities in the factory area were obviously higher than those in the non-factory area. Natural radionuclides are enriched in waste residues during processing, and these waste residues are piled up in the open air in the factory area, so there is a risk of release to the environment, affecting the surrounding ecological environment [Citation39,Citation41]. In addition, the specific activities are related to correlated with the elements, chemical and geological properties of the soil. Leaching, surface erosion and plant uptake are also major factors affecting the distribution of radionuclides [Citation53,Citation54].
Figure 2. Geo-Spatial distribution of 238U in the soils of the study area.
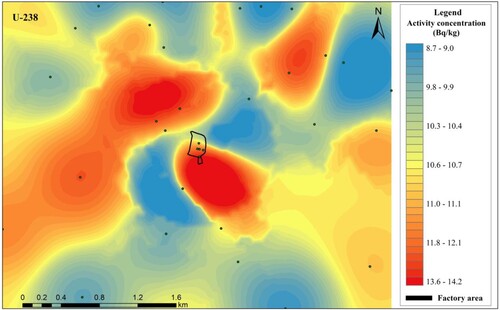
Figure 3. Geo-Spatial distribution of 232Th in the soils of the study area.
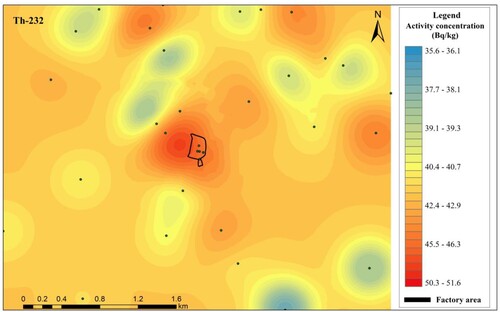
Figure 4. Geo-Spatial distribution of 226Ra in the soils of the study area.
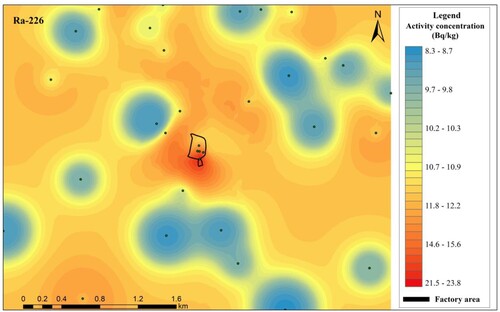
Figure 5. Geo-Spatial distribution of 40K in the soils of the study area.
3.2. Radiological health risk assessment
To evaluate the radiation hazards of ionizing radiation released from natural radionuclides in soil samples, radiation hazard indicators were calculated. Radiation hazards evaluation is important for the purpose of environmental protection studies because soil would have a continuous impact on the residents. The results are shown in Table .
Table 3. Radiation hazard indicators in soil samples.
The DR of in the factory was 56.7–63.6 nGy h−1, with an average of 60.4 nGy h−1. The DR of non-factory samples was 47.4–59.8 nGy h−1, with an average of 52.2 nGy h−1. The value of DR is the highest at sampling point S on the south side of the factory area, and the lowest at sampling point V20 in the non-factory area. The largest contribution to DR is 232Th (48%), followed by 40K (43%) and 238U (9%). The average value of DR in this region is lower than the world average of 57 nGy h−1 [Citation30].
Relying solely on the dose rate (DR) may not provide a comprehensive reflection of the radiation hazard level. It is necessary to combine it with other hazard indices to collectively assess the situation [Citation55]. The study area is located in a rural area, where people mainly make a living by farming. Therefore, people are mainly affected by the soil from outdoors. The AED is estimated by the absorbed dose rate and the conversion coefficient of the effective dose and the outdoor occupancy factor. The AED of the factory samples was 69.5–78.0 μSv y−1, with an average of 74.1 μSv y−1. The AED of the non-factory samples was 58.1–73.3 μSv y−1, with an average of 64.0 μSv y−1. The factory area is significantly higher than the non-factory area. However, these values are all lower than the maximum allowable limit of 1 mSv y−1 recommended by ICRP [Citation33].
The ELCR in the factory area is 0.3 × 10⁻³. The ELCR of non- factory samples were 0.2 × 10⁻³ to 0.3 × 10⁻³, with an average value of 0.2 × 10⁻³. The ELCR is the highest at the sampling points on the south side of the factory area, and the values in non-factory area were all lower than those in the factory area. These values are all lower than the world average of 1.45 × 10⁻³ [Citation30].
The Raeq in the factory area was 121.8–142.3 Bq kg−1, with an average of 133.1 Bq kg−1. The Raeq of non-factory soil samples ranged from 101.6 to 128.4 Bq kg−1, with an average of 110.4 Bq kg−1. For Raeq, the sampling point S on the south side of the factory area is the highest, and the sampling point V20 in the non-factory area is the lowest. The largest contribution to Raeq is 232Th (53%), followed by 40K (38%) and 226Ra (9%). The average value of Raeq in this region is lower than the world average of 370 Bq kg−1 [Citation30].
The Hex range of the factory soil samples is 0.3–0.4, the average value is 0.4, and the Hin is 0.4. The Hex of non-factory soil samples is 0.3, the Hin range is 0.3–0.4, and the average value is 0.3. The Hex and Hin in the factory area were significantly higher than those in the non-factory area. The largest contribution to Hex is 232Th (53%), followed by 40K (38%) and 226Ra (9%). And for Hin, the largest contribution is 232Th (48%), followed by 40K (34%) and 226Ra (17%). These values are all lower than the UNSCEAR recommendation of 1 [Citation30].
The AUI in the factory area was 0.7–0.9, with an average value of 0.8. The AUI of non-factory samples was 0.6–0.8, with an average value of 0.6. The AUI was the highest at the sampling point S on the south side of the factory area, and the values of soil samples in the factory area were significantly higher than those in the non-factory area samples. The largest contribution to AUI was 232Th (78%), followed by 226Ra (15%) and 40K (7%). The average AUI for the region is below the world average of 1 [Citation30].
3.3. Statistical analysis
3.3.1. Basic statistics
Radiation measurement results in this study were statistically examined in order to get the most accurate conclusion on the significance and type of natural radionuclides in the soil of a Chinese iron beneficiation plant. It is shown in Table that the descriptive statistics of activity concentration of 238U, 232Th, 226Ra and 40K. The central tendency and variation of the data are described using the arithmetic averages and the standard deviations of the activity concentrations of NORMs in all of the soil samples. Skewness of radionuclides 238U, 232Th, 226Ra and 40K is positive, indicating an asymmetric distribution around the mean. Kurtosis serves as a measure to evaluate the prominence of a probability distribution for a real-valued random variable. By comparing it with a standard distribution, kurtosis characterizes the degree of prominence or flatness in a distribution. A positive kurtosis value indicates a distribution with a relatively sharp peak, while a negative kurtosis value signifies a flatter distribution. In this particular investigation, the kurtosis values for 40K (−0.3) indicated a flattened distribution, while the positive kurtosis values of 238U (0.3), 232Th (0.3) and 226Ra (8.6) pointed to distributions with relatively pronounced peaks [Citation31].
Table 4. Descriptive statistics of activity concentration of 238U, 232Th, 226Ra and 40K in soil samples.
3.3.2. Box plot
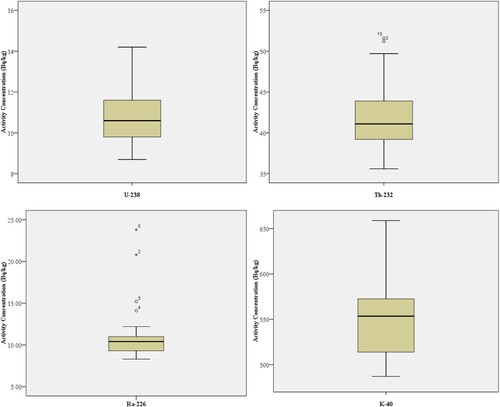
Figure illustrates the Box plot showcasing the distribution of activity concentrations for 238U, 232Th, 226Ra and 40K. The median is positioned close to the centre of the boxes for 238U, 232Th and 40K, indicating a symmetrical and normally distributed data set. However, in the case of 226Ra, the median is positioned nearer to the upper part of the box, indicating a skewed distribution [Citation34]. The outliers 2, 3, 4 and 5 observed in the boxplot of 232Th and 226Ra correspond to sampling points within the factory area, namely points S, W, E and NTP. This is attributed to the prolonged processing and production of associated radioactive iron ore within the factory premises, resulting in higher levels of radioactive nuclides such as 232Th and 226Ra in the soil environment compared to areas outside the factory. As for the outlier 15 in the boxplot of 232Th, it corresponds to the sampling point V10 within the non-factory area. This point is located less than 300 m from the factory. It is possible that during the transportation of ore or slag, there may have been instances of spillage, leading to higher levels of 232Th in the soil sample at V10 compared to other areas.
Figure 6. Box plots of the results on 238U, 232Th, 226Ra and 40K activity concentrations in the soil samples.
3.3.3. Frequency distribution and Q-Q plot
The analysis of frequency distribution and Quantile-quantile (Q-Q) plots for activity concentrations of 238U, 232Th, 226Ra and 40K was conducted, and the corresponding histograms are presented in Figures . The activity concentration distribution of 40K follows a normal distribution (bell-shaped), whereas the distributions of 238U, 232Th and 226Ra exhibit a log-normal pattern with some level of multimodality. This presence of multiple modes signifies the intricate nature of radionuclides within soil samples. The Q-Q plots depicted in Figures reveal that the points align approximately along the 45-degree reference line, suggesting that the distributions can be reasonably assumed to be normal.
Figure 7. Frequency distribution and Quantile-quantile (Q-Q) plots of the activity concentrations for 238U of the investigated soil samples.
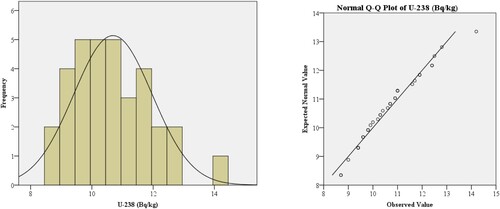
Figure 8. Frequency distribution and Quantile-quantile (Q-Q) plots of the activity concentrations for 232Th of the investigated soil samples.
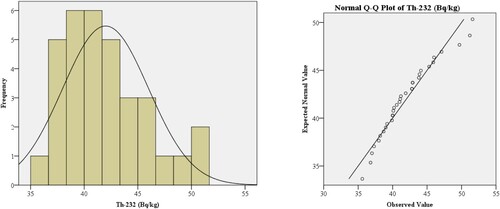
Figure 9. Frequency distribution and Quantile-quantile (Q-Q) plots of the activity concentrations for 226Ra of the investigated soil samples.
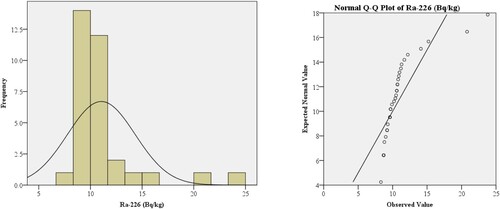
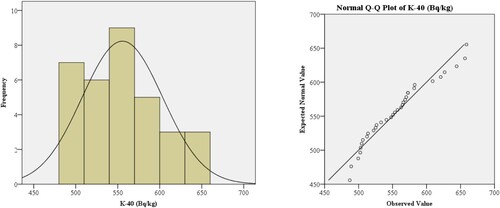
Figure 10. Frequency distribution and Quantile-quantile (Q-Q) plots of the activity concentrations for 40K of the investigated soil samples.
3.3.4. Pearson’s correlation coefficient analysis
Pearson's correlation coefficient analysis was employed to assess the interrelationships and their strengths among pairs of variables, as detailed in Table . Notably, a substantial correlation was observed between 232Th and 226Ra (r = 0.549), which can be attributed to their shared natural origins [Citation56]. Additionally, the calculated correlations involving Raeq, DR, AED, ELCR, Hex, Hin and AUI demonstrated a perfectly positive linear relationship. This signifies a high degree of association among these parameters, with strong correlations extending to 238U, 232Th, 226Ra and 40K.
Table 5. Pearson’s correlation matrix between radioactive variables of the investigated soil samples.
3.3.5. Cluster analysis
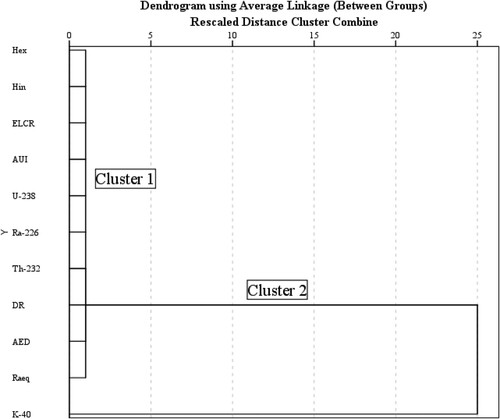
Cluster analysis (CA) was executed to explore the resemblances among radiological parameters, as depicted in Figure . The dendrogram visually presents clusters with shared characteristics. In this study, the average linkage method was utilized to quantify the distance between clusters. This method hinges on the smallest average distance value between clusters, akin to the single and full link techniques. Within the dendrogram, all 7 radiological parameters were categorized into two clusters. Cluster 1 encompasses parameters (238U, 232Th and 226Ra) that exhibit high similarity. This suggests that the radioactivity in soil samples primarily hinges on the activity concentrations of 238U, 232Th and 226Ra [Citation57]. Meanwhile, Cluster II encompasses 40K at a considerable Euclidean distance. Within the dendrogram, it's evident that DR, AED and Raeq were predominantly influenced by 40K.
Figure 11. Dendrogram shows the clustering of radiological parameters.
This study reveals the distribution and concentration of natural radioactive materials in specific environments, providing valuable data for environmental protection and human health. It aids in the formulation of more targeted protective measures and policies, thereby advancing sustainable development and public health management on a global scale. Additionally, it contributes to the accumulation and development of scientific knowledge, offering crucial reference for similar research in other regions and on different types of mineral resources, enriching the theoretical framework in the field of radiological studies. Finally, the achievements and experiences of this study can be shared for international cooperation, strengthening the collective understanding and response to environmental issues worldwide. Overall, this specific research not only contributes to solving localized problems but also provides valuable knowledge and resources for global scientific research and practical applications.
4. Conclusion
The specific activities and radiation hazard indicators in the factory area were higher than those in the non-factory area. The largest contribution to environmental pollution and health hazards was 232Th, potentially due to the enrichment of radionuclides in the waste slag generated during iron ore processing. There is a risk of release during the transportation of waste residues to open dumps, resulting in higher radioactivity in the factory area than in non-factory areas. The specific activities of 238U, 232Th, 226Ra and 40K were all lower than the Chinese average. All radiation hazard indicators were lower than the world average. Therefore, people in the study area face no significant health risk from the presence of natural radionuclides of this area. This study serves as an initial assessment of the inherent specific activities in the study region, and it is advisable to maintain ongoing surveillance of the spatial fluctuations in specific activities going forward. From a statistical standpoint, the presence of a lognormal distribution in 238U, 232Th and 226Ra, coupled with multimodality, highlights the intricate nature of the sediment's attributes. The findings from Pearson’s correlation coefficient analysis underscore a significant correlation between 232Th and 226Ra. Cluster analysis (CA) further reveals that DR, AED and Raeq are predominantly influenced by the presence of 40K.
The findings of this study can serve as a foundational reference point for future research endeavours, while the data collected in this investigation holds potential value for the development of radioactivity mapping. The insights derived from this study were designed to contribute to the identification of sources of radionuclides, understanding their distribution patterns, and assessing potential public health risks associated with them.
Disclosure statement
No potential conflict of interest was reported by the author(s).
Additional information
Funding
References
- Isinkaye OM, Adeleke S, Isah DA. Background radiation measurement and the assessment of radiological impacts due to natural radioactivity around Itakpe iron-ore mines. Mapan. 2018;33:271–280. doi:10.1016/j.jtusci.2014.03.004
- Li B, Wang N, Wan J, et al. In-situ gamma-ray survey of rare-earth tailings dams-a case study in Baotou and Bayan Obo Districts, China. J Environ Radioactiv. 2016;151:304–310. doi:10.1016/j.jenvrad.2015.10.027
- Taha SH, Sallam OR, Abbas AEA, et al. Radioactivity and environmental impacts of ferruginous sandstone and its associating soil. Int J Environ An Ch. 2021;101(15):2899–2908. doi:10.1080/03067319.2020.1715377
- Ebyan OA, Khamis HA, Baghdady AR, et al. Low-temperature alteration of uranium–thorium bearing minerals and its significance in neoformation of radioactive minerals in stream sediments of Wadi El-Reddah, North Eastern Desert, Egypt. Acta Geochim. 2020;39:96–115. doi:10.1007/s11631-019-00335-z
- Paul SN, Frazzoli C, Sikoki FD, et al. Natural occurring radioactive materials (NORMs) from mining sites in Nigeria: A systematic review of geographical distribution and public health concern. J Environ Radioactiv. 2022;249:106889. doi:10.1016/j.jenvrad.2022.106889
- Okasha SA, Faheim AA, Monged MH, et al. Radiochemical technique as a tool for determination and characterisation of El Sela ore grade uranium deposits. Int J Environ An Che. 2023;103(4):737–746. doi:10.1080/03067319.2020.1863388
- Ali MM, Li Z, Zhao H, et al. Characterization of the health and environmental radiological effects of TENORM and radiation hazard indicators in petroleum waste-Yemen. Process Saf Environ. 2021;146:451–463. doi:10.1016/j.psep.2020.11.016
- Abed NS, El Feky MG, El-Taher A, et al. Geochemical conditions and factors controlling the distribution of major, trace, and rare elements in Sul Hamed Granitic Rocks, Southeastern Desert, Egypt. Minerals-Basel. 2022;12(10):1245. doi:10.3390/min12101245
- Ajmal PY, Bhangare RC, Tiwari M, et al. External gamma radiation levels and natural radioactivity in soil around a phosphate fertilizer plant at Mumbai. J Radioanal Nucl Ch. 2014;300(1):23–27. doi:10.1007/s10967-014-2941-4
- Muhammad AN, Ismail AF, Garba NN. Annual effective dose associated with radioactivity in drinking water from tin mining areas in north-western Nigeria. J Radiat Res Appl Sc. 2022;15(3):96–102. doi:10.1016/j.jrras.2022.06.008
- Baborowski M, Büttner O, Morgenstern P, et al. Spatial variability of metal pollution in groyne fields of the Middle Elbe-implications for sediment monitoring. Environ Pollut. 2012;167:115–123. doi:10.1016/j.envpol.2012.03.046
- Gbadamosi MR, Afolabi TA, Ogunneye AL, et al. Distribution of radionuclides and heavy metals in the bituminous sand deposit in Ogun State, Nigeria–A multi-dimensional pollution, health and radiological risk assessment. J Geochem Explor. 2018;190:187–199. doi:10.1016/j.gexplo.2018.03.006
- Lu A, Wang J, Qin X, et al. Multivariate and geostatistical analyses of the spatial distribution and origin of heavy metals in the agricultural soils in Shunyi, Beijing, People’s Republic of China. Sci Total Environ. 2012;425:66–74. doi:10.1016/j.scitotenv.2012.03.003
- Porcelli D, Baskaran M. An overview of isotope geochemistry in environmental studies. In: Baskaran M, editor. Handbook of environmental isotope geochemistry. Advances in isotope geochemistry. Berlin, Heidelberg: Springer; 2012. 1 AND 2; p. 11–32. doi:10.1007/978-3-642-10637-8_2
- Silver Turyahabwa ER, Jurua E, Oriada R, et al. Determination of natural radioactivity levels due to mine tailings from selected mines in Southwestern Uganda. J Environ Earth Sci. 2016;6(6):154–163. http://ir.must.ac.ug/xmlui/handle/123456789/1511.
- Damla N, Alp MS, Yesilkanat CM, et al. Evaluation and analysis of the spatial distribution of radiation risks caused by radon in drinking water of Batman, Türkiye. J Radioanal Nucl Ch. 2022;331(12):5859–5868. doi:10.1007/s10967-022-08670-x
- Perevoshchikov R, Perminova A, Menshikova E. Natural radionuclides in soils of natural-technogenic landscapes in the impact zone of potassium salt mining. Minerals-Basel. 2022;12(11):1352. doi:10.3390/min12111352
- Ajayi OS, Balogun KO, Dike CG. Spatial distributions and dose assessment of natural radionuclides in rocks and soils of some selected sites in southwestern Nigeria. Hum Ecol Risk Assess Int J. 2017;23(6):1373–1388. doi:10.1080/10807039.2017.1312278
- Bramki A, Ramdhane M, Benrachi F. Natural radioelement concentrations in fertilizers and the soil of the Mila region of Algeria. J Radiat Res Appl Sci. 2018;11(1):49–55. doi:10.1016/j.jrras.2017.08.002
- Akpan AE, Ebong ED, Ekwok SE, et al. Assessment of radionuclide distribution and associated radiological hazards for soils and beach sediments of Akwa Ibom Coastline, southern Nigeria. Arab J Geosci. 2020;13:1–12. doi:10.1007/s12517-020-05727-7
- Ekpe EE, Ben UC, Ekwok SE, et al. Assessment of natural radionuclide distribution pattern and radiological risk from rocks in Precambrian Oban massif, southeastern Nigeria. Minerals-Basel. 2022;12(3):312. doi:10.3390/min12030312
- MEERPC - Ministry of Ecology and Environment of the People's Republic of China. HJ 61-2021 Technical specification for radiation environmental monitoring, Beijing; 2021.
- SEPAC - State Environmental Protection Administration of China. HJ/T 166-2004 The technical specification for soil environmental monitoring, Beijing; 2004.
- SAC - Standardization Administration of China, AQSIQ - State General Administration of the People's Republic of China for Quality Supervision and Inspection and Quarantine. GB/T 11743-2013 Determination of radionuclides in soil by gamma spectrometry, Beijing; 2013.
- Liu Y, Zhou W, Gao B, et al. Determination of radionuclide concentration and radiological hazard in soil and water near the uranium tailings reservoir in China. Env Pollut Bioavail. 2021;33(1):174–183. doi:10.1080/26395940.2021.1951123
- Matyskin AV, Stamatopoulos A, O’Brien EM, et al. Production of zirconium-88 via proton irradiation of metallic yttrium and preparation of target for neutron transmission measurements at DICER. Sci Rep-UK. 2023;13(1):1736. doi:10.1038/s41598-023-27993-7
- Wang J, Liu J, Chen Y, et al. Technologically elevated natural radioactivity and assessment of dose to workers around a granitic uranium deposit area, China. J Radioanal Nucl Ch. 2016;310:733–741. doi:10.1007/s10967-016-4809-2
- Kandari T, Prasad M, Pant P, et al. Study of radon flux and natural radionuclides (226Ra, 232Th and 40K) in the Main Boundary Thrust region of Garhwal Himalaya. Acta Geophys. 2018;66(5):1243–1248. doi:10.1007/s11600-018-0158-6
- Gaso M I, González P R, Segovia N. Gamma dose rate and 226Ra activity concentrations in the soil around a Mexican radioactive waste-storage center. J Radioanal Nucl Ch. 2015;303:2321–2331. doi:10.1007/s10967-014-3774-x
- UNSCEAR - United Nations Scientific Committee on the Effects of Atomic Radiation. Sources, effects and risks of ionizing radiation. Report to the general assembly with scientific annexes A and B, New York; 2008.
- Taqi AH, Namq BF. Radioactivity distribution in soil samples of the Baba Gurgur dome of Kirkuk oil field in Iraq. Int J Environ An Ch. 2022;Onile:1–19. doi:10.1080/03067319.2022.2077104
- Kumar E, Subramani T, Li P, et al. Quantification of health and environmental risks due to radionuclides in limestone mining regions of Ariyalur, South India. Hum Ecol Risk Assess Int J. 2022;28(2):243–264. doi:10.1080/10807039.2022.2040000
- ICRP - International Commission on Radiological Protection. 1990 recommendations of the international commission on radiological protection. ICRP Publ 60 Ann ICRP. 1991;21(1-3):1–201.
- Özden S, Aközcan S. Natural radioactivity measurements and evaluation of radiological hazards in sediment of Aliağa Bay, İzmir (Turkey). Arab J Geosci. 2021;14:64. doi:10.1007/s12517-020-06446-9
- Shilpa GM, Anandaram BN, Mohankumari TL. Measurement of activity concentration of primordial radionuclides in soil samples from Thirthahalli taluk and the assessment of resulting radiation dose. J Radioanal Nucl Ch. 2018;316:501–511. doi:10.1007/s10967-018-5788-2
- Pandit P, Mangala P, Saini A, et al. Radiological and pollution risk assessments of terrestrial radionuclides and heavy metals in a mineralized zone of the siwalik region (India). Chemosphere. 2020;254:126857. doi:10.1016/j.chemosphere.2020.126857
- Dindaroğlu T. The use of the GIS Kriging technique to determine the spatial changes of natural radionuclide concentrations in soil and forest cover. J Environ Health Sci Engineer. 2014;12:130. doi:10.1186/s40201-014-0130-6
- WGSRNSERLC-The Writing Group for the Summary Report on Nationwide Survey of Environmental Radioactivity Level in China. Investigation of natural radionuclide contents in soil in China. Radiat Prot. 1992;12(02):122–142.
- An LB, Nguyen VT, Huynh NPT, et al. Activity concentrations of natural radionuclides in soil and water around some quarries and potential human health effects. Water Air Soil Poll. 2023;234(2):122. doi:10.1007/s11270-023-06147-5
- Yasmin S, Barua BS, Khandaker MU. The presence of radioactive materials in soil, sand and sediment samples of Potenga sea beach area, Chittagong, Bangladesh: geological characteristics and environmental implication. Results Phys. 2018;8:1268–1274. doi:10.1016/j.rinp.2018.02.013
- Otoo F, Darko EO, Garavaglia M. Correlation analysis of natural radionuclides, radon exposure, soil particles, and moisture from Quarry Towns in Greater Accra Region, Ghana. Water Air Soil Poll. 2022;233(8):338. doi:10.1007/s11270-022-05791-7
- Khandaker MU, Asaduzzaman K, Sulaiman AFB, et al. Elevated concentrations of naturally occurring radionuclides in heavy mineral-rich beach sands of Langkawi Island, Malaysia. Mar Pollut Bull. 2018;127:654–663. doi:10.1016/j.marpolbul.2017.12.055
- Shuaibu HK, Khandaker MU, Alrefae T, et al. Assessment of natural radioactivity and gamma-ray dose in monazite rich black Sand Beach of Penang Island, Malaysia. Mar Pollut Bull. 2017;119(1):423–428. doi:10.1016/j.marpolbul.2017.03.026
- Satyanarayana GVV, Sivakumar NS, VidyaSagar D, et al. Measurement of natural radioactivity and radiation hazard assessment in the soil samples of Visakhapatnam, Andhra Pradesh, India. J Indian Chem Soc. 2023;100(1):100856. doi:10.1016/j.jics.2022.100856
- Nguelem EJM, Ndontchueng MM, Motapon O. Determination of 226Ra, 232Th, 40K, 235U and 238U activity concentration and public dose assessment in soil samples from bauxite core deposits in Western Cameroon. SpringerPlus. 2016;5(1):1–12. doi:10.1186/s40064-015-1659-2
- Hazou E, Patchali TE, Konzou E, et al. Radiological assessment and statistical approaches of natural radionuclides in soil samples related to phosphate ore activities in the site of Dagbati, southern region of Togo. Water Air Soil Poll. 2022;233(7):237. doi:10.1007/s11270-022-05700-y
- Habib MA, Basuki T, Miyashita S, et al. Distribution of naturally occurring radionuclides in soil around a coal-based power plant and their potential radiological risk assessment. Radiochim Acta. 2019;107(3):243–259. doi:10.1515/ract-2018-3044
- Gaafar I, Hanfia M, El-Ahllb Lina S, et al. Assessment of radiation hazards from phosphate rocks, Sibaiya area, central eastern desert, Egypt. App Radiat Isotopes. 2021;173:109734. doi:10.1016/j.apradiso.2021.109734
- El Zrelli R, Rabaoui L, van Beek P, et al. Natural radioactivity and radiation hazard assessment of industrial wastes from the coastal phosphate treatment plants of Gabes (Tunisia, Southern Mediterranean Sea). Mar Pollut Bull. 2019;146:454–461. doi:10.1016/j.marpolbul.2019.06.075
- Hamideen MS. Correlations study between environmental radioactivity concentrations and some health risk indicators of soil samples in Amman city, Jordan. Int J Environ An Ch. 2022;102(2):380–390. doi:10.1080/03067319.2020.1722812
- Bu H, Tan X, Li S. Temporal and spatial variations of water quality in the Jinshui River of the South Qinling Mts. China. Ecotox Environ Safe. 2010;73(5):907–913. doi:10.1016/j.ecoenv.2009.11.007
- Sardans J, Peñuelas J. Potassium: a neglected nutrient in global change. Global Ecol Biogeogr. 2015;24(3):261–275. doi:10.1111/geb.12259
- Nursapina N A, Shynybek B A, Matveyeva I V. Effect of mineral fertilisers application on the transfer of natural radionuclides from soil to radish (Raphanus sativus L.). J Environ Radioactiv. 2022;247:106863–106863. doi:10.1016/j.jenvrad.2022.106863
- Osman R, Dawood YH, Melegy A. Distributions and risk assessment of the natural radionuclides in the soil of Shoubra El Kheima. 2022;13:98–98. doi:10.3390/atmos13010098
- Jibiri N N, Farai I P, Alausa S K. Activity concentrations of 226Ra, 228Th, and 40K in different food crops from a high background radiation area in Bitsichi. Radiat Environ Bioph. 2007;46:53–59. doi:10.1007/s00411-006-0085-9
- Tanasković I, Golobocanin D, Miljević N. Multivariate statistical analysis of hydrochemical and radiological data of Serbian spa waters. J Geochem Explor. 2012;112:226–234. doi:10.1016/j.gexplo.2011.08.014
- Sivakumar S, Chandrasekaran A, Ravisankar R. Measurement of natural radioactivity and evaluation of radiation hazards in coastal sediments of east coast of Tamilnadu using statistical approach. J Taibah Univ Sci. 2014;8(4):375–384. doi:10.1016/j.jtusci.2014.03.004