
 ?Mathematical formulae have been encoded as MathML and are displayed in this HTML version using MathJax in order to improve their display. Uncheck the box to turn MathJax off. This feature requires Javascript. Click on a formula to zoom.
Abstract
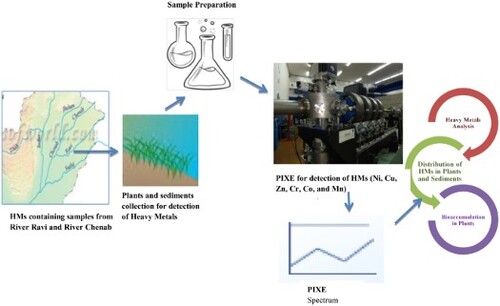
This research highlights the distribution of heavy metals (Ni, Cu, Zn, Cr, Co and Mn) in Ravi and Chenab and assesses their effect on ecosystem health. Samples of plant species and sediments at eight sampling sites were collected and analysed by the PIXE technique. Heavy metal concentrations (µg/g) of Zn (7.98–411.23), Ni (12.59–209), Cu (3.74–38.77) and Mn (0–730.21) in river Ravi and concentrations of Zn (49.32–274.30), Ni (1.05–141.21) and Mn (41.66–519.47) in river Chenab were found to be high but Heavy metal concentration in the two compartments were in the following order plants > sediments. Heavy metals of sediments and plants depict that there are significant correlations between Cu (0.994), Zn (0.986) and Cr (0.978) in river Ravi and Ni (1.000), Zn (.990) and Cr (.978) in river Chenab. The results show the potential of heavy metals from plants in two rivers of Pakistan.
GRAPHICAL ABSTRACT
1. Introduction
The rapid population growth and increased anthropogenic activities have led to the deterioration of surface and groundwater quality. Among the major contributors to water pollution include organic and inorganic wastes [Citation1–3]. Heavy metal pollution in aquatic environments has become a severe worldwide problem. Heavy metals are present at low concentrations naturally. Due to anthropogenic activities and natural disasters, the level of heavy metals in aquatic ecosystems is increasing [Citation4]. The build-up of heavy metals can reach toxic concentrations for living organisms in the ecosystems. In developing countries, many industries release untreated wastewater containing heavy metals which causes many pressing environmental issues [Citation5]. These are non-degradable and persistent in nature and cause severe water pollution, biomagnification and bioaccumulation along the eco-chain [Citation6–11].
Heavy metals are released into the rivers in the form of finely grinned particles, which are capable of being incorporated as part of sediments act as an excellent sink and adsorb various kinds of heavy metals and play a key role in their remobilization within rivers [Citation12]. The chemical nature of heavy metals in the environment is significant because it determines their recycling activity and toxic behaviour to aquatic organisms [Citation13–15]. Sediments are a source of food for benthic fauna and aquatic plants [Citation16–18]. The fish consume benthic fauna and flora and contribute to the biomagnification of heavy metals. When heavy metal pollution exceeds the ecosystem’s capacity then it poses severe impacts on ecosystem services and human health. That is why a study of heavy metal distribution in various compartments of aquatic systems and their transfer in the ecosystem are important so that treatment or remedial measures can be taken.
River Ravi and Chenab are freshwater ecosystems of Pakistan, which have high importance concerning water availability to the agriculture of a wide area of Punjab. Untreated sewage and industrial effluents from various cities are being dumped into rivers Ravi and Chenab [Citation19]. Various organic pollutants, pesticides and heavy metals present in these wastes are a source of diseases for human beings and other living organisms. The Ravi river has been reported to be heavily polluted with heavy metals, which had severely degraded its ecosystem [Citation20]. Nallaaik containing industrial, agricultural and sewerage wastewater from Sialkot and Wazirabad is the main source of heavy metal pollution (Cr, Zn and Fe) in river Chenab [Citation21]. River Ravi is essentially dead [Citation22,Citation23] and serving as a point source of pollution for river Chenab and ultimately the river Indus. So, Ravi−Chenab watershed (Rechna Doab) is under severe pollution and habitat degradation threats.
Therefore, it is important to investigate the distribution and enrichment of heavy metals in sediments and the pollution status of rivers Ravi and Chenab. In this study, the concentrations of heavy metals in sediments and plants were measured and correlated. It is expected that the results of this study will generate basic data about the ecosystem health of these two rivers and will guide further research for the restoration and improvement of these ecosystems. This study was, therefore, based on the analysis of toxic heavy metals contained in the river sediments and aquatic plants present there.
2. Material and methods
2.1. Study area
Rivers Ravi and Chenab are two of the five major tributaries of the river Indus in Punjab. The area between the two rivers, known as the Rachna Doab (“land between the two rivers”), occupies nearly 3000 km2. The agricultural production in the area between these two rivers is supported by five canal commands and as many inter-basin canals. At present, it is one of the most densely populated and agriculturally wealthiest areas in the Province of Punjab [Citation24].
River Ravi flows through a length of 720 km in Pakistan and India. Its geographic coordinates are 30°35′−30.583°N and 71° 49′− 71.817° E. This is the smallest river in Punjab. Lahore, the second biggest city in the country is located on the bank of river Ravi. The connecting point of Ravi between the two countries is called the Ravi siphon and this is exactly the same point from where river Ravi enters into Pakistan. This river has two structures built on it, i.e. Head Baloki and Sidnai Headwork’s. One of the main tributaries of Ravi is the Hudiara drain which receives untreated industrial effluents (potential source of heavy metals) and sewage waste from Pakistan and India.
Chenab is the second largest river of Punjab in Pakistan, having a length of 960 kilometres. It starts from Jammu and Kashmir with geographic coordinates 32°44′N 77°26′E and enters into the Punjab province of Pakistan. River Chenab joins river Jhelum at Trimmu and river Ravi at Ahmed PurSial. Downstream to this, river Sutlej and Chenab merge at Punjned. Finally, the river Chenab joins the river Indus at Mithankot.
2.2. Sample collection and preparation
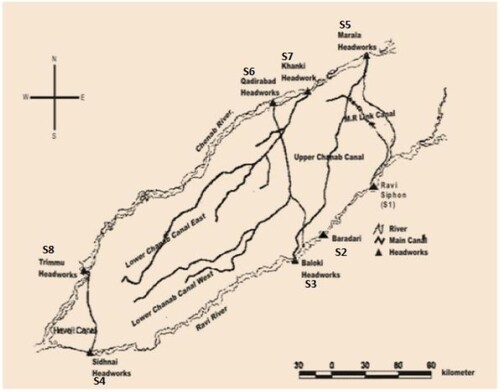
Sampling was done from eight sites of river Ravi and Chenab. River Ravi sampling sites were Ravi siphon (S1) Baradari (S2), Head Baloki (S3) and Head Sidnahi (S4). Sampling sites of river Chenab were Head Marala (S5), Head Qadir Abad (S6), Head Khanki (S7) and Head Trimmu (S8). Sites S1 and S5 were on the upstream side and were used as reference points (Figure ). The sample was collected in early summer (April−May) and at the peak of the monsoon. The monsoon season in the study area started from the first week of July and culminates in mid-September. Most of the floods follow result in the deposition of new alluvial soil in catchment areas.
Figure 1. Map showing all sampling points (Headwork’s) of rivers Ravi and Chenab.
2.3. Methodology for plant samples
Plant samples collected from sampling sites were washed with tap water and then rinsed twice with distilled water before storing in zipped bags. Samples were oven-dried at 40°C and were crushed to powder form employing an agitating motor (Shenzhen Haocheng company). Graphite powder of high purity by Merck was added to samples in the ratio of 4:1 by weight and was mixed properly. This was done to avoid problems related to charging in PIXE (particle-induced x-ray emission) measurements [Citation25]. Then 200 µL of 2-wt % polyvinyl alcohol, which acts as a binder, was mixed with the sample. All the chemicals used were of analytical grades. Plant samples were subjected to drying under IR lamp and pressed to make sediment pellets (18 mm diameter) having a thickness of 2 mm.
The ratio of heavy metal concentration presents in aquatic plant species to sediments in the river is known as the bio-concentration factor, it was calculated by using the following equation:
(1)
(1)
2.4. Methodology for sediment samples
Sediment samples were collected from upstream and downstream sites of various barrages of river Ravi and Chenab. Five samples were collected from each site. Sediment samples were collected at a depth of 5–10 cm by a corer of stainless steel, kept in plastic jars, and then placed in an icebox. In the laboratory, samples were stored in a deep freezer at −20°C. Samples were finely powdered by crushing and sieving through a fine 90-µm sieve. Then samples were allowed to stand at 105°C for 72 h to eliminate humidity. A circular die having a 25 mm diameter was used for palletizing samples by applying 100 kN press. As a result, 2.3 mm thick pellets were obtained. Sediment pellets were kept in dry conditions for 24 h before their placement in a vacuum chamber for analysis [Citation26].
2.5. PIXE measurements
PIXE has been used widely in trace-element analysis in inorganic and organic samples. Elemental concentrations of heavy metals like Cu, Cr, Mn, Ni and Zn were measured by PIXE. PIXE analysis has several advantages over other commonly used elemental analytical techniques such as inductively coupled plasma-mass spectrometry (ICP-MS) where sample chemical states can affect atom ionization. Unlike ICP-MS, samples can be analysed directly with PIXE for the quantification of elements [Citation27]. The analysis was carried out on a 6S DH2 pellet on the accelerator. A 3 MeV proton beam was allowed to fall on the sample placed in the centre of the target chamber. Then X-rays coming from the sample crossed a 25 µm thick mylor window and entered a 30 mm Si (Li) detector placed at an angle of 135 with respect to the proton beam. The resolution of this detector was adjusted at 180 (electron volt) at 6.4 keV. The current of the beam at the target sample was kept at 8 nA to reduce dead time corrections and its piple-up spectra. The Guelph software was used to analyse the PIXE spectrum [Citation28].
2.5.1. Statistical analysis
A statistical analysis was done by using SPSS.22 to calculate the Pearson correlation of heavy metals in sediments and heavy metals in plants at various barrages of rivers Ravi and Chenab.
3. Results and discussion
3.1. Distribution of heavy metals in the sediments
The heavy metal concentrations in the sediments of river Ravi are presented in Table . The concentration (µg/g) range in the sediments of river Ravi was found to be as Cr 4.89–40.42, Mn 0–730.21, Ni 12.59–209.10, Cu 3.74–38.77, Zn 7.98–411.23 and Co 2.99–11.21. The maximum concentrations of Cr, Mn, Cu and Zn were at S2 and Ni showed the highest concentration at S4, while the maximum concentration of Co was found at S3. A comparison with the reference standard from the United States Environmental Protection Agency [Citation29] showed that most sites of river Ravi have close to or higher heavy metal concentrations (Table ). The only upstream site S1 had lower heavy metal concentrations. Cr at S2 and Cu at S3 had concentrations close to standards. Concentrations of Zn, Ni, Mn and Cu in S2, Zn, Mn and Ni in S3 and Ni and Zn in S4 were higher than standards (Table ). Similarly, heavy metal concentrations in sediments of river Ravi were found in the following order: Cu > Cr > Cd > Co [Citation26].
Table 1. Heavy metal concentration (mean ± standard error µg/g) in sediments at various barrage sites of river Ravi.
Heavy metal concentrations in sediments of river Chenab are presented in Table . Sediments of river Chenab have concentrations range (µg/g) as follows Cr 7.15−29.12, Mn 41.66–519.47, Ni 1.05–141.21, Cu 8.59–21.89, Zn 49.32–274.30 and Co 1.22–7.90. When compared with standards, it was found that most sites have lower concentrations of heavy metals in sediments. Concentrations of Zn, Ni, and Mn in S7 and Zn at S8 were found higher than the limits. Moderate to high levels of Cu and Zn in sediments were also found in the Tisza river (Serbia) [Citation30].
Table 2. Heavy metal concentration (mean ± standard error, µg/g) in sediments at different barrage of river Chenab.
The results of this study showed that three out of 75% of sites of river Ravi have higher concentrations of heavy metals in their sediments. They were S2, S3 and S4. Among these S2 sites showed the highest and S1 had the lowest. The high pollution of heavy metals in various locations of Ravi was caused by the disposal of industrial and municipal waste of Lahore city at S2 and S3 sites while S4 is at the upstream site, so there are no human activities.
In the case of river Chenab, S7 and S8 sites were found to have higher heavy metal concentrations as compared to limits, while all other sites had lower values of heavy metal concentrations. High Zn, Mn and Ni levels at S7 (Khanki) may be due to receiving wastewater from Nalla Aik containing municipal and industrial wastes of Sialkot and Wazirabad [Citation21]. The Paharang drain carrying municipal and industrial water of Faisalabad joins river Chenab near Jhang upstream to Trimmu, so Zn concentration was found to be high at the Trimmu site (S8).
3.2. Distribution of heavy metals in aquatic plants
Tables and show that different aquatic plants have different capacities to absorb various heavy metals in the following order: Cu > Cr > Zn in river Ravi and Co > Zn > Cr in river Chenab. Results showed that plants, i.e. Pistia stratiotes and Typha angustifolia in S2 (Cu − 85.43) and S3(Cu – 90.70) of river Ravi (Table ) and Polygonum aviculare at S8 (Zn – 97.30) of river Chenab (Table ) had high heavy metal concentrations. In all sampling sites of river Ravi and Chenab, heavy metal concentrations show similar trends in two compartments as follows sediment > plant. Some plants show high levels of Zn, Cu, Cr and Ni. This depicts their stronger ability to absorb these metals. This may be due to two reasons; first, these plants are present at polluted sites, and second, these plants have a high potential to absorb these metals.
Table 3. Bioconcentration factor of heavy metals in plants of river Ravi.
Table 4. Bioconcentration Factor of heavy metals in plants of River Chenab.
Analysis of heavy metals in aquatic plants is a critical approach to assessing heavy metal contamination in rivers. Table shows the heavy metal bioconcentration factor in aquatic plants gathered from different sampling sites of river Ravi. Bioconcentration factors of Cr, Mn, Ni and Cu were higher in S2 and S3. The Co bioconcentration factor was higher in S3. The Zn bioconcentration factor was higher in S2, S3 and S4. The levels of heavy metals in aquatic plants of river Chenab are presented in Table . The bioconcentration factors of all heavy metals (Zn, Cr, Mn, Co, Ni, and Cu) were high at S8, while the Mn bioconcentration factor was high at S7.
Heavy metals distribution in river Ravi plants and Chenab was different. It was observed that different plants have different abilities to enrich heavy metals in a specific order (Table ). Results showed that the ratio of uptaking Zn, Cr and Cu (Table ) by plants was relatively high.
Different plants showed a distinct trend in heavy metal uptake (%). The bioconcentration factor of Zn was more than 90 in Polygonum aviculare at two sites of river Chenab, which shows that this plant has a high uptake efficiency of Zn (Table ). It was also found that Polygonum aviculare accumulates higher concentrations of Zn near to criteria for hyperaccumulator plants [Citation31]. T. angustifolia showed a high Cr bioconcentration factor i.e. 91.89 µg/g Chenab and 82.14 in Ravi. T. angustifolia was also found to be a good Cr accumulator. Pistia stratiotes showed good Cu and Co uptake as compared to all other plants. The bioconcentration factor of Cu was 90.70 in river Ravi (Table ). It was found that Pistia stratiotes are excellent Cu accumulators [Citation32]. Polygonum bar and Echinocloacruss gulli did not show any heavy metal uptake. The reason is that both of these plants were sampled at the upstream side of river Ravi and Chenab, respectively, where heavy metal concentration was deficient.
3.3. Heavy metal correlation in sediment and plants
It was found that correlations of Cu (0.994*), Zn (0.986*) and Cr (0.978*) were significant in river Ravi (Table ), while the correlations of Ni (1.000*), Zn (0.990*) and Cr (0.978*) were significant in river Chenab (Table ). Strong correlations of Cr are due to the high uptake efficiency of the plant, although it is present at low concentrations as compared to standards. Strong correlations in the case of Zn may be due to the high abundance of Zn in both rivers. A significant correlation of Cu in river Ravi is due to their high concentration. Ni concentration in river Ravi is high at various sites and shows a significant correlation only in river Chenab due to the high uptake efficiency of Ni in its plants. These results showed that there is remobilization and accumulation of heavy metals from sediments to aquatic plants as reported by Engin et al. [Citation33].
Table 5. Pearson correlation of heavy metals in sediments with heavy metals in plants at various barrages of river Ravi.
Table 6. Pearson correlation of heavy metals in sediments with heavy metals in plants at various barrages of river Chenab.
4. Conclusions
Sediments of river Ravi (at Baradari and Baloki sites) and Chenab (at Khanki and Trimmu sites) showed high heavy metal concentrations. Sources of heavy metals are mainly untreated industrial and municipal wastewater discharges into both rivers. Respective high heavy metal concentration in aquatic plants of both rivers depicts the remobilization of heavy metals along the eco-chain from sediment to plants. The correlations of heavy metals in sediments and plants were strong for Zn, Cu, Ni and Cr in both rivers. There exists no correlation between Mn and Co between sediment and plants. Some plants showed high bioconcentration of specific metals, i.e. Polygonum avicultare for Zn, T. angustifolia for Cr and Pistia stratiotes for Cu, which depicts that these plants can be used as hyperaccumulators in pollution removal programmes. The government agencies should monitor the industrial zones. They must facilitate cost-effective ways for the treatment of metal-containing discharges at the source or near an industrial zone at the start of the main drain. This will save the whole of the soil-water-plant-human-animal system from heavy metals.
Disclosure statement
No potential conflict of interest was reported by the author(s).
Additional information
Funding
References
- Hussain B, Sultana T, Sultana S, et al. Pollutant fate and spatio-temporal variation and degree of sedimentation of industrial-and municipal wastes in Chakbandi drain and River Chenab. Saudi J Biol Sci. 2018;25(7):1326–1331. doi:10.1016/j.sjbs.2018.08.015
- Iqbal J, Shah NS, Sayed M, et al. Deep eutectic solvent-mediated synthesis of ceria nanoparticles with the enhanced yield for photocatalytic degradation of flumequine under UV-C. J Water Process Eng. 2020;33:101012. doi:10.1016/j.jwpe.2019.101012
- Shah NS, Khan JA, Sayed M, et al. Synergistic effects of H2O2 and S2O82− in the gamma radiation induced degradation of Congo-red dye: kinetics and toxicities evaluation. Sep Purif Technol. 2020;233:115966. doi:10.1016/j.seppur.2019.115966
- Iqbal J, Du Y, Howari F, et al. Simultaneous enrichment and on-line detection of low-concentration copper, cobalt, and nickel ions in water by near-infrared diffuse reflectance spectroscopy combined with chemometrics. J AOAC Int. 2017;100:560–565. doi:10.5740/jaoacint.16-0224
- Bali M, Tlili H. Removal of heavy metals from wastewater using infiltration-percolation process and adsorption on activated carbon. Int J Environ Sci Technol. 2019;16(1):249–258. doi:10.1007/s13762-018-1663-5
- Mays PA, Edwards GS. Comparison of heavy metal accumulation in a natural wetland and constructed wetlands receiving acid mine drainage. Ecol Eng. 2001;16(4):487–500. doi:10.1016/S0925-8574(00)00112-9
- Armitage PD, Bowes MJ, Vincent HM. Long-term changes in macro invertebrate communities of a heavy metal polluted stream: the river Nent (Cumbria, UK) after 28 years. River Res Appl. 2007;23(9):997–1015. doi:10.1002/rra.1022
- Jabeen F, Chaudhry AS. Monitoring trace metals in different tissues of Cyprinus carpio from the Indus River in Pakistan. Environ Monit Assess. 2010;170(1–4):645–656. doi:10.1007/s10661-009-1263-4
- Li L, Iqbal J, Zhu Y, et al. Chitosan/Ag-hydroxyapatite nanocomposite beads as a potential adsorbent for the efficient removal of toxic aquatic pollutants. Int J Biol Macromol. 2018;120(Pt B):1752–1759. doi:10.1016/j.ijbiomac.2018.09.190
- Jamshaid A, Hamid A, Muhammad N, et al. Cellulose-based materials for the removal of heavy metals from wastewater–an overview. Chem Bio Eng Rev. 2017;4(4):240–256. doi:10.1002/cben.201700002
- Naseer A, Jamshaid A, Hamid A, et al. Lignin and lignin-based materials for the removal of heavy metals from wastewater – an overview. Z Phys Chem. 2019;233(3):315–345. doi:10.1515/zpch-2018-1209
- Ikem A, Egiebor NO, Nyavor K. Trace elements in water, fish and sediment from Tuskegee Lake, Southeastern USA. Water Air Soil Pollut. 2003;149(1–4):51–75. doi:10.1023/A:1025694315763
- Farkas A, Erratico C, Vigano L. Assessment of the environmental significance of heavy metal pollution in surficial sediments of the River Po. Chemosphere. 2007;68(4):761–768. doi:10.1016/j.chemosphere.2006.12.099
- Iqbal J, Shah NS, Sayed M, et al. Synergistic effects of activated carbon and nano-zerovalent copper on the performance of hydroxyapatite-alginate beads for the removal of As3 + from aqueous solution. J Clean Prod. 2019;235:875–886. doi:10.1016/j.jclepro.2019.06.316
- Subedi N, Lähde A, Abu-Danso E, et al. A comparative study of magnetic chitosan (Chi@Fe3O4) and graphene oxide modified magnetic chitosan (Chi@Fe3O4GO) nanocomposites for efficient removal of Cr(VI) from water. Int J Biol Macromol. 2019;137:948–959. doi:10.1016/j.ijbiomac.2019.06.151
- Khan NA, Ahmad A, Nomani AA, et al. Atomic absorption spectrophotometric studies of cadmium and zinc in commercial fertilizers, soils and river waters. Environ Pollut Ser B: Chem Phys. 1981;2(4):259–264. doi:10.1016/0143-148X(81)90023-9
- Vardanyan LG, Ingole B. Studies on heavy metal accumulation in aquatic macrophytes from seven (Armenia) and Carambolim (India) lake systems. Environ Int. 2006;32(2):208–218. doi:10.1016/j.envint.2005.08.013
- Yi Y, Yang Z, Zhang S. Ecological risk assessment of heavy metals in sediment and human health risk assessment of heavy metals in fishes in the middle and lower reaches of the Yangtze River basin. Environ Pollut. 2011;159(10):2575–2585. doi:10.1016/j.envpol.2011.06.011
- Haider H, Ali W. Development of dissolved oxygen model for a highly variable flow river: a case study of Ravi River in Pakistan. Environ Model Assess. 2010;15(6):583–599. doi:10.1007/s10666-010-9240-4
- Javed M, Hayat S. Effect of waste disposal on the water quality of river Ravi from Lahore to head Baloki, Pakistan. Proc Pakistan Cong Zool. 1995;15:41–51.
- Qadir A, Malik RN, Husain SZ. Spatio-temporal variations in water quality of Nullah Aik-tributary of the river Chenab, Pakistan. Environ Monit Assess. 2008;140(1–3):43–59. doi:10.1007/s10661-007-9846-4
- Khan M, Khan HN, Aslam H. Hudiara drain. A case of trans-boundary water pollution between India and Pakistan. Pak J Biol Sci. 2003;6(2):167–175. doi:10.3923/pjbs.2003.167.175
- Javed M. Studies on metal contamination levels in plankton and their role as biological indicator of water pollution in the River Ravi. Pak J Biol Sci. 2006;9(2):313–317. doi:10.3923/pjbs.2006.313.317
- Khan S, Tariq R, Yuanlai C, et al. Can irrigation be sustainable? Agric Water Manag. 2006;80(1–3):87–99. doi:10.1016/j.agwat.2005.07.006
- Duval A, Guicharnaud H, Dran JC. Particle induced X-ray emission: a valuable tool for the analysis of metalpoint drawings. Nucl Instrum Methods Phys Res Sect B. 2004;226(1–2):60–74. doi:10.1016/j.nimb.2004.02.020
- Rauf A, Javed M, Ubaidullah M, et al. Assessment of heavy metals in sediments of the river Ravi, Pakistan. Int J Agri Biol. 2009;11(1):197–200.
- Ishii K. PIXE and its applications to elemental analysis. Quant Beam Sci. 2019;3(2):12. doi:10.3390/qubs3020012
- Hossen ML, Abedin MJ, Akter S. Pixe for elemental analysis of domestic medicinal plants in Bangladesh. Int J Recent Adv Phys. 2016;5(3/4):1–8. doi:10.14810/ijrap.2016.5401
- US EPA. (1999). National recommended water quality criteria correction office of water, EPA 822-Z-99-001, 25 pp.
- Sakan SM, Dordevic DS, Manojlovic DD, et al. Assessment of heavy metal pollutants accumulation in the Tisza river sediments. J Environ Manage. 2009;90(11):3382–3390. doi:10.1016/j.jenvman.2009.05.013
- González RC, González-Chávez MCA. Metal accumulation in wild plants surrounding mining wastes. Environ Pollut. 2006;144(1):84–92. doi:10.1016/j.envpol.2006.01.006
- Odjegba VJ, Fasidi IO. Accumulation of trace elements by Pistia stratiotes: implications for phytoremediation. Ecotoxicology. 2004;13(7):637–646. doi:10.1007/s10646-003-4424-1
- Engin MS, Ahmet U, Seydahmet C. Investigation of trace metals distribution in water, sediments and wetland plants of Kızılırmak Delta, Turkey. Int J Sediment Res. 2017;32:90–97. doi:10.1016/j.ijsrc.2016.03.004