
Abstract
In this study, oxidative stress-related genes (OSRGs) were used to discover membranous nephropathy (MN) genes, evaluate their biological activities and molecular pathways, and develop regulatory networks for drugs, miRNAs and transcription factors. All 862 differentially expressed genes (DEGs) in the GSE108113 dataset were evaluated using the gene expression matrix. Cross-testing of 437 OSRg in the gene cards revealed 28 DE-OSRG genes. We performed the KEGG and gene ontology enrichment studies. Response to reactive oxygen species, chemical stress, oxidative stress, bound globin-hemoglobin complex, endocytic vesicle lumen, blood microparticles, conjugated globin binding, peroxidase activity and heme binding are the major GO-enriched active DE-OSRGs. As in the KEGG pathway study. After excluding the disconnected genes, 19 DE-OSRGs were introduced into the PPI network, and the top five CDE-OSRGs were found: G6PD, HBB, TP 53, KEAP 1, and PXDN. The ROC curve study shows the CDE-OS.
1. Introduction
Adult nephrotic syndrome is mostly caused by Membranous Nephropathy (MN). Membranous nephropathy is a disease in which immune complexes deposit on the basement membrane of glomerular capillaries, leading to basement membrane lesions. It is characterized by nephrotic syndrome, including proteinuria, hypoalbuminemia, hyperlipidemia, and edema [Citation1, Citation2]. Idiopathic membranous nephropathy accounts for 75%∼80% of the total incidence rate of membranous nephropathy. Its specific cause has not been determined yet, and its pathogenesis is complex. It is generally believed that the deposition of immune complexes causes damage to the basement membrane and podocytes, resulting in proteinuria [Citation3]. At present, the clinical treatment mainly includes symptomatic support treatment, including rest, sodium restriction, reasonable protein and calorie intake, diuretic detumescence, ACEI/ARB urine protein lowering, statins for lipid regulation, preventive anticoagulation and other measures. Corticosteroids and cytotoxic drugs can also be used for immunosuppressive therapy [Citation4].
Oxidative stress (OS) is a condition in which the body’s oxidative and antioxidant actions are out of balance, leading to oxidation and inflammatory neutrophil infiltration, elevated protease release, and a high concentration of oxidative intermediates [Citation5]. OS is an important mechanism in immune response, mainly formed by intracellular oxidation processes, involving complex gene expression and signal transduction networks. OS can be achieved through the regulation of oxidative stress-related genes (OSRGs) (mainly composed of nuclear factors, proteases, antioxidant factors and detoxification enzymes) [Citation6]. OS works both ways. It is a harmful byproduct of free radicals in the body that is thought to play a major role in ageing and disease. Secondly, it can preserve the body’s regular biological processes and serve as a crucial benchmark for the diagnosis, treatment, and prevention of a wide range of illnesses [Citation7, Citation8].
Targeted drugs refer to drugs or their formulations that have been endowed with targeting ability. Its purpose is to enable drugs or their carriers to target specific lesion sites and accumulate or release effective ingredients at the target site. Targeted formulations can form relatively high concentrations of drugs in the target area, thereby improving drug efficacy while suppressing toxic side effects and reducing damage to normal tissues and cells. In the preparation of drugs, the physiological structural characteristics of specific tissues and organs can be utilized to enable natural distribution differences of drugs in the body, thereby achieving targeted effects. There are also various methods, including coupling probe molecules that can specifically bind to target molecules such as antibodies, peptides, sugar chains, nucleic acid aptamers, etc., to the surface of drugs or their carriers through chemical or physical methods to achieve targeted effects.
At present, there are few literature reports on the molecular mechanism of MN based on OSRGs. So, in this study, the Gene Expression Omnibus (GEO) differentially expressed oxidative stress-related genes (DE-OSRGs) were used among MN individuals, and the general population was found using the GeneCards dataset. The biological functions and molecular pathways associated with these genes were then investigated, furthermore by building a protein–protein interaction (PPI) network, core DE-OSRGs (CDE-OSRGs) were further discovered. For these genes, correlation and receiver operator characteristic (ROC) curve analyses were carried out. Finally, the outcome explores the interaction between CDE-OSRGs and targeted drugs and predicts CDE-OSRGs binding miRNAs and transcription factors (TFs).
2. Materials and methods
2.1. Acquisition and organization of sample data
The clinical data associated with the dataset GSE108113 was obtained from the GEO database (https://www.ncbi.nlm.nih.gov/geo/) [Citation9]. Following this, probe IDs in the original matrix were converted into gene symbols, gene labeling was performed using the platform annotation file, and expression values were log2 transformed [Citation10]. As a result, the gene expression matrix of MN, consisting of 87 MN samples and 11 healthy control (NC) samples, was obtained.
2.2. Differential expression gene analysis in MN
The R packages limma, pheatmap, and ggplot2 were used to conduct a statistical test on the gene expression matrix in order to determine the differentially expressed genes (DEGs) among the MN and NC categories. As a consequence, the DEGs and their expression values were extracted and visualized via a heatmap and volcano map [Citation11, Citation12].
2.3. Determining the genes linked to oxidative stress that are differently expressed in Minnesota
Getting a list of genes associated with oxidative stress (OSRGs) from the GeneCards database (https://www.genecards.org/) [Citation13] was our initial step. Next, intersections between OSRGs and DEGs were discovered using the R programme VennDiagram. This allowed us to identify the genes that are connected to differentially expressed oxidative stress (DE-OSRGs) [Citation14]. As a final step, these DE-OSRGs were visualized, and their location was determined by their distribution in human chromosomes [Citation15].
2.4. GO and KEGG enrichment analyses of DE-OSRGs
The names of DE-OSRGs were first translated into gene IDs compatible with the R language [Citation16] using the R package org.Hs.eg.db. Then, to clarify the biological significance of the DE-OSRGs, Gene Ontology (GO) enrichment analysis was performed on the DE-OSRGs, which include biological processes (BP), molecular functions (MF), as well as cellular components (CC), using the R packages clusterProfiler, enrichplot, ggplot2, as well as GOplot. Furthermore, Kyoto Encyclopaedia of Genes and Genomes (KEGG) enrichment analysis was carried out on the DE-OSRGs to pinpoint important pathways that are intimately linked to the control of the growth and advancement of MN [Citation17, Citation18].
2.5. Protein–protein interaction (PPI) network analysis
A comprehensive examination of the interaction between regulatory proteins associated with DE-OSRGs in the MN biological system was conducted via the STRING database (http://www.string-db.org/) [Citation19]. Thus, the cytoHubba plugin in Cytoscape software was used to identify core genes inside the protein–protein interaction (PPI) network. The Degree approach was used to designate the top five hub genes as core DE-OSRGs (CDE-OSRGs). Finally, the PPI network and CDE-OSRGs subnetwork were visualized [Citation20].
2.6. Correlation analysis and receiver operator characteristic (ROC) curve analysis of CDE-OSRGs
Boxplots 21 and 22 were used to display the relative expression levels of CDE-OSRGs in various samples using the R packages limma and ggpubr. These levels were retrieved using the gene expression matrix and compared to the differential expression of these genes within the MN and NC categories [Citation21, Citation22]. To verify the diagnostic accuracy of CDE-OSRGs, an ROC curve was constructed by referencing R packages glmnet and pROC, using the quantitative accuracy metric of the area under the ROC curve (AUC) [Citation23]. Additionally, the correlation among CDE-OSRGs was assessed using the R packages ggplot2, ggpubr, ggExtra, corrplot, and circlize (correlation coefficient > 0.3 and P value < 0.05 were deemed statistically significant). Additionally, scatter plots and a correlation heat map were created for visualization [Citation24].
2.7. Examination of the relationship among target medications and CDE-OSRGs
The Drug-Gene Interaction database (DGIdb) (https://dgidb.genome.wustl.edu/), which serves as a comprehensive collection of Drug-Gene Interactions, provides genetic data related to both established and potential drugs [Citation25, Citation26]. In this study, the search field was initially populated with CDE-OSRGs. Subsequently, filtering conditions were applied to specify the drug type as Approved, Antineoplastic and Immunotherapies. The default selections for database source, gene category, and interaction type were maintained. Following this, the resulting gene-drug interaction file was downloaded. Finally, the software Cytoscape was utilized to visualize the interaction between the CDE-OSRGs and the target drugs.
2.8. Prediction of miRNAs and transcription factors (TFs) binding to CDE-OSRGs
An extensive atlas of miRNA (or TF) – target gene interactions is available at https://www.mirnet.ca/, the home of the miRNet database [Citation27]. 14 distinct miRNA databases are integrated (TarBase, miRTarBase, miRecords, miRanda, miR2Disease, HMDD, PhenomiR, SM2miR, PharmacomiR, EpimiR, starBase, TransmiR, ADmiRE, and TAM 2.0) with regard to functional annotation information [Citation28]. First, a list of CDE-OSRGs was added to the search box of the database, with “Organism” selected as “Homo sapiens”, “ID type” selected as “Official gene symbol”, “Tissue” selected as “Kidney”, “Targeted by” selected as “miRNA” and “TF” then the information was submitted and the table of the interaction between miRNAs (TFs) and CDE-OSRGs was downloaded. Finally, Cytoscape software was used to visualize the interactions and regulatory relationships between them.
3. Results
3.1. Identification of DE-OSRGs in MN
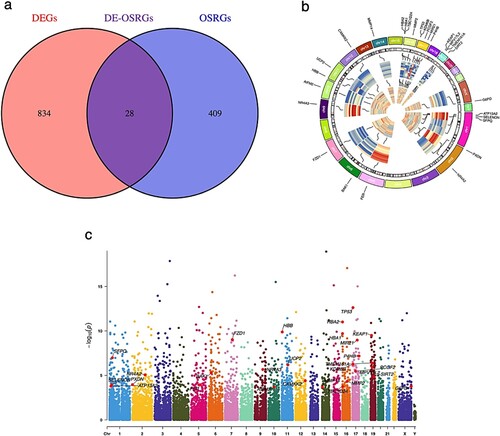
The initial step involved compiling dataset GSE108113, which consisted of 87 MN and 11 NC samples, to create an expression matrix encompassing 24,889 genes (refer to Supplementary file Gene expression matrix.xls). Subsequently, a differential gene expression analysis was conducted to identify a total of 862 DEGs that distinguished the MN group from the NC group. This group included 496 genes with low expression and 366 genes with high expression (Figure (a)). The top 50 genes with the most notable variations in expression were shown visually in the heat map (Figure (b)). Furthermore, 437 OSRGs were collected from the GeneCards database and intersected with these DEGs and OSRGs to produce 28 DE-OSRGs (Figure (a)). Figure (b) and (c) show the location distribution of these DE-OSRGs in 23 pairs of human chromosomes.
Figure 1. The volcano plot (a) and heatmap (b) of DEGs expressed between the MN and NC groups. Red dots or squares indicate highly expressed genes; Green dots or blue squares indicate lowly expressed genes.
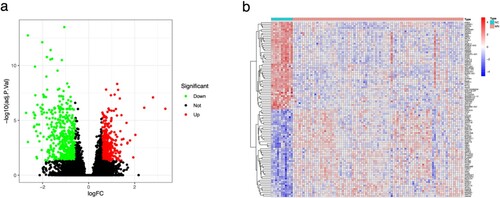
Figure 2. (a) The Venn diagram of overlapped genes (DE-OSRGs). (b, c) The location distribution of these DE-OSRGs in 23 pairs of human chromosomes.
3.2. Function and pathway enrichment of DE-OSRGs in MN
GO and KEGG enrichment analyses were performed to investigate the possible function of the 28 DE-OSRGs. According to the results of the GO enrichment study, the primary roles of BP are in the metabolic processes of reactive oxygen species, chemical stress and oxidative stress response control. Functions of CC were related to haptoglobin−hemoglobin complex, endocytic vesicle lumen, blood microparticle, ribosomal subunit, and heterochromatin. MF functions included haptoglobin binding, peroxidase activity, heme binding, tetrapyrrole binding, nuclear glucocorticoid receptor binding, and molecular carrier activity (Figure (a)). In the KEGG pathway analysis, DE-OSRGs mainly affected African trypanosomiasis, Malaria, Proteoglycans in cancer, Basal cell carcinoma, Hepatocellular carcinoma, Bladder cancer, Fluid shear stress, Thyroid cancer, and atherosclerosis, Gastric cancer and Breast cancer, etc. (Figure (b)).
Figure 3. Bar graphs displaying the GO results (a) and KEGG (c) analyses of enrichment.
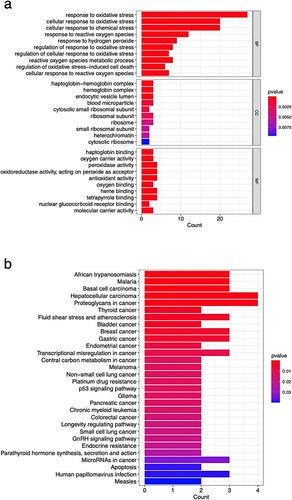
Gene counts that are enriched in various GO items or KEGG pathways are plotted on the x-axis, and descriptions of these GO items or KEGG pathways are plotted on the y-axis. The P-value is represented by the colour of the bar graph, while the gene count is shown by its length.
3.3. PPI network of DE-OSRGs in MN
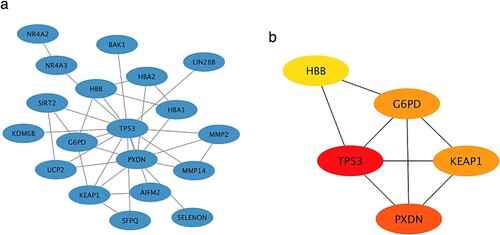
A total of 19 DE-OSRGs (the disconnected genes were removed) were introduced into the PPI network, followed by an analysis to assess the connectivity of each DE-OSRG within the interaction network. This analysis led to the identification of the top five DE-OSRGs with the highest connectivity, referred to as CDE-OSRGs. The visualization of both DE-OSRGs and CDE-OSRGs within the interaction network was conducted using Cytoscape software, as depicted in Figure (a) and (b). Figure (b) specifically displayed the five CDE-OSRGs, namely G6PD, HBB, TP53, KEAP1, and PXDN.
Figure 4. The PPI networks consisted of (a) 19 DE-OSRGs and (b)5 CDE-OSRGs. Each gene is represented by a node, and the connections between nodes represent the interactions between genes. 5de osrg is distinguished by nodes in red or orange, and the intensity of the colour reflects their degree of connectivity.
3.4. Verification and correlation of CDE-OSRGs in MN
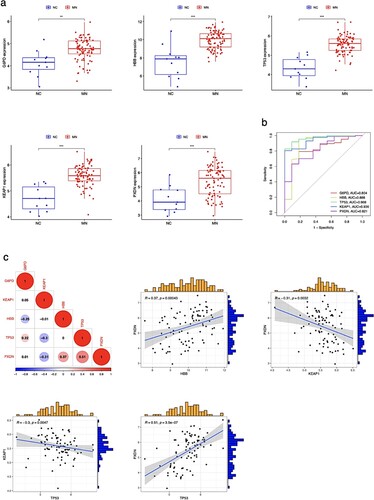
The differential expression of CDE-OSRG was visualized in the MN and NC groups using boxplots (Figure (a)). These five CDE-OSRGs (G6PD, HBB, TP53, KEAP1, and PXDN) showed high expression in the MN group. As Figure (b) illustrates, the areas under the Curve standards of G6PD, HBB, TP53, KEAP1, and PXDN were 0.804, 0.888, 0.968, 0.936, and 0.821, respectively, indicating that CDE-OSRGs have high diagnostic accuracy in distinguishing MN patients. In addition, Figure (c) shows the expression correlation between CDE-OSRGs and each other. Amongst these, the PXDN expression level had a negative correlation with KEAP1 and a positive correlation with HBB. There was a positive correlation and a negative correlation between the expression level of TP53, PXDN and KEAP1.
Figure 5. Verification and correlation of CDE-OSRGs in MN. (a) Box plots of CDE-OSRGs (G6PD, HBB, TP53, KEAP1, and PXDN) expression values between MN and NC groups. (b) ROC curves of the five CDE-OSRGs. AUC, area under curve. (c) Heat map and scatter plots of the expression correlation between CDE-OSRGs.
3.5. Regulatory network of CDE-OSRGs and targeted drugs
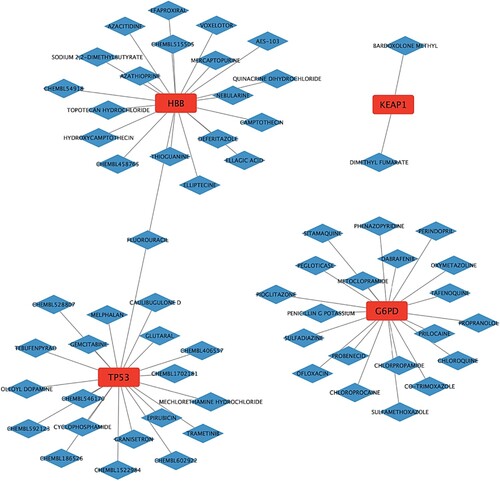
An extensive table comprising CDE-OSRGs and their respective targeted drug interactions was obtained, as outlined in the supplementary file (Drug-gene interactions.xls), utilizing the DGIdb database. A regulatory network that visually depicted the associations between CDE-OSRGs and targeted drugs was constructed through the use of Cytoscape. As illustrated in Figure , the CDE-OSRGs were visually represented by red square nodes, while the molecular drugs targeted for regulation were depicted as blue diamond nodes. The lines connecting these nodes symbolized the interactions between them. This drug regulatory network encompassed a total of four CDE-OSRGs, 61 molecular drugs, and 62 pairs of interacting relationships.
Figure 6. Regulatory network between CDE-OSRGs and targeted drugs. CDE-OSRGs are represented by red nodes, targeted drugs are represented by blue nodes, and the lines between them represent interaction pairs.
3.6. Regulatory network of CDE-OSRGs and miRNAs (TF)
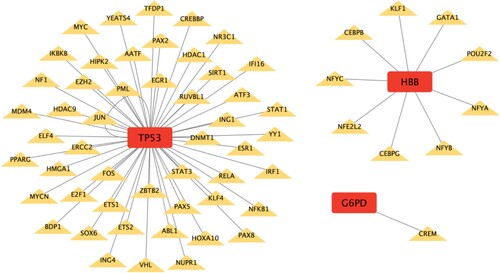
The tables of the interactions between miRNAs (TFs) and CDE-OSRGs, as outlined in the supplementary file (Gene-miRNA interactions.xls and Gene-TF interactions.xls), were obtained by utilizing the miRNet database. The two regulatory networks were constructed through the utilization of Cytoscape, which visually depicted the associations between miRNAs (TFs) and CDE-OSRGs. As illustrated in Figures and , the CDE-OSRGs were visually represented by red square nodes, while the miRNAs (TFs) that bind to the CDE-OSRGs were depicted as green oval nodes (yellow diamond nodes). The lines connecting these nodes symbolized the interactions between them. The Gene-miRNA regulatory network encompassed a total of five CDE-OSRGs, 154 miRNAs, and 220 pairs of interacting relationships and the Gene-TF regulatory network encompassed a total of three CDE-OSRGs, 60 TFs, and 61 pairs of interacting relationships.
Figure 7. Regulatory network between CDE-OSRGs and miRNAs. CDE-OSRGs are represented by red nodes, miRNAs are represented by green nodes, and the lines between them represent interaction pairs.
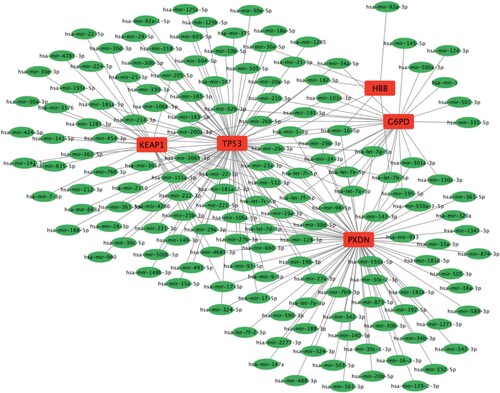
Figure 8. Regulatory network between CDE-OSRGs and TFs. CDE-OSRGs are represented by red nodes, TFs are represented by yellow nodes, and the lines between them represent interaction pairs.
4. Discussion
MN is an autoimmune glomerular disease, the primary clinical signs of which are edoema, hypertension, proteinuria, hematuria, and so forth [Citation29]. MN develops gradually, with a peak onset age of 40–60 years. The exact cause of MN is unknown. Studies have found that MN may have a certain genetic tendency, and the phenomenon of family aggregation is more obvious [Citation30, Citation31]. When biological cells are exposed to different stimuli, the body produces high-level, high-activity substances like nitrogen free radicals as well as reactive oxygen species. This imbalances the body’s oxidation–reduction reaction rate, as well as the body’s antioxidant capacity is exceeded by the oxidation rate of various oxides, which damages human tissues [Citation32]. OS is thought to have a significant role in tumour development and a host of other disorders, in addition to being a significant contributor to ageing and illness [Citation33]. Therefore, this study identified core genes of MN based on OSRGs, explored their key biological functions and molecular pathways, and constructed regulatory networks for drugs, miRNAs, and TFs.
87 MN and 11 NC samples made up the dataset GSE108113, which was initially obtained and aggregated for the current investigation in order to create an expression matrix with 24,889 genes. 862 DEGs identified in differential gene expression analysis intersected with 437 OSRGs collected from the GeneCards database, resulting in 28 DE-OSRGs It is suggested that these DE-OSRGs regulate the occurrence and progression of MN. Secondly, enrichment analyses were performed of GO and KEGG for 28 DE-OSRGs to examine their potential roles. After that, 19 DE-OSRGs (disconnected genes deleted) were added to the network of protein–protein interactions (PPIs) and it was determined G6PD, HBB, TP53, KEAP1, and PXDN had the highest connectedness.
G-6-PD originates from red blood cells and catalyzes glucose-6-phosphate to produce NAD-PH, which is a coenzyme of glutathione reductase. Reduced glutathione (GSH) is a necessary condition for maintaining hemoglobin stability and red blood cell membrane integrity. In individuals with G-6-PD deficiency in red blood cells, the red blood cell membrane loses thiol protection and its function is impaired, ultimately leading to hemolysis. The clinical examination of red blood cell G-6-PD is mainly used to diagnose hemolytic anemia. The HBB gene is one of the most important hemoglobin genes in the human body, encoding HBB, a protein that plays a crucial role in oxygen transport. Defects in the HBB gene can cause changes in the morphology of hemoglobin molecules, causing red blood cells to deform under hypoxia, leading to serious consequences such as vascular blockage, ischemia, and hypoxia. TP53 is a gene on chromosome 17 that encodes a tumour suppressor protein that includes transcriptional activation, DNA binding, and oligomeric domains. This gene encodes a tumour suppressor protein that includes transcriptional activation, DNA binding, and oligomeric domains. Encoding proteins regulate the expression of target genes in various cellular stress responses, thereby inducing cell cycle arrest, apoptosis, aging, DNA repair, or metabolic changes. This genetic mutation is associated with various human cancers, including hereditary cancers such as Li Fraumeni syndrome. The selective splicing of this gene and the use of alternating promoters can lead to multiple transcriptome variations and isomers. Other isomers have also been shown to be due to the use of alternating translation start codons from the same transcript. The protein Keap1 encoded by the Keap1 gene is a key molecule that regulates intracellular redox balance. It regulates the stability and activity of Nrf2 by binding to another protein. Nrf2 is a transcription factor that plays a protective role in cells during oxidative stress. When cells face oxidative stress, Keap1 binds to Nrf2 and degrades it, thereby inhibiting the activity of Nrf2. However, when cells are strongly stimulated by oxidative stress, the binding of Keap1 and Nrf2 decreases, and Nrf2 stabilizes and enters the nucleus, binding to the antioxidant stress response element (ARE), initiating the transcription of a series of antioxidant stress response genes, thereby protecting cells from oxidative stress damage. The PXDN gene belongs to the catalase family and is a gene related to extracellular matrix proteins with peroxidase activity. Many studies have found that the PXDN gene is closely related to the occurrence and development of various malignant tumours. This indicates that there may be a synergistic or other related relationship between the occurrence and development of membranous nephropathy and blood system diseases, oxidative stress reactions, cancer, etc.
Further, ROC curve analysis was done, and the G6PD, HBB, TP53, and KEAP1 AUC values and PXDN were 0.804, 0.888, 0.968, 0.936 and 0.821, respectively, indicating that CDE-OSRGs had high diagnostic accuracy in MN patients. Furthermore, TP53 expression levels were positively connected with PXDN and negatively correlated with KEAP1, whereas PXDN expression levels were favourably correlated with HBB and negatively correlated with KEAP1, according to correlation analysis. Nuclear factor erythroid 2-related factor 2 (Nrf2) signalling was enhanced in genetically modified mice, as studied by Rush et al. [Citation34]. They discovered that Nrf2 inhibitors, Kelch-like ECH-associated protein 1 (KEAP1) enhances glomerular sclerosis, renin destruction and exfoliation, podocyte injury, pedal process regression, and interstitial fibrosis. Pessoa et al. [Citation35] found that Spironolactone, a mineralocorticoid receptor blocker, can improve the nephropathy of spontaneously hypertensive diabetic rats by reestablishing glucose-6-phosphate dehydrogenase (G6PD) activity, and reduce tissue damage caused by OS without affecting blood sugar and blood pressure.
Finally, three regulatory networks were constructed to visually describe the interactions between CDE-OSRGs and targeted drugs, miRNAs, and TFs. Although the pharmacological mechanism of Tripterygium wilfordii (T. wilfordii)’s activity is unknown, it has been frequently utilized to treat idiopathic membranous nephropathy (IMN). Shi et al. [Citation36] used network pharmacology to identify genes that overlapped between IMN target genes and T. wilfordii active chemicals. They also discovered that T. wilfordii may potentially target genes like TP53 through PPI networks for therapeutic purposes.
Nevertheless, this study is subject to certain limitations. Firstly, the absence of clinical or basic experiments to validate the extent of DE-OSRGs expression poses a constraint. Secondly, a comprehensive functional assessment is required in future investigations to elucidate the pathophysiological molecular mechanisms of CDE-OSRGs and ascertain the reliability of these five genes. Additionally, the inclusion of a substantial sample size of MN patients and the collection of more comprehensive clinical follow-up data will contribute to corroborating and refining the findings of this study.
Supplemental Material
Download Zip (14.7 MB)Acknowledgments
The authors thank the data provided by the GEO database.
Authors’ contributions
The study was designed by Lihua Wang. The first draft was written by Lihua Wang. Xinyan Feng gathered unprocessed data. Bioinformatics and statistical analysis were carried out by Xinyan Feng. The work was directed by Lihua Wang.
Disclosure statement
No potential conflict of interest was reported by the author(s).
Data availability
You may request access to the dataset that was used and/or analysed for this work by getting in touch with the relevant author.
References
- Alsharhan L, Beck LH. Membranous nephropathy: core curriculum 2021. Am J Kidney Dis. 2021;77:440–453. doi:10.1053/j.ajkd.2020.10.009
- Fan M, Lan X, Wang Q, et al. Renal function protection and the mechanism of ginsenosides: current progress and future perspectives. Front Pharmacol. 2023;14:1070738. doi:10.3389/fphar.2023.1070738
- Xiao C, Liu Y, Zhang X, et al. Phospholipase-A2 receptor antibody, 24 hours proteinuria, and serum albumin as indicators of cyclophosphamide efficacy in idiopathic membranous nephropathy. J Clin Lab Anal. 2020;34:e23368. doi:10.1002/jcla.23368
- Rovin BH, Adler SG, Barratt J, et al. Executive summary of the KDIGO 2021 guideline for the management of glomerular diseases. Kidney Int. 2021;100:753–779. doi:10.1016/j.kint.2021.05.015
- Piao M, Tu Y, Zhang N, et al. Advances in the application of phytogenic extracts as antioxidants and their potential mechanisms in ruminants. Antioxidants (Basel). 2023: 12.
- Murphy K, Llewellyn K, Wakser S, et al. Mini-GAGR, an intranasally applied polysaccharide, activates the neuronal Nrf2-mediated antioxidant defense system. J Biol Chem. 2018;293:18242–18269. doi:10.1074/jbc.RA117.001245
- Bickers DR, Athar M. Oxidative stress in the pathogenesis of skin disease. J Invest Dermatol. 2006;126:2565–2575. doi:10.1038/sj.jid.5700340
- Chen F, Liu H, Wu J, et al. miR-125a suppresses TrxR1 expression and is involved in H2O2-induced oxidative stress in endothelial cells. J Immunol Res. 2018;2018:6140320.
- Barrett T, Wilhite SE, Ledoux P, et al. NCBI GEO: archive for functional genomics data sets–update. Nucleic Acids Res. 2013;41:D991–D9D5. doi:10.1093/nar/gks1193
- Wang S, Tian J, Wang J, et al. Identification of the biomarkers and pathological process of heterotopic ossification: weighted gene Co-expression network analysis. Front Endocrinol (Lausanne). 2020;11:581768. doi:10.3389/fendo.2020.581768
- Pan Y, Wu L, He S, et al. Identification of hub genes and immune cell infiltration characteristics in chronic rhinosinusitis with nasal polyps: bioinformatics analysis and experimental validation. Front Mol Biosci. 2022;9:843580. doi:10.3389/fmolb.2022.843580
- Yang G, Zeng C, Liu Y, et al. ZNRD1-AS1 knockdown alleviates malignant phenotype of retinoblastoma through miR-128-3p/BMI1 axis. Am J Transl Res. 2021;13:5866–5879.
- Li N, Li D, Du Y, et al. Overexpressed PLAGL2 transcriptionally activates Wnt6 and promotes cancer development in colorectal cancer. Oncol Rep. 2019;41:875–884.
- Zhang B, He M. Identification of potential biomarkers for coronary artery disease based on cuproptosis. Cardiovasc Ther. 2023;2023:5996144.
- Taleban S, Li D, Targan SR, et al. Ocular manifestations in inflammatory bowel disease are associated with other extra-intestinal manifestations, gender, and genes implicated in other immune-related traits. J Crohns Colitis. 2016;10:43–49. doi:10.1093/ecco-jcc/jjv178
- Zhang J, Yan A, Cao W, et al. Development and validation of a VHL-associated immune prognostic signature for clear cell renal cell carcinoma. Cancer Cell Int. 2020;20:584. doi:10.1186/s12935-020-01670-5
- Zhang Y, Jiang W, Xia Q, et al. Construction of a potential microRNA and messenger RNA regulatory network of acute lung injury in mice. Sci Rep. 2022;12:777. doi:10.1038/s41598-022-04800-3
- Wang J, Qin D, Ye L, et al. CCL19 has potential to be a potential prognostic biomarker and a modulator of tumor immune microenvironment (TIME) of breast cancer: a comprehensive analysis based on TCGA database. Aging (Albany NY). 2022;14:4158–4175. doi:10.18632/aging.204081
- Liu S, Wang W, Zhao Y, et al. Identification of potential key genes for pathogenesis and prognosis in prostate cancer by integrated analysis of gene expression profiles and the cancer genome atlas. Front Oncol. 2020;10:809. doi:10.3389/fonc.2020.00809
- Ji X, Ma S, Sun X, et al. Analysis of ferroptosis-associated genes in Crohn’s disease based on bioinformatics. Front Med (Lausanne). 2022;9:1058076. doi:10.3389/fmed.2022.1058076
- Wu N, Liu F, Huang Y, et al. Necroptosis related genes predict prognosis and therapeutic potential in gastric cancer. Biomolecules. 2023: 13.
- Ge X, Liu Z, Weng S, et al. Integrative pharmacogenomics revealed three subtypes with different immune landscapes and specific therapeutic responses in lung adenocarcinoma. Comput Struct Biotechnol J. 2022;20:3449–3460. doi:10.1016/j.csbj.2022.06.064
- Beshnova D, Ye J, Onabolu O, et al. De novo prediction of cancer-associated T cell receptors for noninvasive cancer detection. Sci Transl Med. 2020: 12.
- Zhang J, Ding N, Xin W, et al. Quantitative proteomics reveals that a prognostic signature of the endometrium of the polycystic ovary syndrome women based on ferroptosis proteins. Front Endocrinol (Lausanne). 2022;13:871945. doi:10.3389/fendo.2022.871945
- Hu Z, Liu Y, Yao Z, et al. Stages of preadipocyte differentiation: biomarkers and pathways for extracellular structural remodeling. Hereditas. 2022;159:47. doi:10.1186/s41065-022-00261-w
- Ferreira WAS, Amorim CKN, Burbano RR, et al. Genomic and transcriptomic characterization of the human glioblastoma cell line AHOL1. Braz J Med Biol Res. 2021;54:e9571. doi:10.1590/1414-431x20209571
- Kolur V, Vastrad B, Vastrad C, et al. Identification of candidate biomarkers and therapeutic agents for heart failure by bioinformatics analysis. BMC Cardiovasc Disord. 2021;21:329. doi:10.1186/s12872-021-02146-8
- Just J, Yan Y, Farup J, et al. Blood flow-restricted resistance exercise alters the surface profile, miRNA cargo and functional impact of circulating extracellular vesicles. Sci Rep. 2020;10:5835. doi:10.1038/s41598-020-62456-3
- Gao J, Wei L, Song J, et al. In vitro and in vivo study of the expression of the Syk/Ras/c-Fos pathway in chronic glomerulonephritis. Mol Med Rep. 2018;18:3683–3690.
- Mei H, Li L, Liu S, et al. The uniform-score gene set analysis for identifying common pathways associated with different diabetes traits. BMC Genomics. 2015;16:336. doi:10.1186/s12864-015-1515-3
- Freedman BI, Hicks PJ, Bostrom MA, et al. Non-muscle myosin heavy chain 9 gene MYH9 associations in African Americans with clinically diagnosed type 2 diabetes mellitus-associated ESRD. Nephrol Dial Transplant. 2009;24:3366–3371. doi:10.1093/ndt/gfp316
- Li X, Wang X, Liu G, et al. Antioxidant stress and anticancer activity of peptide-chelated selenium in vitro. Int J Mol Med. 2021: 48.
- Leung C-H, Zhang J-T, Yang G-J, et al. Emerging screening approaches in the development of Nrf2-Keap1 protein-protein interaction inhibitors. Int J Mol Sci. 2019: 20.
- Rush BM, Bondi CD, Stocker SD, et al. Genetic or pharmacologic Nrf2 activation increases proteinuria in chronic kidney disease in mice. Kidney Int. 2021;99:102–116. doi:10.1016/j.kint.2020.07.036
- Pessôa BS, Peixoto EBMI, Papadimitriou A, et al. Spironolactone improves nephropathy by enhancing glucose-6-phosphate dehydrogenase activity and reducing oxidative stress in diabetic hypertensive rat. J Renin Angiotensin Aldosterone Syst. 2012;13:56–66. doi:10.1177/1470320311422581
- Shi H, Hou Y, Su X, et al. Mechanism of action of Tripterygium wilfordii for treatment of idiopathic membranous nephropathy based on network pharmacology. Ren Fail. 2022;44:116–125. doi:10.1080/0886022X.2021.2024850