
Abstract
It is well known that precipitation anomalies in the tropical western North Pacific (WNP) significantly affect circulation and rainfall in East Asia during summer. In this study, the authors further investigated this relationship, by examining the anomalies associated with positive and negative precipitation anomalies in the tropical WNP. The results suggest these anomalies are asymmetric between the enhanced and suppressed WNP rainfall. Positive precipitation anomalies over the WNP, in comparison with their negative counterparts, are more closely related to the meridional teleconnection pattern and rainfall anomalies along the East Asian rain belt. The implications of the results are discussed.
摘要
热带西北太平洋夏季降水异常能显著影响东亚夏季降水和环流异常,但前人对两者关系的研究大多建立在线性的基础上。通过对西北太平洋夏季降水异常强年和异常弱年的合成分析,本文研究发现,两种情况下东亚-西北太平洋异常的相互关系存在强的不对称性,即,西北太平洋夏季降水异常强年,东亚降水及环流异常比较显著;而在西北太平洋降水异常弱年,这些热带外异常则相对较弱。
1. Introduction
In summer, there is a meridional teleconnection in the circulation variability over East Asia and the western North Pacific (WNP) on the interannual timescale (e.g. Lau, Kim, and Yang Citation2000; Lu Citation2004; Kosaka and Nakamura Citation2006; Zhao et al. Citation2015). This teleconnection pattern is manifested both by the zonal displacement of the WNP subtropical high (WNPSH) in the lower troposphere and by the meridional displacement of the East Asian westerly jet (EAJ) in the upper troposphere in the middle latitudes. The zonal displacement of the WNPSH is the leading mode of lower-tropospheric horizontal wind variability (Wang, Wu, and Lau Citation2001; Lu Citation2001a), and the meridional displacement of the EAJ is the leading mode of upper-tropospheric zonal wind variability (Lin and Lu Citation2005).
The zonal displacement of the WNPSH is associated with anticyclonic/cyclonic anomalies over the WNP, and the southwesterly/northeasterly anomalies in the lower troposphere affect moisture transport into East Asia. Therefore, the WNPSH zonal displacement can significantly affect precipitation in East Asia. On the other hand, the anticyclonic/cyclonic anomalies over the WNP is also associated with negative/positive precipitation anomalies over the tropical WNP, which can be mainly explained by the Gill-type response of circulation to tropical heating (Lu Citation2001a). Therefore, the zonal displacement of the WNPSH plays a crucial role in forming the seesaw pattern of precipitation anomalies between the tropical WNP and East Asia, which has been well documented.
On the other hand, the meridional displacement of the EAJ, in comparison with the WNPSH zonal displacement, is also closely related to precipitation anomalies over East Asia (Lu Citation2004). A northward (southward) displacement of the EAJ corresponds well to negative (positive) precipitation anomalies over the East Asian rain belt. It also corresponds to positive (negative) precipitation anomalies in the tropical WNP.
Most previous results were obtained via linear approaches (correlation or regression) or composite differences, assuming that the relationship between circulation and precipitation anomalies is basically linear. However, in this study, we reveal an asymmetry in the relationship between the precipitation anomalies in the tropical WNP, or the meridional displacement of the WNPSH, and the circulation and rainfall anomalies in East Asia, particularly the meridional displacement of the EAJ and rainfall anomalies along the East Asian rain belt. This asymmetry is a new feature of tropical–extratropical interaction over the WNP and East Asia, implying a complexity in this interaction. An appreciation of this asymmetry will be helpful for a better understanding of East Asian rainfall variability, and thus improving its forecasting.
2. Methods
The data used in this study include winds from the NCEP–NCAR reanalysis and precipitation from the GPCP. We adopted the GPCP data-set because it is more reasonable for the open ocean (Yin, Gruber, and Arkin Citation2004). All analyses were performed for the period 1979–2014, and all the results shown in this paper are for summer (June–August).
To facilitate the investigation on the relationship between tropical and extratropical anomalies, the tropical WNP rainfall index (WNPRI) was defined by the precipitation anomalies averaged over the region (10–20°N, 110–160°E), following Lu (Citation2001b). As mentioned in the introduction, rainfall anomalies in the tropical WNP are closely related to the zonal displacement of the WNPSH, or lower-tropospheric anticyclonic/cyclonic anomalies over the WNP. For instance, this WNPRI is highly correlated with the WNP monsoon index defined by Wang, Wu, and Lau (Citation2001) as the difference of the 850-hPa zonal wind anomalies between (5–15°N, 100–130°E) and (20–30°N, 110–140°E), with the correlation coefficient being 0.87 during 1979–2014.
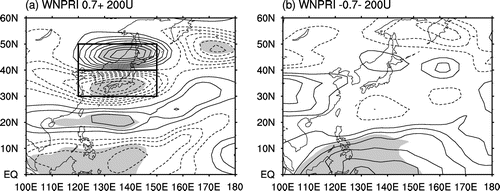
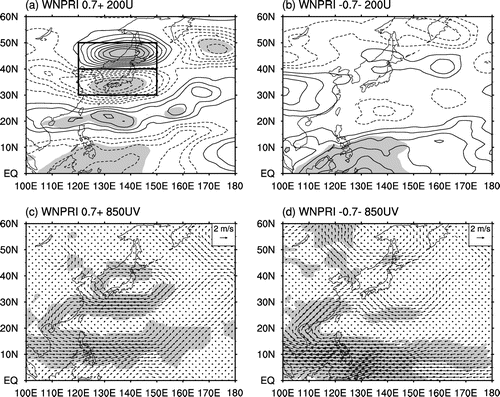
Figure shows the 200-hPa zonal wind anomalies for the positive and negative WNPRI cases. These cases were selected according to whether the index was above (or below) 0.7 (−0.7) standard deviations. This criterion yielded 10 positive cases (1981, 1984, 1985, 1990, 1997, 2001, 2002, 2004, 2011, and 2012), and 9 negative cases (1980, 1983, 1987, 1988, 1995, 1996, 1998, 2008, and 2010). These cases are to be compared with all other cases, i.e. cases with an index between −0.7 and 0.7 standard deviations, which are used as reference. Therefore, composite anomalies for positive cases represent the differences between positive cases and reference cases.
Figure 1. Composite 200-hPa zonal wind anomalies for (a) positive and (b) negative WNPRI cases.
3. Results
Positive WNPRI cases correspond well to the meridional teleconnection of zonal wind anomalies at 200 hPa (Figure (a)). In particular, there are significant westerly anomalies over Northeast Asia and easterly anomalies to the south of the westerly anomalies. The regions for these westerly and easterly anomalies are located to the north and south of the axis of the climatological westerly jet, and are consistent with the regions used to define the EAJ index (EAJI) in Lu (Citation2004). To measure the EAJ meridional displacement quantitatively, Lu (Citation2004) defined the EAJI as the difference between the 200-hPa zonal winds averaged over (40–50°N, 120–150°E) and (30–40°N, 120–150°E). In this study, we also use this EAJI. A positive (negative) EAJI indicates a northward (southward) displacement of the EAJ. The result shown in Figure (a) indicates that a positive WNPRI corresponds to a northward displacement of the EAJ. The EAJI averaged over the positive cases is 3.37 m s−1. This correspondence between the WNPRI and EAJI is in agreement with previous studies (Lau, Kim, and Yang Citation2000; Lu Citation2004), which do not distinguish positive and negative cases. Actually, the correlation coefficient between the WNPRI and EAJI is 0.45 during the entire analysis period (1979–2014), statistically significant at the 99% confidence level.
However, the composite result for negative WNPRI cases is quite different (Figure (b)). The significant anomalies are concentrated in the tropics and subtropics. There are positive and negative anomalies roughly to the north and south of the climatological jet axis, respectively. However, these anomalies are very weak and not statistically significant, and tend to shift clearly eastwards in comparison with their counterparts for the positive cases. The EAJI averaged over the negative cases is −0.08 m s−1, much weaker than that for the positive cases (3.37 m s−1).
Figure shows the precipitation anomalies for the positive and negative WNPRI cases, respectively. There are negative anomalies along the East Asian rain belt, being significant and strongest in the WNP to the south of Japan, for the positive cases (Figure (a)). The negative anomalies also appear in the central eastern China, but they are weak. For the negative cases, there are positive anomalies along the East Asian rain belt, but they are northward-shifted and basically weaker in comparison with the positive cases. This difference in composite rainfall anomalies in East Asia can also be illustrated by the values of the East Asian rainfall index (EARI) defined by Lu and Fu (Citation2010). They defined this index as the precipitation anomalies averaged over the parallelogram region determined by the vertexes (25°N, 100°E), (35°N, 100°E), (30°N, 160°E), and (40°N, 160°E), which is used to mimic the East Asian rain belt that is basically zonally oriented but has a slight southwest–northeast tilt. The composite EARI is −0.47 mm d−1 for the positive cases, stronger than that for the negative cases (0.30). The EARI is closely correlated to both the WNPRI and EAJI during 1979–2014, with the correlation coefficient being −0.61 for WNPRI and −0.75 for EAJI, both significant at the 0.01 level, confirming the meridional teleconnection.
Figure 2. Composite precipitation anomalies for (a) positive and (b) negative WNPRI cases.
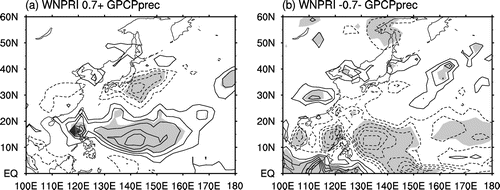
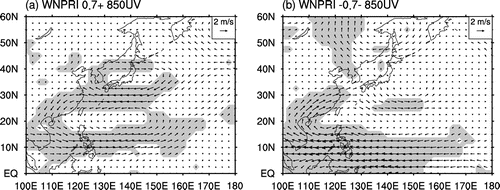
Figure shows the 850-hPa horizontal wind anomalies for the positive and negative cases. The clearest wind anomalies are the anomalous cyclone/anticyclone in the subtropical WNP for the positive/negative cases, which is consistent with previous studies. On the other hand, there is a significant and well-organized anticyclonic anomaly in midlatitude East Asia for the positive cases, while the cyclonic anomaly is weak and only marginally significant for the negative cases. The anticyclonic anomaly in midlatitude East Asia is consistent with the northward displacement of the EAJ shown in Figure (a), which is associated with an anticyclonic anomaly in the upper troposphere (figure not shown).
Figure 3. Composite 850-hPa horizontal wind anomalies for (a) positive and (b) negative WNPRI cases.
The asymmetry shown here may be sensitive to the reanalysis datasets used, since the results are based on only half of the entire sample size. Therefore, we repeated the above analysis using two other reanalysis datasets: ERA-Interim (Dee et al. Citation2011) and JRA-55 (Kobayashi et al. Citation2015). Figures and show the 200-hPa and 850-hPa horizontal wind anomalies for the positive and negative WNPRI cases, based on ERA-Interim and JRA-55, respectively. Both figures show very similar results to Figures and . That is, a positive WNPRI corresponds to a northward displacement of the EAJ and a well-organized anticyclonic anomaly in midlatitude East Asia. However, for the negative WNPRI, the extratropical circulation anomalies are much weaker or not well organized. Therefore, the results based on these two reanalysis datasets confirm the conclusions obtained using the NCEP–NCAR reanalysis.
Figure 4. Composite 200-hPa zonal wind anomalies (a and b) and 850-hPa horizontal wind anomalies (c and d) for positive (a and c) and negative (b and d) WNPRI cases, based on ERA-Interim data.
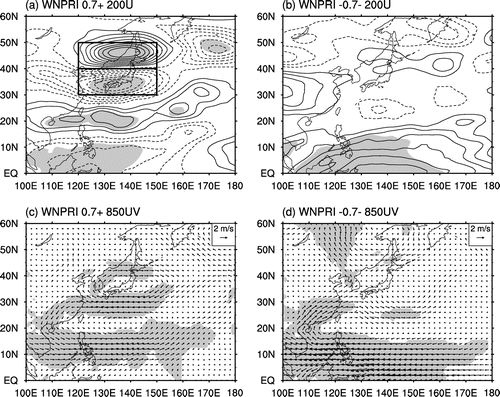
Figure 5. Composite 200-hPa zonal wind anomalies (a and b) and 850-hPa horizontal wind anomalies (c and d) for positive (a and c) and negative (b and d) WNPRI cases, based on the JRA reanalysis data.
4. Conclusions and discussion
This study examined the atmospheric circulation and precipitation anomalies in East Asia associated with enhanced and suppressed rainfall in the tropical WNP. The results indicate an asymmetric tropical–extratropical relationship over the WNP and East Asia, i.e. enhanced WNP rainfall corresponds to stronger extratropical circulation and rainfall anomalies, while suppressed WNP rainfall corresponds to weaker extratropical anomalies. Specifically, positive precipitation anomalies in the tropical WNP are closely associated with the northward displacement of the EAJ and suppressed rainfall in the subtropical WNP, while negative precipitation anomalies in the tropical WNP are not.
Whilst the mechanisms underpinning this asymmetry remain unclear, the present results provide some hints for their further investigation. First, we should consider the feedback to the circulation of the rainfall anomalies along the East Asian rain belt. Lu and Lin (Citation2009) indicated that precipitation anomalies along the East Asian rain belt, affected by atmospheric circulations, can in turn induce the circulation anomalies that tend to strengthen the meridional teleconnection of circulation over the WNP and East Asia. Thus, the stronger negative subtropical rainfall anomalies for the positive WNPRI cases (Figure (a)), in comparison with the positive anomalies for the negative cases (Figure (b)), may help establish a stronger meridional teleconnection of circulation. Second, the intensity of rainfall anomalies in the tropical WNP does not show an evident difference between the positive and negative cases (Figure ); the composite WNPRI is 1.43 for the positive cases and −1.51 for the negative cases, implying that it may not be possible to use the intensity of rainfall anomalies in the tropical WNP to explain the asymmetry of extratropical anomalies. These hypotheses need to be further investigated, but are beyond the scope of this short paper.
Song and Li (Citation2014) identified that the relationship of convection in the tropical WNP with rainfall and circulation in East Asia manifests an evident difference between Indian Ocean warm and cold summers. Since they focused on the relationship at the daily timescale, it would not be appropriate to compare their results with ours, which focused on the interannual timescale. However, examining the differences in daily or subseasonal variability between positive and negative rainfall summers would be an interesting line of study in future work.
The present results suggest that reliably predicting summer rainfall anomalies in East Asia is more challenging than expected. Lu and Lu (Citation2015) suggested that positive precipitation anomalies over the tropical WNP during summer are associated with far more complicated configurations of the tropical SST anomalies than previously thought. Thus, it is possible that negative rainfall anomalies along the East Asian rain belt may be related to SST forcings of a complex nature. In addition, although suppressed rainfall in the tropical WNP is related to simple SST anomalies, i.e. El Niño decay and a warmer Indian Ocean (Lu and Lu Citation2015), it corresponds to weak rainfall anomalies along the East Asian rain belt, as shown in the present study.
Current models cannot reliably predict summer rainfall anomalies in East Asia, although they can successfully predict rainfall anomalies in the tropical WNP and lower-tropospheric anticyclonic/cyclonic anomalies in the subtropical WNP (Lee et al. Citation2011; Li, Lu, and Dong Citation2012, Citation2014; Kosaka et al. Citation2013), and can also, to a certain extent, predict the meridional displacement of the EAJ (Li and Lin Citation2015). Therefore, it is of great importance to better understand the relationship of rainfall in East Asia with rainfall in the tropical WNP and large-scale circulations over East Asia and the WNP, in order to produce reliable forecasts of summer rainfall in East Asia.
Funding
This work was supported by the National Natural Science Foundation of China [grant number 41320104007].
Disclosure statement
No potential conflict of interest was reported by the authors.
Acknowledgments
We thank the two anonymous reviewers for their comments and suggestions.
References
- Dee, D. P., S. M. Uppala, A. J. Simmons, P. Berrisford, P. Poli, S. Kobayashi, U. Andrae, et al. 2011. “The ERA-Interim Reanalysis: Configuration and Performance of the Data Assimilation System.” Quarterly Journal of the Royal Meteorological Society 137: 553–597.10.1002/qj.v137.656
- Kobayashi, S., Y. Ota, Y. Harada, A. Ebita, M. Moriya, H. Onoda, K. Onogi, et al. 2015. “The JRA-55 Reanalysis: General Specifications and Basic Characteristics.” Journal of the Meteorological Society of Japan. Ser. II 93: 5–48.10.2151/jmsj.2015-001
- Kosaka, Y., and H. Nakamura. 2006. “Structure and Dynamics of the Summertime Pacific-Japan Teleconnection Pattern.” Quarterly Journal of the Royal Meteorological Society 132: 2009–2030.10.1256/qj.05.204
- Kosaka, Y., S.-P. Xie, N.-C. Lau, and G. A. Vecchi. 2013. “Origin of Seasonal Predictability for Summer Climate over the Northwestern Pacific.” Proceedings of the National Academy of Sciences 110: 7574–7579.10.1073/pnas.1215582110
- Lau, K., K. Kim, and S. Yang. 2000. “Dynamical and Boundary Forcing Characteristics of Regional Components of the Asian Summer Monsoon.” Journal of Climate 13: 2461–2482.10.1175/1520-0442(2000)013<2461:DABFCO>2.0.CO;2
- Lee, S.-S., J.-Y. Lee, K.-J. Ha, B. Wang, and J. Schemm. 2011. “Deficiencies and Possibilities for Long-Lead Coupled Climate Prediction of the Western North Pacific-East Asian Summer Monsoon.” Climate Dynamics 36: 1173–1188.10.1007/s00382-010-0832-0
- Li, C., and Z. Lin. 2015. “Predictability of the Summer East Asian Upper-Tropospheric Westerly Jet in ENSEMBLES Multi-Model Forecasts.” Advances in Atmospheric Sciences 32: 1669–1682.10.1007/s00376-015-5057-z
- Li, C., R. Lu, and B. Dong. 2012. “Predictability of the Western North Pacific Summer Climate Demonstrated by the Coupled Models of ENSEMBLES.” Climate Dynamics 39: 329–346.10.1007/s00382-011-1274-z
- Li, C., R. Lu, and B. Dong. 2014. “Predictability of the Western North Pacific Summer Climate Associated with Different ENSO Phases by ENSEMBLES Multi-Model Seasonal Forecasts.” Climate Dynamics 43: 1829–1845.10.1007/s00382-013-2010-7
- Lin, Z., and R. Lu. 2005. “Interannual Meridional Displacement of the East Asian Upper-Tropospheric Jet Stream in Summer.” Advances in Atmospheric Sciences 22: 199–211.
- Lu, R. 2001a. “Interannual Variability of the Summertime North Pacific Subtropical High and Its Relation to Atmospheric Convection over the Warm Pool.” Journal of the Meteorological Society of Japan 79: 771–783.10.2151/jmsj.79.771
- Lu, R. 2001b. “Atmospheric Circulations and Sea Surface Temperatures Related to the Convection over the Western Pacific Warm Pool on the Interannual Scale.” Advances in Atmospheric Sciences 18: 270–282.
- Lu, R. 2004. “Associations among the Components of the East Asian Summer Monsoon System in the Meridional Direction.” Journal of the Meteorological Society of Japan 82: 155–165.10.2151/jmsj.82.155
- Lu, R., and Y. Fu. 2010. “Intensification of East Asian Summer Rainfall Interannual Variability in the Twenty-First Century Simulated by 12 CMIP3 Coupled Models.” Journal of Climate 23: 3316–3331.10.1175/2009JCLI3130.1
- Lu, R., and Z. Lin. 2009. “Role of Subtropical Precipitation Anomalies in Maintaining the Summertime Meridional Teleconnection over the Western North Pacific and East Asia.” Journal of Climate 22: 2058–2072.10.1175/2008JCLI2444.1
- Lu, R., and S. Lu. 2015. “Asymmetric Relationship between Indian Ocean SST and the Western North Pacific Summer Monsoon.” Journal of Climate 28: 1383–1395.10.1175/JCLI-D-14-00289.1
- Song, J., and C. Li. 2014. “Contrasting Relationship between Tropical Western North Pacific Convection and Rainfall over East Asia during Indian Ocean Warm and Cold Summers.” Journal of Climate 27: 2562–2576.10.1175/JCLI-D-13-00207.1
- Wang, B., R. Wu, and K.-M. Lau. 2001. “Interannual Variability of the Asian Summer Monsoon: Contrasts between the Indian and the Western North Pacific-East Asian Monsoons.” Journal of Climate 14: 4073–4090.10.1175/1520-0442(2001)014<4073:IVOTAS>2.0.CO;2
- Yin, X., A. Gruber, and P. Arkin. 2004. “Comparison of the GPCP and CMAP Merged Gauge-Satellite Monthly Precipitation Products for the Period 1979–2001.” Journal of Hydrometeorology 5: 1207–1222.10.1175/JHM-392.1
- Zhao, G., G. Huang, R. Wu, W. Tao, H. Gong, X. Qu, and K. Hu. 2015. “A New Upper-Level Circulation Index for the East Asian Summer Monsoon Variability.” Journal of Climate 28: 9977–9996.10.1175/JCLI-D-15-0272.1