
Abstract
Based on Droplet Measurement Technologies data of a pre-stratiform-cloud precipitation event in Ganzhou, Jiangxi Province, on 11 November 2015, and combined with radar data, this paper comprehensively analyzes the macro- and microphysical characteristics of cloud in the upper trough. The results show that: (1) Detection takes place in the early stage of precipitation and the cloud has multiple layers. The cloud type is stratiform (Sc) and the height of the cloud base is 1009 m, 1009–1700 m is the low Sc layer, 1700–3000 m is the no-cloud level, and 3000 to the maximum height detected is another Sc layer. (2) The Sc is inhomogeneous in the horizontal and vertical directions. The particle number concentration and the effective diameter below the 0 °C layer is significantly higher than that above the 0 °C layer, which is in accordance with the ‘seeder–feeder’ mechanism. Above the 0 °C layer is seeder cloud, where needle, column ice crystals and water droplets coexist, and sublimation and coalescence are the main processes. The morphology of ice crystals changes from needle to column, plate, and polymer as height decreases. Below the 0 °C warm layer is a supply cloud, and the particles develop in the supply cloud with abundant liquid water content. Ice melting and coalescence dominate the warm layer, which makes the effective diameter significantly increase. Down to 4150 m, the ice melts completely into raindrops.
摘要
本文利用2015年11月11日江西省赣州市一次降水前期层状云的DMT资料,结合雷达数据,综合分析了在高空槽影响下云系的宏微观结构特征。结果表明: (1)探测属于降水前期,云系呈多层分布。(2) 层状云系在水平和垂直方向存在不均匀性, 0°C层上下满足播种云-供应云机制。0°C层以上为播种云,凝华,粘连增长占主要过程。 0°C层以下的暖层为供应云,粒子在液态水含量丰富的供应云体中长大,冰晶的融化聚并过程使得有效直径显著增大。下降到4150m的高度,冰晶完全融化变为雨滴。
1. Introduction
The horizontal distribution and vertical structure of clouds are important factors in weather, climate and weather modification. The distribution, structure, and evolution of clouds are inseparably related to radiation budgets and water circulation. Through absorbing and radiating longwave radiation and through reflecting and scattering shortwave radiation, clouds adjust the energy budget of the earth–atmosphere system. Through precipitation processes, clouds adjust the temperature and humidity of the atmosphere (Zhou and Ou Citation2010).
Many experiments and observations have shown that clouds can affect the thermodynamic processes of the atmosphere (Lei et al. Citation2008). Stratiform cloud (Sc), typically with a horizontal scale of 101–103 km, vertical scale of 10−1–100 km, and water content of 10−1 g m−3, has been widely and deeply investigated (Huang and Xu Citation1999). Detection of the microphysical structure of Sc using Particle Measuring System (PMS)/Droplet Measurement Technologies (DMT) is an important method to explore the precipitation mechanism of Sc (Zhang et al. Citation2010).
Field investigations of cloud started from the 1970s. Hobbs (Citation1975a, Citation1975b; Hobbs and Radke Citation1975) carried out investigations of winter cloud and precipitation in the Cascade Mountains and evaluated their modification by artificial seeding. They measured the concentrations of liquid water, ice crystals, snowfall, and freezing nuclei. The first Australian Winter Storms Experiment (Long and Huggins Citation1992) used a dual-wavelength microwave radiometer, omegasondes, and a large number of tipping-bucket gauges. With these data, it was possible to calculate and compare two of the terms in a condensed-phase water budget over a cloud-seeding target area in the Great Diving Range. Automatic observation of cloud in China started in the 1980s when PMSs were introduced. Since 2004, the Meteorological Bureau and Institute of Atmospheric Physics, Chinese Academy of Sciences, have introduced DMT’s new cloud condensation nuclear, aerosol, and cloud particle detection system. Since the 1980s, PMS/DMT probes have been gradually used in several northern areas of the country to carry out aircraft-based cloud-physics detection tests.
You and Wang (Citation1989) measured snowfall cloud structure and the growth of snow particles in Ulumqi, Xinjiang Province, and showed that the precipitation mechanism of Sc in North China basically reflect the ‘seeder–feeder’ model, and sublimation and coalescence were the main processes for snow-particle growth. Wang et al. (Citation2007) used PMS data in Yanan District and divided stratiform clouds into five vertical layers according to their particle size distribution. Chen and Ma (Citation1986) found that spring Sc precipitation was mainly caused by altostratus opacus. Hu et al. (Citation2007) explained the Zhen-Chao GU three-layer conceptual model of a large-scale precipitation event in Northeast China. When clouds are mature, there is a ‘seeder–feeder’ mechanism between the layers.
From the above field-based observational studies of cloud, results show that the structures of clouds are closely related to weather systems and terrain conditions. Previous studies of Sc have mainly been conducted in the northern region of China, with research on the macro- and microphysical characteristics of Sc, via airborne particle measurements, being relatively rare in the southern part of the country.
This paper uses airborne DMT data gathered over Ganzhou City, Jiangxi Province, combined with radar data, to analyze the synoptic background of Sc precipitation in this region, as well as the vertical distribution of microphysical parameters, the two-dimensional particle images of cloud droplets and ice crystals, and the growth of ice crystals and other particles. The aim is to enhance understanding of Sc in the southern region of China.
2. Instrumentation
The airborne particle measurement system used in this paper was developed by DMT in the early part of this century. The detection system consists of a central control system and all external probes. The plug-in probes include: a precipitation imaging probe (PIP); a cloud imaging probe (CIP); a cloud and aerosol spectrometer (CAS); a CCN counter; and an air data probe (Aircraft-Integrated Meteorological Measurement System; AIMMS-20; Aventech Research Inc., Ontario, Canada). The instrument is carried onboard the Y-12 aircraft of the Weather Modification Office in Tongliao. The performance parameters of each probe are given in Table .
Table 1. Instruments and parameters.
3. Weather profiles
Figure (a) shows a Sc radar echo in the north and northwest, and the intensity of the echo around Ganzhou is 10–20 dBZ. At 10:46 LT (Figure (b)), a radar echo band of Sc appears in the west of Ganxian, where cloud is gathering. The intensity and range of the cloud strengthens gradually and shows a banded structure. At 11:31 LT (Figure (c)), the radar echo is clustered into one piece, with an average radar echo intensity of about 35 dBZ. The radar echo is patchy and the edge of the echo is blurred, which is consistent with the characteristics of Sc. However, the Sc is embedded in strong convective echoes of about 40 dBZ. The characteristics of Sc can be seen. When the aircraft detection is about to end, at 11:42 LT (Figure (d)), the cloud area is still expanding. The radar echo intensity around Ganzhou is 25–35 dBZ. The cloud becomes a larger sheet echo from northeast to southwest. The average radar echo intensity reaches a maximum value of the above four moments. Obviously, the detection is taking place during the formation stage of the cloud.
Figure 1. Radar PPI Plan-position indicator at Ganzhou on 11 November 2015: (a) 09:33 LT; (b) 10:46 LT; (c) 11:31 LT; (d) 11:42 LT. (e) Radar range–height indicator at 10:57 LT 11 November 2015 in Ganzhou.
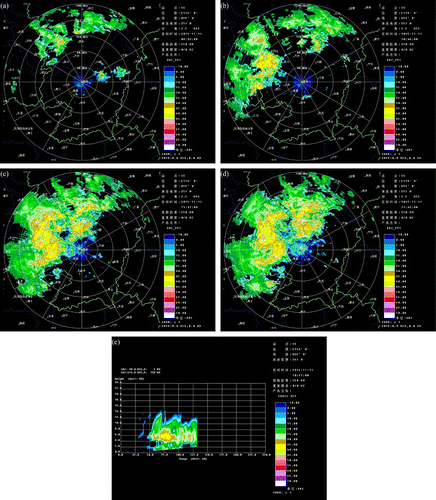
Figure (e) is the radar range–height indicator at 10:57 LT 11 November 2015 at Ganzhou. The area around 75 km is Sichuan, and the cloud top height is about 12–14 km. We can see some convective echoes embedded in the Sc. The strongest radar echo intensity can reach 40–45 dBZ and the altitude is at about 4–5 km, which is the 0 °C height. We can also see the cloud has a two-layer structure; the height of 2–3 km is the no-cloud level.
4. Macrophysical cloud structure
The macrophysical cloud structure can be obtained via the flight log and instrument detection results. The cloud type is Sc and the height of the cloud base is 1009 m. Above that, 1009–1700 m is a low layer of Sc, with a thickness of 691 m; 1700–3000 m is a no-cloud level, with a thickness of 1300 m; 3000 m to the maximum height detected is another Sc layer, where the 0 °C height is 4.4 km; and 1000–1500 m is the height of the inversion layer.
5. Aircraft route
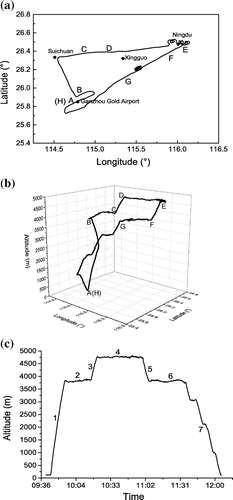
On 11 November 2015, an aircraft equipped with DMT instrumentation took off from Ganzhou Gold Airport, passed over Suichuan, Ningdu, and then returned. The aircraft departed from the airport at 09:39 LT, climbed to a height of 3800 m, flew flat, climbed to 4800 m, and flew flat again. The aircraft then descended back to 3800 m, and then landed at 12:04 LT. A ‘spiral rise/fall’ method was adopted over Ningdu, and on the way back to Ganzhou (Figure (c)). The flight detection area was located at the edge of the radar echo map, which was in the early stage of precipitation.
Figure 2. (a) Two-dimensional aircraft flight path. (b) Three-dimensional aircraft flight path. (c) Height changes over time (11 November 2015). The letters and numbers represent the process of different sectors.
6. Microphysical cloud structure
6.1. Vertical distribution characteristics
Figure (a)–(c) depict the vertical distribution of particle number concentration and liquid water content, between 3800 and 4800 m, in the leg3 updraft section. The distance covered is about 20 km, and the height of the 0 °C level is about 4400 m. The number concentration and liquid water content vary greatly in the vertical direction. There is a big difference in the distribution of number concentration and liquid water content above and below the 0 °C level. Specifically, the number concentration and effective diameter below the 0 °C level are much higher than above it, proving the observed cloud system is consistent with previous research on the ‘seeder–feeder’ precipitation mechanism (Rutledge and Hobbs Citation1983). Seeder clouds lie above the 0 °C level; needle-like and column-shaped ice crystals that have dropped from higher levels (Figure (a)) coexist with supercooled water droplets (feeder clouds). From the CIP two-dimensional image, we can see sublimation and cohesion are the dominant processes, and the ice crystal particles grow actively in this layer. The maximum value of liquid water content observed by CIP at 4460 and 4779 m, reaches 1.3 and 0.92 g m−3, respectively. At 4460 m, the number concentration and liquid water content detected by three probe types is quite high: the concentration detected by CAS is 139 cm−3; the concentration detected by CIP reaches a maximum of 2.87 cm−3; and the concentration detected by PIP also reaches a maximum (39 L−1). However, at 4779 m, only the concentration detected by CAS reaches a maximum, at up to 165 cm−3, and the concentrations detected by PIP and CIP are rather low. There is also a ‘seeder–feeder’ mechanism between the large sized droplets melted from ice particles and the droplets formed in the warm cloud layer. The large sized droplets melted from ice particles are seeder clouds. When these large sized droplets fall below the 0 °C band to feeder clouds, the maximum CIP and PIP can detect is 1.96 and 3.28 g m−3, respectively, due to the rich liquid water supply. The melted ice particles develop in the feeder clouds, leading to a significant increase in the concentration of large particles. Rich-water layers occur at heights of around 4050 and 4300 m. In the warm layer, melting and coalescence of ice crystals are the dominant processes, leading to a remarkable increase in effective diameter. The diameter reaches a maximum at both 4050 and 4250 m, corresponding to the height of the melting layer between 0 and 3 °C. According to the two-dimensional images of the cloud and precipitation particles (Figure (a)), the process of ice crystals melting and merging with cloud droplets can be clearly seen.
Figure 3. (a–c) Particle concentration and liquid water content change with height for (a) CAS, (b) CIP, and (c) PIP. (d) CAS spectral distribution at different heights in ascending section. (e) CIP–PIP spectral distribution at different heights in ascending section; the diameter range is 100–6300 μm. (f–h) Ratio of the number of particles of different scales to the total concentration at different heights for (f) CAS, (g) CIP, and (h) PIP.
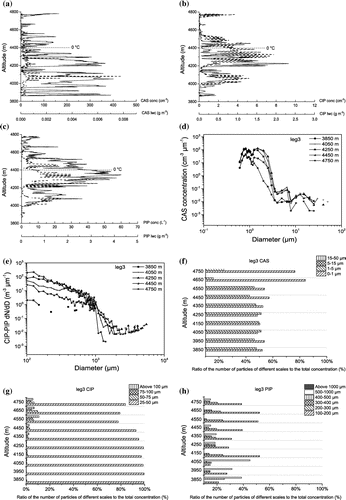
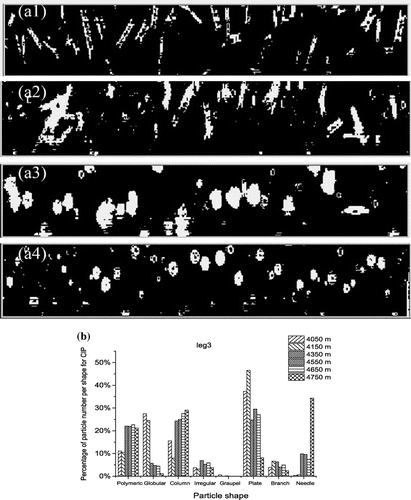
Figure 4. (a) Leg3 CIP two-dimensional particle images at different heights in ascending section: (a1)10:22:15 LT, 4750 m, −1.5 °C; (a2)10:19:59 LT, 4350 m, 1.2 °C; (a3) 10:19:16 LT, 4250 m, 1.5 °C; (a4) 10:18:44 LT, 4150 m, 2.02 °C. (b) Percentage of particle numbers per shape in ascending section (leg3) for CIP.
Analyzing the droplet spectra at different heights in the ascending stage (Figure (d)), we can see droplets smaller than 3.5 μm are high in concentration, with three peaks; whereas, droplets larger than that are low in concentration. The spectrum distribution below the 0 °C level is quite different from that above it; in the warm layer, below the 0 °C level, the spectrum is relatively narrow, with three aerosol-scale peaks at 0.82, 0.96, and 1.5 μm. The magnitude of number concentration is 102 cm−3 μm−1. The broadest part of those spectra is located at 4050 m, in the rich-water layer, and the peak value of number concentration is 127.33 cm−3 μm−1. The above analysis illustrates the inhomogeneous vertical distribution within Sc. Above the 0 °C level, the concentrations at 4450 and 4750 m are rather low, and one order of magnitude smaller than that below the 0 °C level. In this layer, the spectrum is broad, with rich liquid water, which makes ice-phase particles grow rapidly. According to the CIP–PIP combined large droplet spectrum (Figure (e)), spectrum broadening is clearly apparent at 4250 and 4050 m below the 0 °C level, which can be explained by two factors: not yet melted ice crystals aggregating with cloud droplets, and rain droplet coalescence growth. At 3850 m, the spectrum becomes narrower, and the concentration of small droplets detected by CAS is very high at this level, which can be explained by the layered structure of the cloud.
Figure (f) shows that the particles detected by CAS are mainly aerosols and cloud droplets smaller than 5 μm in diameter. In the warm layer, below the 0 °C level, droplets of 0–1 and 1–5 μm account for half of the total number concentration. However, in the cold layer, above the 0 °C level, the number of small-scale droplets of 1–5 μm increases, accounting for 84% and 76% of the total number concentration at 4650 and 4750 m, respectively. Figure (g) shows that the droplets detected by CIP are mainly distributed between 25 and 100 μm in diameter, and droplets larger than 50 μm, or even 100 μm, begin to appear above the 0 °C level. Figure (h) shows that the largest droplets detected by PIP, of 500–1000 μm, are below 4050 m. The number of large droplets decreases with height, and droplets smaller than 200 μm account for more than half of the total number.
Analyzing Figure , the two-dimensional images of CIP particles, it can be seen that the shape of ice crystals is largely influenced by the environment in which these particles develop. The needle-like, column-shaped ice crystals dominate ice crystals of other shapes at 4750 m (the temperature at this height is −1.5 °C), accounting for 34.4% and 29%, respectively. At 4650 m (the temperature at this height is −1.42 °C), the dominant ice crystal shapes are column-shaped and plate-like, accounting for 27.6% and 27%, respectively. At 4550 m (−1.2 °C), plate-like ice crystals account for 29.5%; and at 4450 m (−0.8 °C), columnar and polymeric ice crystals account for 26.6% and 23.9%, respectively. Above the 0 °C level, from high levels to low levels, the shape of ice crystals converts from needle to columnar, plate, and polymeric, successively. In the melting layer at 4350 m (the temperature at this height is 1.2 °C), ice crystals are mainly columnar- and plate-shaped, and the melting of ice crystals is the main process. Spherical rain drops dominate the layer below 4150 m (the temperature at this height is 2.02 °C).
6.2. Precipitation mechanism
The cloud of this process has a multilayer structure, and can be categorized as pre-precipitation Sc. The physical process of the precipitation can be described as follows: The upper layer of the cloud is a seeder cloud, from where needle-like, column-shaped ice crystals fall into the supercooled water droplet layer, which is rich in liquid water. According to the Bergeron hypothesis, at the same temperature, the saturated vapor pressure of ice crystals is lower than the saturated vapor pressure of the water surface. The ice crystals continue to capture the water vapor of the water droplets, and thus water droplets continuously evaporate. In addition, coalescence between ice crystals, as well as riming, also exist. The mixing layer above the 0 °C layer, and the warm layer below the 0 °C layer, also satisfy the ‘seeder–feeder’ mechanism. The phase transition is from solid to liquid, and the ice particles melt gradually as the height decreases. The number of particles falling above the 0 °C layer increases because of the rich supply of water, and the concentration of large particles increases significantly. The process of melting and coalescence of ice crystals is dominant, which makes the effective diameter increase significantly. Down to 4150 m, ice crystals completely melt into raindrops.
7. Conclusions
Based on DMT data combined with radar, this paper comprehensively analyzes the macro- and microphysical characteristics of cloud and precipitation in the upper trough at Ganzhou, Jiangxi Province, on 11 November 2015. The results can be summarized as follows:
| (1) | Detection takes place in the early stage of precipitation and the cloud has a multilayered structure. The cloud type is Sc, which is inhomogeneous in the horizontal and vertical direction. The height of the cloud base is 1009 m; 1009–1700 m is a low layer of Sc; 1700–3000 m is the no-cloud level; 3000 m to the maximum height detected is another Sc layer, where the 0 °C height is 4.4 km; and 1000–1500 m is the height of the inversion layer. | ||||
| (2) | During the ascent and descent of the aircraft, the liquid water content shows the same trend of change as the effective diameter, while the effective diameter is negatively correlated with the particle concentration. The particle number concentration and effective diameter below the 0 °C layer is significantly higher than that above the 0 °C layer, which is in accordance with the ‘seeder–feeder’ mechanism. The particle number concentration and effective diameter below the 0 °C layer is significantly higher than that above the 0 °C layer, which is also in accordance with the ‘seeder–feeder’ mechanism. Above the 0 °C layer is seeder cloud, where needle, column ice crystals, and supercooled water droplets coexist, and sublimation and coalescence account for the main physical processes. Below the 0 °C warm layer is a supply cloud, and the particles develop in the supply cloud with abundant liquid water content. Ice melting and coalescence dominate the warm layer, which makes the effective diameter increase significantly. Down to 4150 m, the ice melts completely into raindrops. Consistent results can be obtained from the cloud and precipitation two-dimensional particle images. At 4750 m, above the 0 °C level, the ice crystals are needle-like and column-shaped. The morphology of ice crystals changes from needle to column, plate, and polymer as the height decreases. The melting and coalescence of ice crystals can be clearly seen in the melting layer below the 0 °C level. | ||||
Disclosure statement
No potential conflict of interest was reported by the authors.
Funding
This work is supported by the National Natural Science Foundation of China [grant number 41530427], [grant number 41590871].
References
- Chen, W. K., and P. M. Ma. 1986. “Sichuan Spring Stratiform Cloud Microphysical Characteristics and Precipitation Mechanisms.” [in Chinese] Journal of Applied Meteorological Science 01: 53–58.
- Hobbs, P. V. 1975a. “The Nature of Winter Clouds and Precipitation in the Cascade Mountains and Their Modification by Artificial Seeding. Part I: Natural Conditions.” Journal of Applied Meteorology 14 (5): 783–804. doi:10.1175/1520-0450(1975)014<0783:TNOWCA>2.0.CO;2.
- Hobbs, P. V. 1975b. “The Nature of Winter Clouds and Precipitation in the Cascade Mountains and Their Modification by Artificial Seeding. Part III: Case Studies of the Effects of Seeding.” Journal of Applied Meteorology 14 (5): 819–858. doi:10.1175/1520-0450(1975)014<0819:TNOWCA>2.0.CO;2.
- Hobbs, P. V., and L. F. Radke. 1975. “The Nature of Winter Clouds and Precipitation in the Cascade Mountains and Their Modification by Artificial Seeding. Part II: Techniques for the Physical Evaluation of Seeding.” Journal of Applied Meteorology 14 (5): 805–818. doi:10.1175/1520-0450(1975)014<0805:TNOWCA>2.0.CO;2.
- Hu, Z. X., H. C. Lei, X. L. Guo, D. Z. Jin, Y. B. Qi, and X. Q. Zhang. 2007. “Studies of the Structure of a Stratiform Cloud and the Physical Processes of Precipitation Formation.” [in Chinese] Chinese Journal of Atmospheric Sciences 31 (3): 425–439.
- Huang, M. Y., and H. Y. Xu. 1999. Cloud and Precipitation Physics. [in Chinese] Beijing: Science Press.
- Lei, H. C., Y. C. Hong, Z. Zhao, H. Xiao, and X. L. Guo. 2008. “Advances in Cloud and Precipitation Physics and Weather Modification in Recent Years.” [in Chinese] Chinese Journal of Atmospheric Sciences 32 (4): 967–974.
- Long, A. B., and A. W. Huggins. 1992. “Australian Winter Storms Experiment (AWSE) I: Supercooled Liquid Water and Precipitation-Enhancement Opportunities.” Journal of Applied Meteorology 31 (9): 1041–1055. doi:10.1175/1520-0450(1992)031<1041:AWSEIS>2.0.CO;2.
- Rutledge, Steven A., and Peterv Hobbs. 1983. “The Mesoscale and Microscale Structure and Organization of Clouds and Precipitation in Midlatitude Cyclones. VIII: A Model for the ‘Seeder-Feeder’ Process in Warm-Frontal Rainbands.” Journal of the Atmospheric Sciences 40 (5): 1185–1206. doi:10.1175/1520-0469(1983)040<1185:TMAMSA>2.0.CO;2.
- Wang, Y. F., H. C. Lei, P. Fan, Y. X. Wu, and Z. Y. Lu. 2007. “Analyses on Microphysical Characteristic and Precipitation Mechanism on Stratiform Cloud in Yan’an.” [in Chinese] Plateau Meteorology 26 (2): 388–395.
- You, L. G., and D. F. Wang. 1989. “The Microphysical Structure of Snow Cloud and the Growth Process of Snow in Winter in Xinjiang.” [in Chinese] Acta Meteorologica Sinica 47 (1): 73–81.
- Zhang, D. G., M. Y. Fan, D. L. Gong, and H. S. Zhang. 2010. “An Analysis of Microphysical Characteristics on Precipitation Cumulus-stratus Mixed Clouds System.” [in Chinese] Transactions of Atmospheric Sciences 33 (4): 496–503.
- Zhou, Y. Q., and J. J. Ou. 2010. “The Method of Cloud Vertical Structure Analysis Using Rawinsonde Observation and Its Applied Research.” [in Chinese] Meteorological Monthly 11: 50–58.