
ABSTRACT
The authors explore the intraseasonal oscillation (ISO) of rainfall anomalies in South China, the related circulation regimes, and discuss the possible causes of the large variability of the positive rainfall anomalies over South China during the winter of the 1982/83, 1997/98 and 2015/16 super El Niño events. Case-by-case analysis shows that the 10–20-day ISO associated with the successive heavy rainfall events lead to the positive anomalies of winter rainfall in the three winters. Meanwhile, the 20–50-day ISO is relatively stronger in the winter of 1982/83 and 2015/16 but weaker in the winter of 1997/98. Except for a different speed, the anomalies of the 200-hPa wave train associated with the two ISOs both propagate eastward along the westerly jet between 20 N and 30 N. In the winter of 1982/83 and 2015/16, when the upper-level subseasonal wave trains in different periods pass through South China, the in-phase enhancement of upper-level divergences and the pumping effect could induce the persistent heavy rainfall events, which facilitate the stronger seasonal-mean rainfall. Although the 10–20-day ISO alone in the winter of 1997/98 could cause the higher-frequency rainfall events, the weaker 20–50-day ISO attenuates the anomalies of the South China winter rainfall. Therefore, the joint effects of the 10–20- and 20–50-day ISOs are critical for the larger amount of above-normal rainfall over South China during the mature phase of super El Niño events.
Graphical Abstract
摘要
本文主要从季节内振荡的角度出发,采用周期分析、合成分析等方法,针对1982/83、1997/98和2015/16年超强El Niño冬季华南降水异常偏多的可能原因进行探讨。结果表明,沿中纬度西风急流东移的10–20天和20–50天低频波列的共同作用是导致1982/83年和2015/16年超强El Niño冬季华南降水增多的关键因素。由于1997/98年冬季缺少20–50天低频波列活动的参与,仅在10–20天低频大气振荡的影响下,华南冬季平均降水异常少于1982/83和2015/16年。
1. Introduction
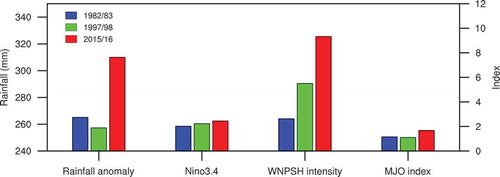
The winter rainfall over South China usually becomes greater-than-normal during the mature phase of El Niño (from November to the succeeding February). The enhanced winter rainfall over South China was particularly notable during the 1982/83, 1997/98 and 2015/16 super El Niño events. The anomaly of seasonal-accumulated winter rainfall in South China is 278, 132, and 107 mm in super El Niño years, normal El Niño years, and neutral years, respectively. However, the rainfall amount is not exactly proportional to the intensity of super El Niño events. Although the strongest rainfall anomaly appeared in the winter of 2015/16 with the maximum Niño3.4 index, the weakest positive anomaly of the South China rainfall occurred in the winter of 1997/98, when the Niño3.4 index was comparable to that in 1982/83 (). In the seasonal-mean field, the El Niño-enhanced western North Pacific subtropical high (WNPSH), with low-level southwesterly flow and warm moisture flux, is critical for the South China rainfall anomaly (e.g. Zhang, Sumi, and Kimoto Citation1996; Wang, Wu, and Fu Citation2000; Zhang and Sumi Citation2002). However, the winter WNPSH index (defined as by the National Climate Center (Mu et al. Citation2001)) also does not correspond to the intensity of super El Niño events (). Therefore, the nonlinear relationship between the rainfall amount, the WNPSH strength and the El Niño intensity could increase the uncertainty in the seasonal prediction of the abnormal South China winter rainfall. Since the noise of seasonal prediction could transform into the subseasonal signal, we need to further investigate the intraseasonal variation of South China winter rainfall in these years for understanding the above paradox. The Madden–Julian oscillation (MJO) (Madden and Julian Citation1971, Citation1972, Citation1994; Zhang Citation2005), as an important factor of the South China winter rainfall anomaly (e.g. Barlow et al. Citation2005; Jeong et al. Citation2008; He, Lin, and Wu, Citation2011), shows no explicit correspondence to the El Niño intensity in boreal winter (), suggesting a complexity of the intraseasonal variation of South China winter rainfall.
Figure 1. Seasonal-accumulated above-normal rainfall anomaly averaged in South China, along with the Niño3.4, western north Pacific subtropical high (WNPSH) and MJO intensity indices during boreal winter (November to the succeeding February) of the 1982/83, 1997/98, and 2015/16 El Niño events.
In the present study, we analyze the atmospheric ISOs and reveal their impacts on the South China rainfall anomaly during the winter season. Since previous studies have paid attention to the subseasonal variation of the WNPSH in the lower layer (Zhang et al. Citation2015), we focus on the ISOs in the upper-level atmosphere (Yang, Wang, and Qing Citation2010; Miao, Wen, and Zhang Citation2017) to explain why the positive anomalies of South China winter rainfall show distinct fluctuation during the three super El Niño events. The datasets include daily NOAA SST data (Reynolds et al. Citation2007), MJO index (Wheeler and Hendon Citation2004), and the daily in-situ observed rainfall in South China (20.15°–31°N, 105°–123°E) of 506 stations (provided by the National Meteorological Information Center, China Meteorological Administration) and the NCEP-DOE Reanalysis with a horizontal resolution of 2.5°× 2.5° (Kanamitsu et al. Citation2002). Here, the ISOs are defined as the 5–120-day components of the daily anomaly obtained by the popular method (Myers and Waliser Citation2003; Mao and Chen Citation2005; Lee et al. Citation2013).
2. Isos of the South China winter rainfall
The intraseasonal anomalies of South China winter rainfall are spatially coherent in each boreal winter, which is verified by the first leading empirical orthogonal function (EOF1) mode (figure not shown) for each case. The first principle component (PC1) is significantly correlated to the ISO of area-averaged South China rainfall anomaly in each winter. Thus, we can treat the PC1 as the ISO index of the South China winter rainfall.
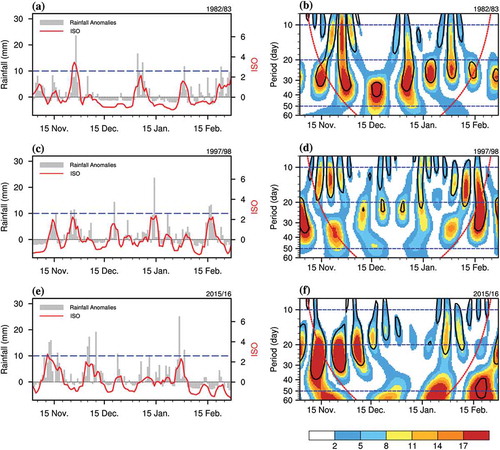
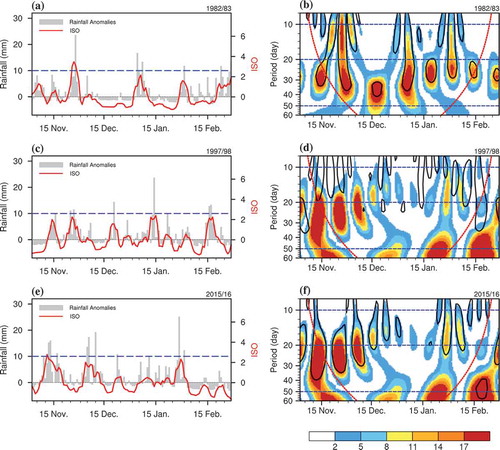
The above-normal rainfall in South China is mainly contributed by the cluster of heavy rainfall events, which successively appear in the positive phase of the ISO index (. The number of rainfall clusters (i.e. the wet phase of ISO) varies from five to eight in the three winters. The frequency of rainfall clusters is highest during the winter of 1997/98, but relatively lower in the cases of 1982/83 and 2015/16. However, the stronger positive anomaly of seasonal-accumulated rainfall does not take place in the winter of 1997/98 as expected ( and ); instead, it appears in the other two years with the relatively lower-frequency rainfall clusters. Therefore, the rainfall amount is not directly proportional to the frequency of rainfall clusters in boreal winter of the super El Niño events. Wavelet analysis (Torrence and Compo Citation1998) suggests that the periods of the South China rainfall ISO are distinct among the three winters (). The 10–20- and 20–50-day ISOs are robust during the winter of 1982/83 and 2015/16, while the latter becomes weaker in the winter of 1997/98. Thus, even though the above-normal rainfall events mostly take place in the wet phase of 10–20-day ISO, the extreme rainfall events (>10 mm d−1) occur when the 20–50-day ISO becomes pronounced, such as the cases of 1982/83 and 2015/16.
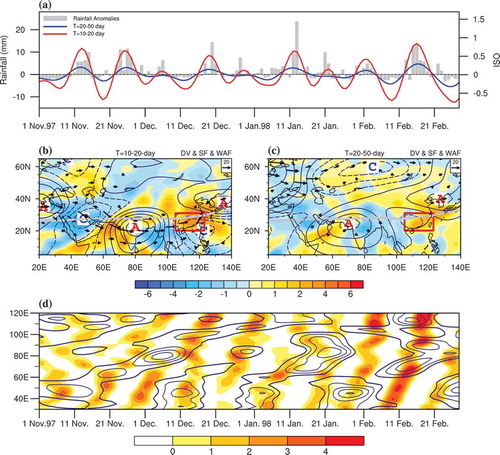
Figure 2. Time series of the daily rainfall anomalies over South China (histogram; units: mm d−1) and their corresponding ISOs (red dotted curve; units: mm d−1) during the (a) 1982/83, (c) 1997/98 and (e) 2015/16 El Niño events, respectively. Panels (b, d, f) show the wavelet power spectrum of ISOs during the 1982/83, 1997/98 and 2015/16 El Niño events, respectively. ‘DOG’ (derivative of Gaussian) is used as the mother wavelet, where the shading in the black lines indicates the values exceeding the 95% confidence level for a red-noise process, and the red dashed line denotes the cone of influence.
3. Case-by-case comparison
Generally, the two ISOs with different periods alternately emerge in the successive rainfall events during the three winters, and thus we can divide the ISOs into the 10–20- and 20–50-day components by Lanczos band-pass filtering.
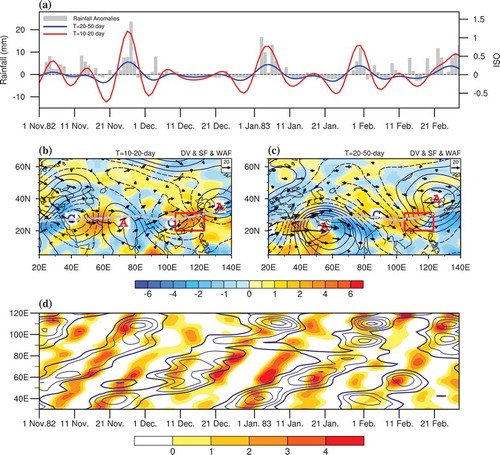
In the case of 1982/83, the heavy rainfall events mostly occur when the wet phases of the two ISOs arrive in South China together, such as in the late November of 1982, as well as the early January and February of 1983 ()). In particular, during the wet phase of the 10–20-day ISO, the wave activity flux (Takaya and Nakamura Citation2001) exhibits a ‘V’ curve pattern, indicating an eastward propagating wave train along with a series of zonally oriented anomalies of 200hPa stream function and divergence ()). Four centers of anomalous circulation are located between 20°N and 30°N, where the upper-level subtropical westerly jet prevails in boreal winter (Schiemann, Lüthi, and Schär Citation2008). The wave train propagates southeastward to the west but northeastward to the east of the Tibetan Plateau, respectively. Thus, South China is beneath an upper-level divergence anomaly between the abnormal cyclonic and anticyclonic circulation in the northeastward branch of the wave train. According to the conservation of mass theorem, the divergence anomaly in the upper troposphere could enhance the ascending motion and the low-level convergence to induce the rainfall events in South China. In the wet phase of the 20–50-day ISO, a northeastward propagating wave train is observed at 200 hPa to the east of the Tibetan Plateau, along with a southeastward propagating one to the west ()). They are possibly related to the cold wave activity around Lake Baikal during boreal winter (Yang and Li Citation2016). Furthermore, three centers of anomalous circulation embedded in the 20–50-day wave trains are close to the activity nodes in the 10–20-day ISO ()). Thus, the in-phase superimposition of the 10–20- and 20–50-day ISO could enhance the upper-level pumping effect over South China and facilitate the local persistent heavy rainfall events in the winter of 1982/83. When the two eastward propagating wave trains repeatedly pass through South China, successive rainfall events take place in-situ during the boreal winter of 1982/83 (). Compared with the 20–50-day wave train, the 10–20-day one travels at double the speed with a varied amplitude ()). Also, the extreme heavy rainfall clusters occur when these two wave trains arrive in South China together, especially for the first three heavy rainfall cluster events.
Figure 3. Time series of the daily rainfall anomalies over South China (histogram; units: mm d−1), the 10–20-day (blue curve) and 20–50-day (red curve) filtered PC1 in 1982/83. Phase 7 of the (b) 10–20-day and (c) 20–50-day low-frequency streamfunction (contours; units: 106 m2 s−1; solid and dashed lines represent the positive and negative values, respectively), divergence (shading; units: 10−5 m s−2) and wave activity flux (vectors; units: m2 s−2) at 200 hPa in winter 1982/83. Here, according to the ISO rainfall indices (a), each active–inactive cycle is divided into eight phases. Phase 1 represented a transition from an active to inactive period, while phase 5 is a transition from an inactive to active phase period. Phases 3 and 7 are the peaks of the inactive and active period, respectively. Phases 2, 4, 6, and 8 occur at the time when the oscillation reaches half its maximum or minimum value. The red rectangle shows the South China region defined in this study. (d) Time–longitude cross section of the 10–20-day low-frequency divergence (shading; units: 10−5 m s−2) and the 20–50-day low-frequency divergence (contours; units 10−5 m s−2) at 200 hPa averaged between 20°N and 30°N in 1982/83.
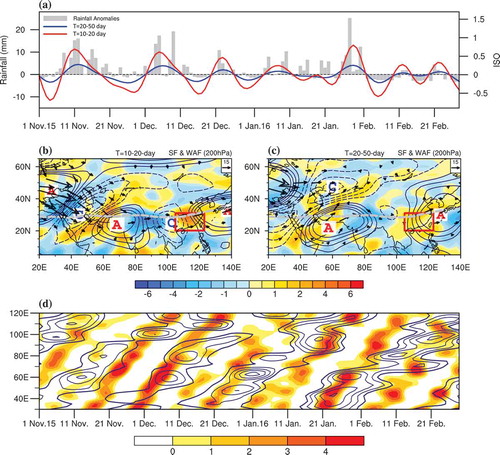
In the case of 1997/98, the effects of the 10–20-day ISO on the heavy rainfall clusters become more prominent, whereas the influences of the 20–50-day ISO are reduced in contrast to the case of 1982/83 ()). The anomalous circulation in the wet phase of the 10–20-day ISO embeds in a 200 hPa wave train, whose negative node with evident divergence drifts off the westerly jet and moves onto the South China Sea ()). In the meantime, the 20–50-day ISO is much weaker in this winter than its counterpart in 1982/83 (), presenting a loose structure of the eastward propagating wave train to the south of 40°N at 200 hPa ()). Instead, an eastward propagating wave train emerges in the higher latitudes between 40° and 60°N. The absence of phase-locking between the 10–20- and 20–50-day wave train may weaken the anomalies of resonance divergence over South China and further attenuate the local heavy rainfall clusters. ) shows that the heavy rainfall clusters in the winter of 1997/98 almost occur beneath the anomalies of upper-level divergence in the eastward propagating 10–20-day ISO, rather than the 20–50-day ISO as in 1982/83 ()). Therefore, the above-normal anomaly of seasonal-accumulated rainfall becomes less in South China during the winter of 1997/98 due to the weaker influence of 20–50-day ISO.
Figure 4. Time series of the daily rainfall anomalies over South China (histogram; units: mm d−1), the 10–20-day (blue curve) and 20–50-day (red curve) filtered PC1 in 1997/98. Phase 7 of the (b) 10–20-day and (c) 20–50-day low-frequency streamfunction (contours; units: 106 m2 s−1; solid and dashed lines represent the positive and negative values, respectively), divergence (shading; units: 10−5 m s−2) and wave activity flux (vectors; units: m2 s−2) at 200 hPa in winter 1997/98. Here, according to the ISO rainfall indices (a), each active–inactive cycle is divided into eight phases. Phase 1 represented a transition from an active to inactive period, while phase 5 is a transition from an inactive to active phase period. Phases 3 and 7 are the peaks of the inactive and active period, respectively. Phases 2, 4, 6, and 8 occur at the time when the oscillation reaches half its maximum or minimum value. The red rectangle shows the South China region defined in this study. (d) Time–longitude cross section of the 10–20-day low-frequency divergence (shading; units: 10−5 m s−2) and the 20–50-day low-frequency divergence (contours; units 10−5 m s−2) at 200 hPa averaged between 20°N and 30°N in 1997/98.
During the winter of 2015/16, we can see that the maximum positive anomaly of seasonal-accumulated South China rainfall constitutes five heavy rainfall events ( and )). Generally, they take place from November 2015 to late January 2016, when both 10–20- and 20–50-day ISOs are significant ()), suggesting the joint effect of two ISOs ()). The upper-level wave trains associated with the 10–20-day ISO in 2015/16 resemble those in 1982/83 but have stronger active centers ( and ). The upper-level divergence and its resultant pumping effect over South China are sandwiched by the centers of the anomalous cyclone and anticyclone in the wave train during the wet phase of the ISO ()). In the 20–50-day ISO, except for a weak cyclonic anomaly over the east periphery of the Tibetan Plateau, the anomalous circulation surrounding South China is similar as the situation in 1982/83 (El Niño). In addition, there are seven and five cycles of the 10–20- and 20–50-day ISO events in the winter of 2015/16, respectively ()), and the top three extreme heavy rainfall clusters occur when the wet phase of the two ISOs simultaneously reach South China (). This is indicative of their collaboration to the more above-normal rainfall in this winter.
Figure 5. Time series of the daily rainfall anomalies over South China (histogram; units: mm d−1), the 10–20-day (blue curve) and 20–50-day (red curve) filtered PC1 in 2015/16. Phase 7 of the (b) 10–20-day and (c) 20–50-day low-frequency streamfunction (contours; units: 106 m2 s−1; solid and dashed lines represent the positive and negative values, respectively), divergence (shading; units: 10−5 m s−2) and wave activity flux (vectors; units: m2 s−2) at 200 hPa in winter 2015/16. Here, according to the ISO rainfall indices (a), each active–inactive cycle is divided into eight phases. Phase 1 represented a transition from an active to inactive period, while phase 5 is a transition from an inactive to active phase period. Phases 3 and 7 are the peaks of the inactive and active period, respectively. Phases 2, 4, 6, and 8 occur at the time when the oscillation reaches half its maximum or minimum value. The red rectangle shows the South China region defined in this study. (d) Time–longitude cross section of the 10–20-day low-frequency divergence (shading; units: 10−5 m s−2) and the 20–50-day low-frequency divergence (contours; units 10−5 m s−2) at 200 hPa averaged between 20°N and 30°N in 2015/16.
4. Summary and discussion
In the present study we analyze the influences of ISO on the winter rainfall anomaly in South China during the 1982/83, 1997/98 and 2015/16 super El Niño events. Our results suggest that the intraseasonal variation of the South China winter rainfall is spatially coherent, but the periods and features of its associated atmospheric ISO are distinct during the three winters. In 1982/83 and 2015/16, when the seasonal-accumulated winter rainfall was much above-normal in South China, there were stronger 10–20- and 20–50-day ISOs. In the upper troposphere, the two ISOs are characterized by eastward propagating wave trains along the subtropical westerly jet, with pronounced abnormal divergence and convergence at 200-hPa between 20°N and 30°N. When the wave trains with different speed concurrently pass through South China, the in-phase superimposition of the anomalous upper-level divergences enhances the ascending motion, thereby resulting in the heavy rainfall clusters. The positive seasonal-accumulated rainfall in South China is contributed by successive heavy rainfall events, which embed in the wet phases of the 10–20- and 20–50-day ISOs. However, the 20–50-day ISO becomes relative weaker in the winter of 1997/98. Although the effect of 10–20-day ISO alone could cause the higher-frequency rainfall events, the weaker 20–50-day ISO prevents the persistent extreme rainfall clusters and weakens the positive anomaly of the accumulated winter rainfall in South China. As a result, the joint effects of the 10–20- and 20–50-day ISOs are critical for the larger amount of above-normal rainfall over South China during the mature phase of the super El Niño events of 1982/83 and 2015/16.
The weaker 20–50-day ISO during winter of 1997/98 may be attributable to the adverse configuration between the position of the wave source and the horizontal structure of basic flow. In the winter of 1982/83 and 2015/16, the 20–50-day ISO located to the south of 40°N embeds in the abnormal zonal wind, which facilitates the eastward and northeastward propagation of the ISO into South China () and )). Whereas, the 20–50-day ISO in the winter of 1997/98 comes into the Asian continent between 40°N and 60°N (), where the meridional gradient of the abnormal zonal wind may prevent its southward intrusion. Meanwhile, the waveguide anomaly in the mid–high latitudes benefits the eastward propagation of the 20–50-day ISO to the north of 40°N. However, the details about this question require further investigation.
The wave train of the 10–20-day ISO is possibly an intrinsic mode with an eastward energy dispersion, and coincides with the subtropical jet over the southern Eurasian continent (Blackmon, Lee, and Wallance, Citation1984; Kushnir and Wallace Citation1989; Hsu Citation1996). This wave train is also detected in boreal spring (Pan, Miao, and Wu, Citation2012). Although the 20–50-day ISO resembles the MJO periodicity (Yao, Lin, and Wu Citation2015), here it is more correlated with the intraseasonal variation of the East Asian trough. However, what caused the 20–50-day ISO of the East Asian trough during the winter of 1982/83 and 2015/16 is still an open question.
Disclosure statement
No potential conflict of interest was reported by the authors.
Additional information
Funding
References
- Barlow, M., M. Wheeler, B. Lyon, and H. Cullen. 2005. “Modulation of Daily Precipitation over Southwest Asia by the Madden-Julian Oscillation.” Monthly Weather Review 133 (133): 3579–3594. doi:10.1175/MWR3026.1.
- Blackmon, M. L., Y. H. Lee, and J. M. Wallace. 1984. “Horizontal Structure of 500-Mb Height Fluctuations with Long, Intermediate, and Short Time Scales.” Journal of the Atmospheric Sciences 41 (6): 961–979. doi:10.1175/1520-0469(1984)041<0961:HSOMHF>2.0.CO;2.
- He, J. H., H. Lin, and Z. W. Wu. 2011. “Another Look at Influences of the Madden-Julian Oscillation on the Wintertime East Asian Weather.” Journal of Geophysical Research: Atmospheres 116: D03109. doi:10.1029/2010JD014787.
- Hsu, H. H. 1996. “Global View of the Intraseasonal Oscillation during Northern Winter.” Journal of Climate 9 (10): 2386–2406. doi:10.1175/1520-0442(1996)009<2386:GVOTIO>2.0.CO;2.
- Jeong, J. H., B. M. Kim, C. H. Ho, and Y. Noh. 2008. “Systematic Variation in Wintertime Precipitation in East Asia by MJO-induced Extratropical Vertical Motion.” Journal of Climate 21 (21): 788–801. doi:10.1175/2007jcli1801.1.
- Kanamitsu, M., W. Ebisuzaki, J. Woollen, S. K. Yang, J. Hnilo, M. Fiorino, and G. Potter. 2002. “NCEP–DOE AMIP-II Reanalysis (R-2).” Bulletin of the American Meteorological Society 83 (11): 1631–1643. doi:10.1175/BAMS-83-11-1631.
- Kushnir, Y., and J. M. Wallace. 1989. “Low-Frequency Variability in the Northern Hemisphere Winter-Geographical-Distribution, Structure and Time-Scale Dependence.” Journal of the Atmospheric Sciences 46 (20): 3122–3142. doi:10.1175/1520-0469(1989)046<3122:LFVITN>2.0.CO;2.
- Lee, J. Y., B. Wang, M. C. Wheeler, X. H. Fu, D. E. Waliser, and I. S. Kang. 2013. “Real-Time Multivariate Indices for the Boreal Summer Intraseasonal Oscillation over the Asian Summer Monsoon Region.” Climate Dynamics 40 (1–2): 493–509. doi:10.1007/s00382-009-0658-9.
- Madden, R. A., and P. R. Julian. 1971. “Detection of a 40–50 Day Oscillation in the Zonal Wind in the Tropical Pacific.” Journal of the Atmospheric Sciences 28 (5): 702–708. doi:10.1175/1520-0469(1971)028<0702:DOADOI>2.0.CO;2.
- Madden, R. A., and P. R. Julian. 1972. “Description of Global-Scale Circulation Cells in the Tropics with a 40–50 Day Period.” Journal of the Atmospheric Sciences 29 (6): 1109–1123. doi:10.1175/1520-0469(1972)029<1109:DOGSCC>2.0.CO;2.
- Madden, R. A., and P. R. Julian. 1994. “Observations of the 40–50 Day Tropical oscillation—A Review.” Monthly Weather Review 122 (5): 814–837. doi:10.1175/1520-0493(1994)122<0814:OOTDTO>2.0.CO;2.
- Mao, J. Y., and J. C. L. Chan. 2005. “Intraseasonal Variability of the South China Sea Summer Monsoon.” Journal of Climate 18 (13): 2388–2402. doi:10.1175/JCLI3395.1.
- Miao, R., M. Wen, and R. H. Zhang. 2017. “Persistent Precipitation Anomalies and Quasi-Biweekly Oscillation during the Annually First Rainy Season over South China in 2010.” Journal of Tropical Meteorology 33 (2): 155–166. in Chinese. doi:10.16032/j.issn.1004-4965.2017.02.002.
- Mu, Q. Z., S. W. Wang, J. H. Zhu, and D. Y. Gong. 2001. “Variations of the Western Pacific Subtropical High in Summer during the Last Hundred Years.”.” Chinese Journal of Atmospheric Sciences 25 (6): 787–797. in Chinese.
- Myers, D. S., and E. E. Waliser. 2003. “Three-Dimensional Water Vapor and Cloud Variations Associated with the Madden-Julian Oscillation during Northern Hemisphere Winter.” Journal of Climate 16 (6): 929–950. doi:10.1175/1520-0442(2003)016<0929:TDWVAC>2.0.CO;2.
- Pan, W. J., J. Y. Mao, and G. X. Wu. 2012. “Characteristics and Mechanism of the 10–20-Day Oscillation of Spring Rainfall over Southern China.” Journal of Climate 26 (14): 5072–5087. doi:10.1175/JCLI-D-12-00618.1.
- Reynolds, R. W., T. M. Smith, C. Liu, D. B. Chelton, K. S. Casey, and M. G. Schlax. 2007. “Daily High-Resolution-Blended Analyses for Sea Surface Temperature.” Journal of Climate 20 (22): 5473–5496. doi:10.1175/2007JCLI1824.1.
- Schiemann, R., D. Lüthi, and C. Schär. 2008. “Seasonality and Interannual Variability of the Westerly Jet in the Tibetan Plateau Region.” Journal of Climate 22 (11): 2940–2957. doi:10.1175/2008JCLI2625.1.
- Takaya, K., and H. Nakamura. 2001. “A Formulation of A Phase-Independent Wave-Activity Flux for Stationary and Migratory Quasigeostrophic Eddies on A Zonally Varying Basic Flow.” Journal of Atmospheric Sciences 58 (6): 608–627. doi:10.1175/1520-0469(2001)058<0608:AFOAPI>2.0.CO;2.
- Torrence, C., and G. P. Compo. 1998. “A Practical Guide to Wavelet Analysis.” Bulletin Amer Meteor Social 79: 61–78. doi:10.1175/1520-0477(1998)079,0061:APGTWA.2.0.CO;2.
- Wang, B., R. Wu, and X. Fu. 2000. “Pacific-East Asia Teleconnection: How Does ENSO Affect East Asian Climate?” Journal of Climate 13 (9): 1517–1536. doi:10.1175/1520-0442(2000)013<1517:PEATHD>2.0.CO;2.
- Wheeler, M. C., and H. H. Hendon. 2004. “An All-Season Real-Time Multivariate MJO Index: Development of an Index for Monitoring and Prediction.” Monthly Weather Review 132 (8): 1917–1932. doi:10.1175/1520-0493(2004)132<1917:AARMMI>2.0.CO;2.
- Yang, J., B. Wang, and B. Qing. 2010. “Biweekly and 21–30-Day Variations of the Subtropical Summer Monsoon Rainfall over the Lower Reach of the Yangtze River Basin.” Journal of Climate 23 (5): 1145–1159. doi:10.1175/2009JCLI3005.1.
- Yang, S. Y., and T. Li. 2016. “Intraseasonal Variability of Air Temperature over the Mid High Latitude Eurasia in Boreal Winter.” Climate Dynamics 47 (7–8): 2155–2175. doi:10.1007/s00382-015-2956-8.
- Yao, Y., H. Lin, and Q. Wu. 2015. “Subseasonal Variability of Precipitation in China during Boreal Winter.” Journal of Climate 28 (16): 6548–6559. doi:10.1175/JCLI-D-15-0033.1.
- Zhang, C. 2005. “Madden Julian Oscillation.” Reviews of Geophysics 43 (2): RG2003. doi:10.1029/2004RG000158.
- Zhang, R., A. Sumi, and M. Kimoto. 1996. “Impact of El Niño on the East Asian Monsoon: A Diagnostic Study of the 86–87 and 91–92 Events.” Journal of the Meteorological Society of Japan 74 (1): 49–62. doi:10.2151/jmsj1965.74.1_49.
- Zhang, R. H., T. R. Li, M. Wen, and L. K. Liu. 2015. “Role of Intraseasonal Oscillation in Asymmetric Impacts of El Niño and La Niña on the Rainfall over Southern China in Boreal Winter.” Climate Dynamics 45 (3–4): 559–567. doi:10.1007/s00382-014-2207-4.
- Zhang, R. H., and A. Sumi. 2002. “Moisture Circulation over East Asia during El Niño Episode in Northern Winter, Spring and Autumn.” Journal of the Meteorological Society of Japan 80 (2): 213–227. doi:10.2151/jmsj.80.213.