
ABSTRACT
The aerosol optical properties and chemical components of PM2.1 (particulate matter with a diameter of 2.1 µm or less) were investigated at Mount Gongga on the eastern slope of the Tibetan Plateau from April 2012 to December 2014. The annual mean aerosol optical depth (AOD) was 0.35 ± 0.23, and the Ångström exponent was 1.0 ± 0.38. The AOD exhibited higher values in summer and winter, but lower values in spring and autumn. Dividing the observational periods into dry and wet seasons, the authors found that the concentrations of K+, elemental carbon, secondary inorganic aerosols, and primary and secondary organic carbon in the dry (wet) season were 0.29 (0.21), 0.88 (0.60), 7.4 (4.5), 7.5 (5.1), and 3.9 (12) µg m−3, respectively. Combined with trajectory analysis, the authors found that higher concentrations of K+, elemental carbon, and primary organic carbon indicated the effects of biomass burning from Southeast Asia during the dry season. However, the oxidation of volatile organic compounds was the main source of aerosols during the wet season, which originated from the Sichuan Basin.
Graphical Abstract

摘要
为探究南亚与四川盆地对青藏高原污染物传输的影响,论文利用青藏高原东坡区域背景站贡嘎山站2012–2014年地基观测数据,系统揭示了青藏高原东坡大气气溶胶浓度、化学成分与光学特性的变化特征。气溶胶光学厚度AOD年均值0.35左右,在夏冬季较高,春秋较低。干季钾离子 (K+)、二次无机气溶胶 (SIAs) 与一次有机碳 (POC)的浓度均高于湿季,湿季二次有机碳 (SOC) 为干季的3.1倍。结合后向轨迹分析,来自东南亚地区气团对应的高浓度K+、元素碳 (EC)及POC表明生物质燃烧源对青藏高原东坡干季气溶胶有显著贡献;湿季气溶胶主要来源于四川盆地可挥发性有机物 (VOCs) 的氧化。
1. Introduction
Atmospheric aerosols are a complex and dynamic mixture of solid and liquid particles from natural and anthropogenic sources, with diameters of approximately 10–3–10 μm (Chen et al. Citation2014). They play an important role in Earth’s radiation budget by scattering and absorbing solar radiation (Ackerman and Toon Citation1981; Xin et al. Citation2017). As a part of the atmospheric aerosol mix, particulate matter (PM) directly leads to reduced visibility, which in turn has effects on regional economies (Balarabe, Abdullah, and Nawawi Citation2015, Citation2016). Also, serving as cloud condensation nuclei or ice nuclei, PM affects the microphysical and radiative properties of clouds (Chen et al. Citation2014; Balarabe, Abdullah, and Nawawi Citation2016). Moreover, homogeneous and heterogeneous reactions occurring on the surface of particles can produce secondary aerosols that are harmful to human health (Hanson, Ravishankara, and Solomon Citation1994; Tang et al. Citation2017). Previous studies have proven that even a slight increase in exposure to poisonous particles may induce respiratory and cardiovascular mortality (Dockery and Pope Citation1994; Espinosa et al. Citation2002).
The properties of aerosols have been widely studied over the Tibetan Plateau, including its principal part (Xin et al. Citation2007; Cong et al. Citation2009a, Citation2009b; Xia et al. Citation2011; Jia et al. Citation2015; Kang et al. Citation2016) as well as its northern, northeastern and southern regions (Xu et al. Citation2014, Citation2015; Che, Wang, and Sun Citation2011). Xin et al. (Citation2007) found the annual mean aerosol optical depth (AOD) over the Tibetan Plateau to be approximately 0.14–0.15, and the dominant aerosol types as fine particles and dust originating from biomass burning. Owing to the existence of the South Asian monsoon, there are very distinct dry and wet seasons in the Tibetan Plateau region. Hence, seasonal differences in air flow may cause differences in aerosol characteristics between these two seasons. Dust and anthropogenic aerosols are transported to the Tibetan Plateau by northeasterly and easterly winds, respectively (Che, Wang, and Sun Citation2011; Jia et al. Citation2015). Plus, the summer monsoon circulation can bring considerable quantities of atmospheric pollutants from South Asia, whereas the westerly flow that dominates in winter is relative clean (Cong et al. Citation2009a, Citation2009b; Xu et al. Citation2014).
Mount Gongga is located in the southeastern region of the plateau, with India and other countries in South Asia adjacent to the south and developed Chinese cities emitting heavy pollution to the east. Whether there is a pollutant transport channel affecting the environment of the Tibetan Plateau is an important question and, although it would be desirable to investigate this topic using satellite-based measurements, this is difficult to achieve because of the problems caused by the surface albedo in plateau areas. Thus, in this work, the optical and chemical characteristics of aerosols at Mount Gongga were studied (from April 2012 to December 2014) using ground-based observations. The aim was to provide preliminary results as a theoretical basis for further exploration of the anthropogenic impact on concentrations of aerosols over the eastern slope of the Tibetan Plateau.
2. Data and methods
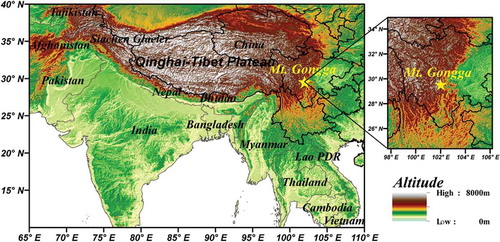
Mount Gongga Station (29.55°N, 102.00°E; 1620 m) is located on the eastern slope of the Tibetan Plateau, with its original ecological environment and vegetation remaining intact . The site is a southwest background station of the Campaign on Atmospheric Aerosol Research Network of China (Xin et al. Citation2015), 110 km away from the Sichuan Basin.
Figure 1. Location of Mount Gongga Station on the eastern slope of the Tibetan Plateau.
A Microtops II sunphotometer (Model 540, Solar Light Company Inc., Glenside, Philadelphia, USA) was used to observe the optical properties, the quality control and quality assurance processes of which can be referred to in the literature (Xin et al. Citation2007, Citation2015, Citation2016; Smirnov et al. Citation2000). PM was collected with a nine-stage Anderson sampler (Series 20–810, Anderson, Atlanta, Georgia, USA) for 48 h (from 0800 LT (local time) on Monday to 0800 LT on Wednesday, every week) at a flow rate of 28.3 L min−1. Then, five cations and three anions were analyzed by ion chromatography (ICS-90, Dionex, Sunnyvale, Califonia, USA), and a thermal/optical carbon analyzer (DRI model 2001A, Desert Research Institute, USA) was used to determine the elemental carbon (EC) and organic carbon (OC) concentrations. The chemical compositions of PM2.1 (PM with a diameter of 2.1 µm or less) were used to analyze the sources of aerosols. For more detailed information on the specification and operating procedures, readers are referred to Xin et al. (Citation2015) and Tian, Pan, and Wang (Citation2016).
Meteorological parameters, as auxiliary data, were acquired from the M520 automatic station at the 1620-m Ecosystem Mount Gongga Station, which is part of the Chinese Ecosystem Research Network. In addition, data from MODIS’ monthly fire location product (MCD14ML) were used, with a detection confidence of more than 50 (Giglio Citation2015). The HYSPLIT-4 trajectory model developed by the National Oceanic and Atmospheric Administration was used to determine the trajectories of airflow. Considering the station is surrounded by mountains, a height of 1000 m above the ground was selected. The simulation time was48 h, with backward trajectories calculated every 6 h.
3. Results and discussion
3.1. Aerosol optical properties
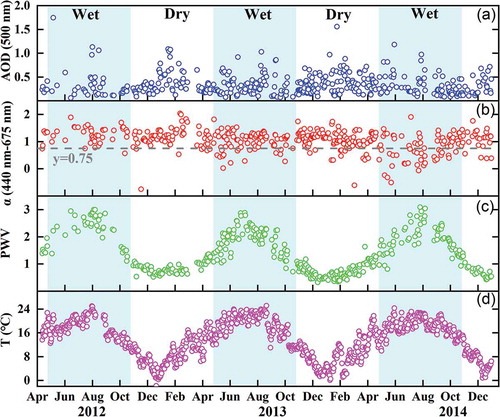
The mean AOD and Ångström exponent (α) for the whole study period were 0.35 ± 0.23 and 1.04 ± 0.38, respectively. As shown in , the AOD exhibited a bimodal pattern, being higher in summer and winter but lower in spring and autumn. To illustrate the changes in aerosol optical characteristics in different seasons, we divided the study period into the dry season (November to April) and wet season (May to October), based on the previous work of He et al. (Citation2008). In the dry season, the mean AOD and α values were 0.36 ± 0.21 and 1.1 ± 0.35, respectively. In the wet season, they were 0.33 ± 0.24 and 0.99 ± 0.41, respectively. Given the distinct meteorological parameters in the two seasons, different AOD and α values were expected. Therefore, the fact that the AOD and α remained nearly consistent is of great interest. It is likely that the sources of particles were different in the two seasons.
Figure 2. Time series of (a) aerosol optical depth, (b) Ångström exponent, (c) surface air temperature, and (d) precipitable water vapor, from April 2012 to December 2014.
3.2. Chemical compositions of fine particles
To analyze the reasons for the nearly consistent AOD in the two seasons, the chemical components of water-soluble ionic species (WSIs), EC, and OC are illustrated during the research period at Mount Gongga. Station in Figure S1. The chemical compositions of PM2.1 also showed a bimodal pattern during the observation period, which varied in the same way as the AOD. The main chemical compositions were WSIs, EC, and OC, and the concentrations in PM2.1 were 8.0, 0.74 and 61 μg m−3, respectively.
To analyze the primary and secondary contributions of aerosols, we calculated the primary OC (POC) and secondary OC (SOC) using the EC tracer method as follows:
Here, POC, SOC, OC, and EC are the concentrations of POC, SOC, OC, and EC; (OC/EC)min is the minimum of the ratio of OC to EC.
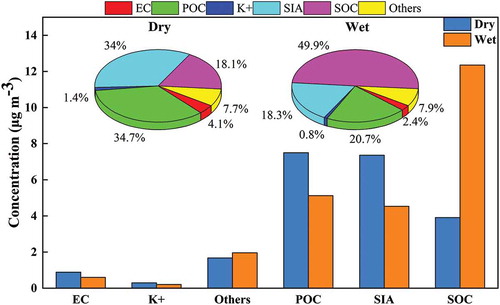
As shown in , the primary air pollutants (EC, POC, and K+) and the secondary inorganic aerosols (SIAs) in the dry season were much higher than those in the wet season. However, the SOC in the wet season was nearly four times larger than that in the dry season, and it was highest in summer. High temperatures can promote volatile organic compounds (VOCs) to take part in gas particle conversion reactions in the wet season, which is conducive to the formation of SOC. Therefore, VOCs are key air pollutants in the wet season. Moreover, as biomass burning markers, the variations of K+, EC, and POC indicated that the main source of aerosols during the dry season might be biomass burning.
Figure 3. Mass concentrations and proportions of chemical compositions in PM2.1 during dry and wet seasons.
3.3. Effects of transport on aerosols
To investigate the source regions of VOCs and biomass burning, we clustered the trajectories of dry and wet seasonal air masses, respectively. As shown in , there were concentrated biomass burning spots in South Asia and Southeast Asia during the dry season. Under the influence of Type 4 air masses (17%) from northern India and central Nepal, the maximum AOD at Mount Gongga was 0.44, followed by Type 1 (0.37, 70%). Considering that Type1 and Type4 were more southerly than the other two types of air mass, they would have carried more fine particles produced by biomass burning and human activities from South and Southeast Asia, and thus the AOD was almost twice as high as the clean air masses of Type 2 (0.26, 8.0%) and Type 3 (0.22, 5.0%).
Figure 4. Forty-eight-hour air backward trajectories and the corresponding fire points for dry and wet seasons.
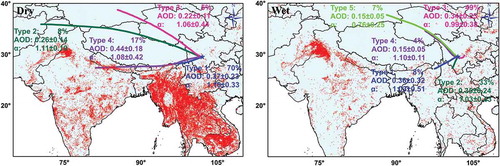
Compared to the dry season, fewer fire spots existed over South Asia during the wet season, and were mainly concentrated in northwestern India, with a few in the provinces of Sichuan and Yunnan. The AOD of the Type 1 air mass in the wet season reached a maximum of 0.36, and the α was the second largest value (1.03). Similar to the dry-season Type 1 and Type 4 air masses, the AODs were large, mainly in the fine mode. It is worth noting that the airflow from the basin reached 48% (Type 3), with more than 0.3 for the AOD and ~1 for the α. This revealed that these air masses entered the eastern plateau carrying an abundance of pollutants from the densely populated Sichuan Basin area, eventually affecting the site at Mount Gongga. In the northwest area of the plateau, where the surface is covered by mountains and glaciers, there were small AOD values of Type 4 and Type 5 (~57% reduction).
To verify our hypothesis, the mass concentrations of the chemical constituents under different air masses were analyzed. According to their atmospheric pathways, the nine air masses were divided into five categories: northwest airflow (Dry-NW); southwest airflow (Dry-SW); northwest airflow (Wet-NW); southwest airflow (Wet-SW); and Wet-Basin airflow. In order to distinguish them more accurately, the mean chemical compositions, AOD and α are presented in .
Figure 5. Average mass concentrations and percentages of chemical compositions for PM2.1 under different air masses in dry and wet seasons.
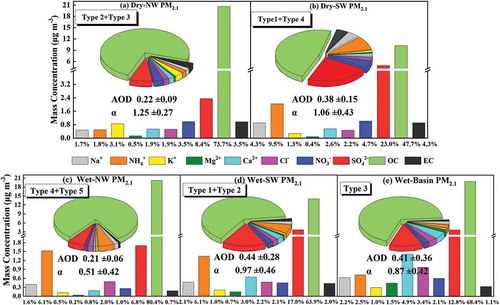
As shown in , the AOD of Dry-NW was 21% lower relative to Dry-SW. Correspondingly, the total mass concentration of the WSIs of Dry-SW was 10.30 μg m−3, which was 1.6 times that of the Dry-NW clean air mass in PM2.1. Cl− is also a biomass burning marker. Cl− in Dry-SW (2.2%) was higher than that in Dry-NW (1.9%) for PM2.1. EC, which serves as an indicator of the primary source of high-temperature combustion aerosols, had a proportion in Dry-SW that was 0.8% higher than in Dry-NW, reflecting the contribution of biomass burning. As biomass burning markers, the variations of K+, EC, and POC indicated that the main source of aerosols during the dry season might be biomass burning (Figure S1). Then, based on the optical and chemical analysis of the corresponding backward trajectory, it is found that the dry season is more affected by biomass burning events in Southeast Asia.
The wet season was affected by the airflow from the Sichuan Basin; the AOD and α values were nearly twice those of the northwest air mass. The wet season is characterized by high temperatures and high humidity, which are favorable conditions for the photochemical reaction of SO2 to H2SO4, and the formation of the alkaline gas NH3. Thus, the two ions SO42− and NH4+were found to be the main components of fine particles, except for OC . Densely populated areas, owing to the fossil fuel combustion and industrial activities that take place within them, will emit large amounts of gaseous precursors, such as NOx, SO2, etc., through a series of homogeneous and heterogeneous chemical reactions of these precursors turning into WSIs. Under Wet-Basin, the effect of artificial activity caused the SO42− in PM2.1 to increase by 2.0 μg m−3, and NO3− by 0.35 μg m−3, compared with Wet-NW. For Wet-SW, these values were 2.0 μg m−3 and 0.13 μg m−3, respectively. Therefore, the wet season is chiefly affected by human activity, which has resulted in a rapid rise in the concentrations of SIAs and OC.
In summary, the enrichment of EC and Cl− in the fine particles dominated by the southwest air mass reflected the influence of the transport of biomass burning plumes from South Asia in the dry season. However, abundant secondary aerosols from the east side indicated the effects of the transport of anthropogenic emissions from the Sichuan Basin.
4. Conclusions
To investigate the sources of aerosol present over the eastern slope of the Tibetan Plateau, the optical and chemical properties of aerosols were measured during April 2012 and December 2014. The main conclusions can be summarized as follows:
The aerosol optical parameters showed a bimodal pattern of seasonal variation at the Mount Gongga site. Specifically, the AOD was higher in summer and winter, but lower in spring and autumn. When we divided the observational period into dry and wet seasons, we found numerous biomass burning spots existed in Southeast Asia in the dry season, and the southerly airflow transported smoke aerosols and anthropogenic fine particles to the Mount Gongga study site. The values of EC, K+, and POC in PM2.1 indicated that the site is significantly affected by biomass burning from Southeast Asia.
On the contrary, local airflow was dominant during the wet season, carrying anthropogenic pollutants from the Sichuan Basin to the station. The AOD and α values of the polluted air masses were twice as high as those of the northwest clean air mass, indicating high concentrations of fine anthropogenic aerosols. The higher concentrations of SOC illustrated that the oxidation of VOCs from the Sichuan Basin was the main source of aerosols in this region.
The results presented in this paper indicate an urgent need to control VOCs in the Sichuan Basin. However, a limitation of our study is that we could not identify the main contributors of the VOC species. Therefore, more work should be under taken with respect to VOC measurements and source apportionment in this area.
Supplemental Material
Download PDF (233.2 KB)Disclosure statement
No potential conflict of interest was reported by the authors.
Supplementary material
Supplemental data for this article can be accessed here
Additional information
Funding
Related Research Data
References
- Ackerman, T., and O. Toon. 1981. “Absorption of Visible Radiation in Atmosphere Containing Mixtures of Absorbing and Nonabsorbing Particles.” Applied Optics 21 (5): 3661–3668. doi:10.1364/AO.20.003661.
- Balarabe, M., K. Abdullah, and M. Nawawi. 2015. “Long-Term Trend and Seasonal Variability of Horizontal Visibility in Nigerian Troposphere.” Atmosphere 6 (10): 1462–1486. doi:10.3390/atmos6101462.
- Balarabe, M., K. Abdullah, and M. Nawawi. 2016. “Seasonal Variations of Aerosol Optical Properties and Identification of Different Aerosol Types Based on AERONET Data over Sub-Sahara West-Africa.” Atmospheric and Climate Sciences 6 (1): 13–28. doi:10.4236/acs.2016.61002.
- Che, H. Z., Y. S. Wang, and J. Y. Sun. 2011. “Aerosol Optical Properties at Mt. Waliguan Observatory, China.” Atmospheric Environment 45 (33): 6004–6009. doi:10.1016/j.atmosenv.2011.07.050.
- Chen, J., J. Y. Xin, J. L. An, Y. S. Wang, Z. R. Liu, N. Chao, and Z. Meng. 2014. “Observation of Aerosol Optical Properties and Particulate Pollution at Background Station in the Pearl River Delta Region.” Atmospheric Research 143 (24): 216–227. doi:10.1016/j.atmosres.2014.02.011.
- Cong, Z. Y., S. C. Kang, S. P. Dong, and Y. L. Zhang. 2009a. “Individual Particle Analysis of Atmospheric Aerosols at Nam Co, Tibetan Plateau.” Aerosol and Air Quality Research 9 (3): 323–331. doi:10.4209/aaqr.2008.12.0064.
- Cong, Z. Y., S. C. Kang, A. Smirnov, and B. Holben. 2009b. “Aerosol Optical Properties at Nam Co, a Remote Site in Central Tibetan Plateau.” Atmospheric Research 92 (1): 42–48. doi:10.1016/j.atmosres.2008.08.005.
- Dockery, D. W., and C. A. Pope. 1994. “Acute Respiratory Effects of Particulate Air Pollution.” Annual Review of Public Health 15 (15): 107–132. doi:10.1146/annurev.pu.15.050194.000543.
- Espinosa, A. J. F., M. T. Rodríguez, F. J. Barragán De La Rosa, and J. C. J. Sánchez. 2002. “A Chemical Speciation of Trace Metals for Fine Urban Particles.” Atmospheric Environment 36 (5): 773–780. doi:10.1016/S1352-2310(01)00534-9.
- Giglio, L. 2015. MODIS Collection 6 Active Fire Product User’s Guide Version A. University of Maryland. available at http://modis-fire.umd.edu/files/MODIS_C6_Fire_User_Guide_A.pdf.
- Hanson, D. R., A. R. Ravishankara, and S. Solomon. 1994. “Heterogeneous Reactions in Sulfuric Acid Aerosols: A Framework for Model Calculations.” Journal of Geophysical Research Atmospheres 99 (D2): 3615–3629. doi:10.1029/93JD02932.
- He, Y. Q., Z. X. Li, X. M. Yang, W. X. Jia, X. Z. He, B. Song, N. N. Zhang, and Q. Liu. 2008. “Changes of the Hailuogou Glacier, Mt. Gongga, China, against the Background of Global Warming in the Last Several Decades.” Journal of China University of Geosciences 19 (3): 271–281. doi:10.1016/S1002-0705(08)60045-X.
- Jia, R., Y. Z. Liu, B. Chen, Z. J. Zhang, and J. P. Huang. 2015. “Source and Transportation of Summer Dust over the Tibetan Plateau.” Atmospheric Environment 123: 210–219. doi:10.1016/j.atmosenv.2015.10.038.
- Kang, S. C., P. F. Chen, C. L. Li, B. Liu, and Z. Y. Cong. 2016. “Atmospheric Aerosol Elements over the Inland Tibetan Plateau: Concentration, Seasonality, and Transport.” Aerosol and Air Quality Research 16 (3): 789–800. doi:10.4209/aaqr.2015.05.0307.
- Smirnov, A., B. Holben, T. Eck, O. Dubovic, and I. Slutsker. 2000. “Cloud-Screening and Quality Control Algorithms for the AERONET Database.” Remote Sensing of Environment 73 (3): 337–349. doi:10.1016/S0034-4257(00)00109-7.
- Tang, G. Q., P. S. Zhao, Y. H. Wang, W. K. Gao, M. T. Chen, J. Y. Xin, X. Q. Li, and Y. S. Wang. 2017. “Mortality and Air Pollution in Beijing: The Long-Term Relationship.” Atmospheric Environment 150: 238–243. doi:10.1016/j.atmosenv.2016.11.045.
- Tian, S. L., Y. P. Pan, and Y. S. Wang. 2016. “Size-Resolved Source Apportionment of Particulate Matter in Urban Beijing during Haze and Non-Haze Episode.” Atmospheric Chemical and Physics 16 (1): 1–19. doi:10.5194/acp-16-1-2016.
- Xia, X. G., X. M. Zong, Z. Y. Cong, H. B. Chen, S. C. Kang, and P. C. Wang. 2011. “Baseline Continental Aerosol over the Central Tibetan Plateau and a Case Study of Aerosol Transport from South Asia.” Atmospheric Environment 45 (39): 7370–7378. doi:10.1016/j.atmosenv.2011.07.067.
- Xin, J. Y., Y. J. Ma, R. X. Liu, L. B. Kong, L. L. Wang, Y. N. Ma, and W. Y. Zhang. 2017. “Optimized Broadband Extinction Method for Retrieving 500 Nm AOD with Long-Term Direct Solar Radiation: Model Test and Application.” Aerosol and Air Quality Research 17 (12): 3220–3229. doi:10.4209/aaqr.2016.12.0591.
- Xin, J. Y., Y. S. Wang, Z. Q. Li, P. C. Wang, W. M. Hao, B. L. Nordgren, S. G. Wang, et al. 2007. “Aerosol Optical Depth (AOD) and Ångström Exponent of Aerosols Observed by the Chinese Sun Hazemeter Network from August 2004 to September 2005.” Journal of Geophysical Research Atmospheres 112 (D5): 1703–1711. doi:10.1029/2006JD007075.
- Xin, J. Y., Y. S. Wang, Y. P. Pan, D. S. Ji, Z. R. Liu, T. X. Wen, Y. H. Wang, et al. 2015. “The Campaign on Atmospheric Aerosol Research Network of China: CARE-China.” Bulletin of the American Meteorological Society 96 (7): 1137–1155. doi:10.1175/BAMS-D-14-00039.1.
- Xin, J. Y. C. S. Gong, Z. R. Liu, Z. Y. Cong, W. K. Gao, T. Song, Y. P. Pan, et al. 2016. “The Observation-Based Relationships between PM 2.5 And AOD over China: The Functions of PM2.5 & AOD over China.” Journal of Geophysical Research Atmospheres 121: doi:10.1002/2015JD024655.
- Xu, C., Y. M. Ma, A. Panday, Z. Y. Cong, K. Yang, Z. K. Zhu, M. Wang, P. M. Amatya, and L. Zhao. 2014. “Similarities and Differences of Aerosol Optical Properties between Southern and Northern Sides of the Himalayas.” Atmospheric Chemical and Physics 14 (6): 3133–3149. doi:10.5194/acp-14-3133-2014.
- Xu, C., Y. M. Ma, C. You, and Z. K. Zhu. 2015. “The Regional Distribution Characteristics of Aerosol Optical Depth over the Tibetan Plateau.” Atmospheric Chemical and Physics 15 (20): 12065–12078. doi:10.5194/acp-15-12065-2015.