
ABSTRACT
This study presents the major features of extreme spring cold spells (ESCS) in North China during 1961–2014 and the evolving processes. During an ESCS, northern Eurasia is controlled by large-scale positive SLP anomalies and an anomalous anticyclone that continuously transport northern cold air to North China, causing significant, persistent, lower-than-normal daily temperatures. In fact, these positive SLP and anticyclonic wind anomalies begin to appear over northwestern Europe about 10 days prior to the ESCS. The anticyclonic wind anomalies keep moving southeastward and expand to the west of Lake Baikal until two days before the ESCS. Then, the center of the anomalous low-level anticyclone moves over Lake Baikal, inducing northerly wind anomalies that transport cold air into North China. In the following days, as the positive SLP anomalies weaken, the anomalous anticyclone and related northerly winds appear to wane, and the ESCS gradually comes to an end. The results may prove meaningful for the prediction and early warning of ESCSs.
Graphical Abstract
摘要
华北春季冷事件(俗称‘倒春寒’)对当地冬小麦产量具有显著影响,但相关研究较少。本研究通过对1961–2014年极端春季冷事件(ESCS)的分析,发现ESCS期间,欧亚北部的异常反气旋将北方冷空气源源不断地输送到华北,导致那里出现持续低温。上述环流异常在ESCS发生前10天已经开始出现,之后反气旋式风场距平持续向东南方向移动,导致偏北风距平向华北输送冷空气,ESCS开始。随后,上述环流异常减弱,ESCS在接下来的几天逐渐减弱至结束。上述结果对提高华北春季气温预测具有重要意义。
1. Introduction
Cold surges in winter over East Asia, which are characterized by a strong Siberian high and sudden drop in surface air temperature (e.g. Zhang, Sperber, and Boyle Citation1997; Wang et al. Citation2012; Park et al. Citation2015; Ou et al. Citation2015), usually cause considerable socioeconomic problems, such as adverse public health (Yang et al. Citation2009; Chung et al. Citation2009). They are one of the most important types of extreme weather/climate events, and closely related with the activity of the East Asian winter monsoon. Winter cold surges over East Asia have been studied intensively by meteorologists ever since the 1950s (e.g. Li Citation1955; Ding Citation1990). Cold surges in East Asia are often accompanied by a strengthening of the Siberian high (Ding Citation1990; Zhang, Sperber, and Boyle Citation1997). Variations in ENSO and Arctic Oscillation can also significantly influence cold surges over East Asia (Chen, Huang, and Yoon Citation2004; Jeong and Ho Citation2005). The frequency of cold surges over East Asia seems to have reduced in recent decades, possibly due to the weakened East Asian winter monsoon activity under global warming (Wang and Ding Citation2006). Woo et al. (Citation2012) found that cold surges over Northeast Asia were stronger, and lasted longer, during the 1980s and 2000s compared to those that occurred in the 1990s.
However, less attention has been paid to spring cold spells in East Asia, hereafter referred to as ‘extreme spring cold spells’ (ESCSs), despite their significant influence on crop yields in this region. North China (35°–40°N, 110°–120°E), including Henan, Hebei, Shandong and Shanxi provinces, and Beijing, is a major region in China for winter wheat agriculture. It is in the spring (March to May) in this region that the reviving, jointing and booting stages of winter wheat mainly happen. Many studies have investigated the detrimental effects of winter–spring temperature on winter wheat growth and yield (e.g. Wheeler et al. Citation2000; Li et al. Citation2015). When an ESCS happens over North China, continuous negative temperature anomalies can have disastrous effects on the wheat yield, inducing yield losses of up to 20% or more (Li et al. Citation2015). Previous studies have found that the spring freeze effect on wheat growth and yield is modulated by winter–spring intraseasonal temperature fluctuations: the effects of later spring freeze stress can be exacerbated by winter warming but extenuated by early spring cold events (Li et al. Citation2015). With warm winters becoming more frequent under global warming, the negative effects of ESCSs on crop yields may become more obvious. Nevertheless, there has been little systematic research on the features of North China ESCSs, aside from some preliminary studies on spring cold spells in very small areas, like at the province or city scale (e.g. Li et al. Citation2010; You et al. Citation2013; Zhao et al. Citation2014), nor on the related evolving processes and large-scale circulation patterns.
Thus, to better understand North China ESCSs and provide helpful information for their prediction, in this study, we investigate the features of ESCSs over the past several decades, analyze the related atmospheric circulation, and reveal the evolving processes associated with North China ESCSs at the synoptic scale.
2. Data and methods
In North China (35°–40°N, 110°–120°E), the standard deviation of the daily temperature in 54 springs is 6.68°C. During March–May, when the daily temperature remains at least 3°C lower than the climatological daily mean in a continuous five-day period (−3/5 criteria, for short), an ESCS is identified. If a new cold spell occurrence is detected before the previous one ends, the two spells are considered as one continuous event. The five-day duration of spring temperature anomalies is used because wheat growth can be significantly influenced under such a period of low-temperature stress (Li et al. Citation2015). Compared with winter cold surges, which feature a strong increase in SLP and sharp drop in temperature (e.g. Zhang, Sperber, and Boyle Citation1997; Wang et al. Citation2012; Park et al. Citation2015; Ou et al. Citation2015), ESCSs are mostly characterized by continuous negative temperature anomalies, which can robustly affect the growth of wheat in North China. Among the 21 ESCS events identified (), 10 feature a temperature drop stronger than 3°C, and the other 11 weaker than 3°C.
Table 1. Details of the 21 ESCSs according to the −3/5 criteria.
The daily temperature from the CN05 dataset (Xu et al. Citation2009; Wu and Gao Citation2013), which has a resolution of 0.5° × 0.5°, is used to identify ESCSs. Additionally, we use the daily data of the NCEP-1 reanalysis (Kalnay et al. Citation1996) to analyze the related atmospheric circulation, including the air temperature at 2 m, SLP, geopotential height, and meridional/zonal wind field. The evolving processes of ESCSs are shown by compositing the circulation anomalies during the preceding and ESCS days, listed in . For example, the SLP anomalies on the first days of an ESCS are calculated as the difference between the SLP on those days and the climatological daily mean SLP on the same days.
3. Results
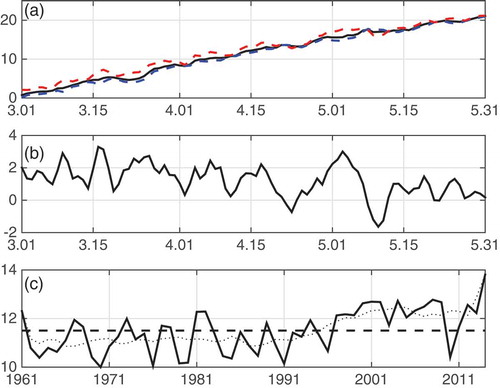
In spring, the daily temperature increases gradually from 0.75°C to 21.1°C during 1 March to 31 May, with a warming rate of 0.22°C d−1 ()). The standard deviation of the multi-year mean daily temperature is 6.05°C. The seasonal mean temperature (with a standard deviation of 0.9°C for the 54 springs) increases robustly after the late 1990s ()), which is consistent with the tipping point of the Pacific Decadal Oscillation phase (Zhu et al. Citation2011, Citation2015). The red and blue dashed lines in ) represent the multi-year-mean daily temperature during 1961–95 and 1997–2014, respectively. The daily temperature increases over almost the entire spring after the late 1990s ()). Specifically, stronger warming after the start of the 21st century happens in the early spring, and weaker warming or even cooling in the late spring.
Figure 1. (a) Time series of multi-year mean daily spring temperature in North China (black line, 1961–2014; blue dashed line, 1961–95; red dashed line, 1997–2014; units: °C). (b) Time series of the difference between the multi-year mean daily temperature during 1997–2014 and that during 1961–95. (c) Time series of the spring mean temperature during 1961–2014. The dashed line is the multi-year mean spring temperature (11.72°C).
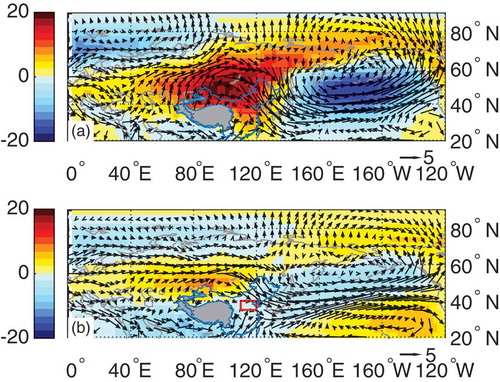
shows the climatological mean winter and spring SLP (zonal anomalies) and wind at 850 hPa. In winter, a strong Siberian high, Aleutian low, and westerlies over East Asia dominate the East Asian winter monsoon circulation. In spring, the large-scale circulation resembles that in winter, only the intensity is considerably weaker. The relatively weak circulation pattern means the cold air activity influencing North China in spring is much weaker.
Figure 2. Climatological mean (a) winter and (b) spring SLP (zonal anomalies) and wind at 850 hPa. The red rectangle shows the area of North China (35°–40°N, 110°–120°E).
Using the −3/5 criteria, we identify 21 ESCSs during 1961–2014 (). When the ESCS criteria are loosened to −2/5, more events (65) are identified. But, overall, the evolving processes of ESCSs identified by these two different sets of criteria (−3/5 and −2/5) are very similar, with the only difference being that the intensity of the anomalies is somewhat weaker when the criteria are loosened to −2/5. The frequency of ESCSs (), as identified by the −3/5 criteria, shows obvious interdecadal variation. There are six, three, three, five, one, and three ESCSs during the 1960s, 1970s, 1980s, 1990s, 2000s, and 2010s, respectively. There are more ESCSs during the 1960s and 1990s (six and five), and fewer in the 1970s, 1980s and 2000s (three, three and one, respectively). However, during the 1970s, two of the three ESCSs last for 16 and 17 days, which is much longer than under the criteria of five days. Besides, there is a good chance that more than three ESCSs will be recorded during the 2010s, considering three have already occurred during 2010–14.
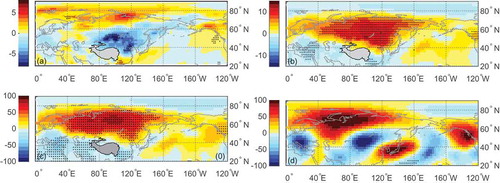
To avoid falsely affecting the composite analysis, we select and remove two events that happen less than 10 days after the previous one: 26 April 1965 and 9 March 1969. Another event, on 1 March 1969, is also removed because it is just the ending days of a previous cold surge in February. Subsequently, we have 18 ESCSs remaining for the composite analysis. The composite results are quite similar when based on the 21 or 18 events, just with weaker anomalies over northwestern Eurasia in the preceding 8–10 days for the latter. During the occurrence of an ESCS, the low-level daily air temperature is significantly lower than the climatological average over central and northern East Asia ()). The cooling maxima are located over North China and around Lake Baikal, with amplitudes larger than −5°C in Shandong, Henan, and Hebei provinces. Large-scale positive SLP anomalies occupy the northern Eurasian continent, with a center to the northeast of Lake Baikal ()). The low-level geopotential height at 850 hPa also shows large-scale significant positive anomalies over northern Eurasia, and negative anomalies to the south ()). With respect to high-level geopotential height ()), a wave-train pattern appears over the Eurasian continent, with positive–negative–positive anomalies centered to the south of the Kara Sea, to the southeast of Lake Baikal, and over Honshu Island. However, the differences are insignificant at the high level. Thus, we mainly focus on the signals at the low level in the following analysis.
Figure 3. Difference in the (a) air temperature at 2 m, (b) SLP, and (c, d) geopotential height at (c) 850 hPa and (d) 200 hPa between the first days of the ESCS and the climatological daily mean state on the same days. Statistical significance at 0.05 level is denoted by the dotted areas.
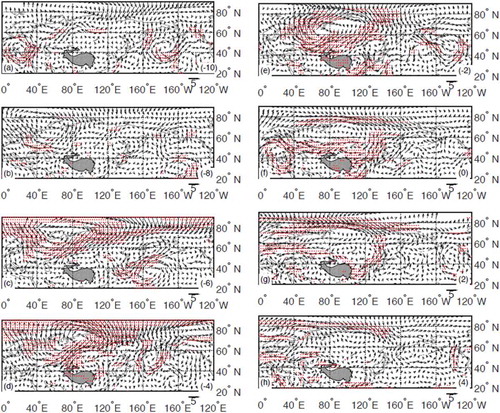
To illustrate the evolving processes associated with ESCSs, we further calculate the difference in the SLP and wind at 850 hPa on the preceding and ESCS days to the climatological daily averages on the corresponding days. The results for the preceding tenth (−10), eighth (−8), sixth (−6), fourth (−4), and second (−2) days, and the first (0), third (2), and fifth (4) ESCS days, are shown in .
Figure 4. Difference between the horizontal wind at 850 hPa on the preceding tenth to fifth days of the ESCS and the climatological daily mean state on the same days. Statistical significance at 0.05 level is denoted by the dotted areas.
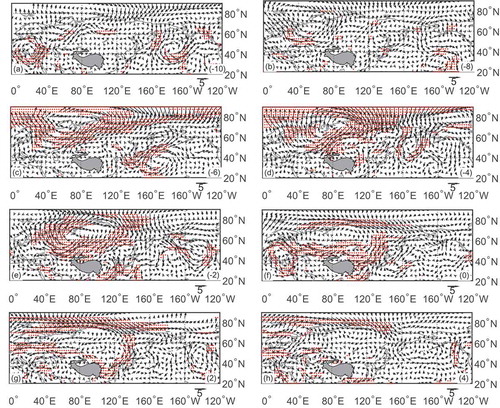
Prior to the preceding tenth day, positive SLP anomalies appear over the northwestern corner of Europe, but the values are weak and insignificant (not shown). From the preceding tenth day, significant positive SLP anomalies begin to form over the Barents Sea and over the northern Urals. Correspondingly, significant anticyclonic anomalies begin to emerge there ()). On the preceding eighth day, the significant anomalies over the northern Urals expand and become stronger. Accordingly, the anticyclonic anomalies over the northern Urals become strengthened ()), and cold air is transported southwestward to western Siberia. Cold anomalies appear over the Eurasian continent, but the values are insignificant (Figure S1b). In the following days, the positive SLP anomalies over the northern Urals keep moving southeastward. Meanwhile, the related anticyclonic anomalies also move southeastward (). Significant cooling begins to appear over western Siberia on the preceding sixth day (Figure S1c), and the center of the cold anomalies keeps moving southeastward with the anticyclonic anomalies. On the preceding second day ()), the positive SLP anomalies and the relevant anticyclonic anomalies occupy the northern Eurasian continent. Cold air accumulates, centering over Lake Baikal (Figure S1e).
After that, the center of the positive SLP anomalies and anomalous anticyclone moves near Lake Baikal ()), cold air is further conveyed to North China, and an ESCS in North China begins (Figure S1f). In the following days, the positive SLP anomalies over the northern Eurasian continent begin weakening and further move southward. On the third day of the ESCS ()), the positive SLP anomalies split into two weak centers to the south of the Kara Sea and southeast of Lake Baikal, while anomalous northerly winds control North China, and keep conveying cold air and causing cold anomalies there (Figure S1g). The significant positive SLP anomalies and anomalous anticyclone move to South China on the fifth ESCS day, as do the negative temperature anomalies (Figure S1h). The ESCS in North China then comes to an end.
4. Summary and discussion
In this study we investigate the features and related evolving processes of ESCSs in North China. Using the −3/5 criteria (daily temperature anomalies lower than −3°C lasting for more than five consecutive days), we identify 21 ESCS in North China. The frequency of ESCSs exhibits interdecadal changes during 1961–2014. During an ESCS, large-scale positive SLP anomalies occur over northern Eurasia, an anomalous anticyclone appears centered over Siberia, and related northerly wind anomalies from the northern high latitudes bring cold air to North China.
Significant anomalies begin to emerge in the low-level atmospheric circulation on the preceding tenth day, when positive SLP anomalies and anticyclonic anomalies are observed over northwestern Europe. In the following days, the positive SLP anomalies and anomalous anticyclone continue to move southeastward, and the related northwesterly wind anomalies move southeastward simultaneously. Until the preceding second day, the center of positive SLP anomalies shifts to the northern Urals and the anomalous anticyclone expands southeastward to Lake Baikal. Then, these positive SLP anomalies extend further to the southeast over northeastern Asia and become somewhat weaker. The northerly anomalies related with the anomalous anticyclone near Lake Baikal bring cold air to North China, and the surface air temperature shows significant negative anomalies there. The northerly wind anomalies over North China persist during the ESCS. Finally, the positive SLP anomalies and related northerly wind anomalies weaken until they disappear, bringing an end to the ESCS.
The skill of short- (3–5 days) to mid-range (5–10 days) weather forecasts still needs robust improvement, especially for extreme weather events. The signals’ southeastward propagating processes prior to and during an ESCS seem to reflect the intraseasonal oscillation, which has a period of 10–60 days in the mid–high latitudes (e.g. Yang et al. Citation2013; Yang and Li Citation2016). An empirical prediction model using the intraseasonal oscillation signal as a major predictability source can attain useful skill of up to 25 days (Yang and Li Citation2016). Therefore, the large-scale circulation signals over the Eurasian continent prior to an ESCS could be useful for the prediction and early warning of ESCSs in North China, and thus help reduce the possible economic losses. Besides, are there any signals in the preceding Arctic sea ice, Arctic Oscillation, and sea surface temperature? These issues still need more in-depth studies.
Supplemental Material
Download PDF (661.8 KB)Disclosure statement
No potential conflict of interest was reported by the authors.
Supplementary Material
Supplemental data for this article can be accessed online at https://doi.org/10.1080/16742834.2018.1514937
Additional information
Funding
References
- Chen, T. C., W. R. Huang, and J. Yoon. 2004. “Interannual Variation of the East Asian Cold Surge Activity.” Journal of Climate 17 (2): 401–413. doi:10.1175/1520-0442(2004)017<0401:IVOTEA>2.0.CO;2.
- Chung, J.-Y., Y. Honda, Y.-C. Hong, X.-C. Pan, Y.-L. Guo, and H. Kim. 2009. “Ambient Temperature and Mortality: An International Study in Four Capital Cities of East Asia.” Science of the Total Environment 408 (2): 390–396. doi:10.1016/j.scitotenv.2009.09.009.
- Ding, Y. H. 1990. “Buildup, Air-Mass Transformation and Propagation of Siberian High and Its Relations to Cold Surge in East Asia.” Meteorology and Atmospheric Physics 44 (1–4): 281–292. doi:10.1007/BF01026822.
- Jeong, J. H., and C. H. Ho. 2005. “Changes in Occurrence of Cold Surges over East Asia in Association with Arctic Oscillation.” Geophysical Research Letters 32 (14): L14704. doi:10.1029/2005gl023024.
- Kalnay, E., M. Kanamitsu, R. Kistler, W. Collins, D. Deaven, L. Gandin, M. Iredell, et al. 1996. “The NCEP/NCAR 40-Year Reanalysis Project.” Bulletin of the American Meteorological Society 77 (3): 437–471. Doi:10.1175/1520-0477(1996)077<0437:TNYRP>2.0.CO;2.
- Li, X., J. Cai, F. Liu, T. Dai, W. Cao, and D. Jiang. 2015. “Spring Freeze Effect on Wheat Yield Is Modulated by Winter Temperature Fluctuations: Evidence from Meta-Analysis and Simulating Experiment.” Journal of Agronomy and Crop Science 201 (4): 288–300. doi:10.1111/jac.12115.
- Li, X. Z. 1955. “A Study of Cold Waves in East Asia.” in Chinese In “Offprints of Scientific Works in Modern China-Meteorology (1919–1949)”, 35–117. Beijing: Science Press.
- Li, Y., X.-G. Yang, S.-W. Dai, and W.-F. Wang. 2010. “Spatiotemporal Evolution Characteristics of Late Spring Cold in Guizhou Province under Global Climate Change.” (in Chinese) Journal of Applied Ecology 21 (8): 2099–2108.
- Ou, T., D. Chen, J.-H. Jeong, W. Linderholm, and T. Zhou. 2015. “Changes in Winter Cold Surges over Southeast China: 1961 to 2012.” Asia-Pacific Journal of Atmospheric Sciences 51 (1): 29–37. doi:10.1007/s13143-014-0057-y.
- Park, T.-W., C.-H. Ho, J.-H. Jeong, J.-W. Heo, and Y. Deng. 2015. “A New Dynamical Index for Classification of Cold Surge Types over East Asia.” Climate Dynamics 45 (9–10): 2469–2484. doi:10.1007/s00382-015-2483-7.
- Wang, H.-J., J.-Q. Sun, H.-P. Chen, Y.-L. Zhu, Y. Zhang, D.-B. Jiang, X.-M. Lang, et al. 2012. “Extreme Climate in China: Facts, Simulation and Projection.” Meteorologische Zeitschrift 21 (3): 279–304. doi:10.1127/0941-2948/2012/0330.
- Wang, Z., and Y. Ding. 2006. “Climate Change of the Cold Wave Frequency of China in the Last 53 Years and the Possible Reasons.” (in Chinese) Chinese Journal of Atmospheric Sciences 30 (6): 1068–1076.
- Wheeler, T. R., P. Q. Craufurd, R. H. Ellis, J. R. Porter, and P. V. Prasad. 2000. “Temperature Variability and the Yield of Annual Crops.” Agriculture, Ecosystems & Environment 82: 159–167. doi:10.1016/S0167-8809(00)00224-3.
- Woo, S., B. Kim, J. Jeong, S. Kim, and G. Lim. 2012. “Decadal Changes in Surface Air Temperature Variability and Cold Surge Characteristics over Northeast Asia and Their Relation with the Arctic Oscillation for the past Three Decades (1979–2011).” Journal of Geophysical Research 117: D18117. doi:10.1029/2011JD016929.
- Wu, J., and X.-J. Gao. 2013. “Gridded Daily Observation Dataset over China Region and Comparison with the Other Datasets.” (in Chinese) Chinese Journal of Geophysics 56(4):1102–1111. doi:10.6038/cjg20130406.
- Xu, Y., X. Gao, Y. Shen, C. Xu, Y. Shi, and F. Giorgi. 2009. “A Daily Temperature Dataset over China and Its Application in Validating A RCM Simulation.” Advances in Atmospheric Sciences 26 (4): 763–772. doi:10.1007/s00376-009-9029-z.
- Yang, S., and T. Li. 2016. “Intraseasonal Variability of Air Temperature over the Mid-High Latitude Eurasia in Boreal Winter.” Climate Dynamics 47 (7–8): 2155–2175. doi:10.1007/s00382-015-2956-8.
- Yang, S., B. Wu, R. Zhang, and S. Zhou. 2013. “The Zonal Propagating Characteristics of Low-Frequency Oscillation over the Eurasian Mid-High Latitude in Boreal Summer.” Science in China: Earth Science 56: 1566–1575. doi:10.1007/s11430-012-4576-z.
- Yang, T.-C., P.-C. Wu, V. Y.-J. Chen, and H.-J. Su. 2009. “Cold Surge: A Sudden and Spatially Varying Threat to Health?” Science of the Total Environment 407 (10): 3421–3424. doi:10.1016/j.scitotenv.2008.12.044.
- You, H., H. Zhou, H. Yang, and Y. Jiang. 2013. “Analysis on the Late Spring Coldness Processes in Yunnan.” (in Chinese) Meteorological Monthly 39 (6): 738–748.
- Zhang, Y., K. R. Sperber, and J. S. Boyle. 1997. “Climatology and Interannual Variation of the East Asian Winter Monsoon: Results from the 1979–95 NCEP/NCAR Reanalysis.” Monthly Weather Review 125 (10): 2605–2619. doi:10.1175/1520-0493(1997)125<2605:CAIVOT>2.0.CO;2.
- Zhao, H., X. Wang, W. Hu, T. Cao, and B. Li. 2014. “Genetic Analysis and Countermeasures of Wheat Late-Spring-Coldness Injury in South Huang-Huai Wheat Region.” (in Chinese) Journal of Henan Agricultral Sciences 43 (8): 34–38.
- Zhu, Y., H. Wang, J. Ma, T. Wang, and J. Sun. 2015. “Contribution of the Phase Transition of Pacific Decadal Oscillation to the Late 1990s’ Shift in East China Summer Rainfall.” Journal of Geophysical Research 120 (17): 8817–8827. doi:10.1002/2015jd023545.
- Zhu, Y., H. Wang, W. Zhou, and J. Ma. 2011. “Recent Changes in the Summer Precipitation Pattern in East China and the Background Circulation.” Climate Dynamics 36 (7–8): 1463–1473. doi:10.1007/s00382-010-0852-9.