
ABSTRACT
For two rapid-intensification typhoons — Mujigae (2015) and Vicente (2012) — the atmospheric circulation conditions and potential vorticity (PV) anomaly are compared. Although similar in their rapid-intensification (RI) rate, their atmospheric circulation conditions differ considerably, with the absence or presence of an upper-tropospheric inverted trough (IT) being their main difference. The IT provides useful clues for the onset of RI, by estimating the interaction between the environmental upper-tropospheric IT and the typhoon based on eddy momentum flux convergence calculation. The trough–typhoon interaction is examined by comparing the PV transport process for the two cases. An isolated positive PV column develops vertically near Mujigae’s onset of RI, which is not influenced by synoptic-scale PV advection. However, for Vicente, another source — advection from a high-latitude PV reservoir along the upper-tropospheric IT — joins the built-up high-PV anomaly in favor of RI.
Graphical Abstract
摘要
对两次快速增强台风‘彩虹(2015)’和‘韦森特(2012)’的大气环流条件和高空位涡异常进行了比较。虽然两个台风的快速增强速率相似,但它们的大气环流条件差别很大。通过涡动量通量收敛方法,计算高空倒槽与台风环流的相互作用,发现高空倒槽为台风快速增强的发生提供了十分重要的线索。研究发现:一个孤立的正位涡柱在‘彩虹’台风开始快速增强前垂直发展,不受天气尺度位涡平流的影响。而对于‘韦森特’台风,来自高纬度位涡池沿高空倒槽方向,持续不断为台风环流输送位涡,有利于‘韦森特’台风快速增强。本文的工作为今后研究倒槽对台风快速增强的作用提供了理论依据。
关键词:
1. Introduction
This study documents and compares the rapid intensification (RI) of two typhoons — Mujigae (2015) and Vicente (2012) — based on Japan Meteorological Agency best-track data. The purpose is to examine the role that the upper-tropospheric trough and potential vorticity (PV) play in the RI stage of Mujigae and Vicente. This task is aided by using National Centers for Environmental Prediction Global Forecast System (GFS) reanalysis data (resolution: 0.5° × 0.5°), which is a globally gridded dataset representing the state of the Earth’s atmosphere, incorporating observations and numerical weather prediction model output.
Significant progress has been made in the prediction of tropical cyclone (TC) tracks (DeMaria et al. Citation2014). However, compared with the forecasting of TC tracks, the prediction of TC intensity change, especially those of TCs undergoing RI, is facing greater challenges (Rappaport et al. Citation2009). Kaplan and DeMaria (Citation2003) defined RI in the Atlantic as an increase in maximum sustained 1-min surface averaged wind speed of 30 kt (1 kt = 0.514 m s−1) in 24 h. Owing to the potential impacts of storms that undergo RI just prior to landfall, RI is significant from a forecasting perspective (Franklin et al. Citation2006).
Much of the research into intensity change and RI has focused on the environment the TC. Following Hoskins, McIntyre, and Robertson (Citation1985), PV provides a more concise dynamical framework for examining TC–trough interactions. The added benefit of PV lies in its conservation properties in adiabatic and frictionless flow. Material changes in PV can be directly related to diabatic processes. Bosart et al. (Citation2000) depicted the upper-tropospheric PV anomalies of Hurricane Opal (1995), demonstrating that those nearby were influenced by synoptic-scale PV advection originated from the upper-tropospheric trough before and after the RI process. Composite studies in the Atlantic (Hanley, Molinari, and Keyser Citation2001) and western North Pacific (WNP) (Ventham and Wang Citation2007) have suggested that upper-tropospheric trough interaction can affect TC intensity by upper-tropospheric PV advection.
Several observational studies have documented the interaction of the RI of TCs with upper-tropospheric troughs (DeMaria, Baik, and Kaplan Citation1993; Bosart et al. Citation2000; Shieh et al. Citation2013). Numerical studies (Shi, Chang, and Raman Citation1997; Kimball and Evans Citation2002; Chen et al. Citation2017) have identified relationships between TC intensity change and the structure of a nearby upper-tropospheric trough. However, the possible mechanism by which the RI of a TC might be caused by an upper-tropospheric inverted trough (IT) has yet to be described. In this study, we speculate the mechanism by which an upper-tropospheric IT can cause the RI of a TC, by analyzing the upper-tropospheric outflow, angular momentum, and PV anomaly.
2. Case descriptions
2.1. Overview of mujigae
Mujigae was the strongest typhoon in 2015, striking Guangdong Province in October of that year, leading to 27 human fatalities and direct economic losses totaling more than ¥27.02 billion (Tang et al. Citation2018).
Mujigae originated from a weak tropical disturbance near Palau on 30 September 2015. It then entered the South China Sea (SCS) on 2 October 2015. From 0600 UTC 3 October, the minimum sea level pressure (MSLP) decreased from 985 to 950 hPa and the maximum sustained 10-m wind increased from 28 to 43.7 m s−1 in 18 h (Figure S1(a,b)), which satisfied the conditions of RI (Kaplan and DeMaria Citation2003). Thus, 0600 UTC 03 October is considered as the onset of the RI of Mujigae.
2.2. Overview of vicente
Vicente is regarded as the most powerful storm to have attacked southern China in 2012. Eleven people died from the disaster and there were direct economic losses totaling more than ¥20.5 billion (CMA Citation2012).
Vicente developed into a tropical storm over the northeastern part of the SCS at 1200 UTC 21 July. Starting at 0000 UTC 23 July, the intensification rate of Vicente increased, with the MSLP dropping from 985 to 950 hPa and the maximum sustained 10-m wind increasing from 25 to 41.1 m s−1 within 18 h (Figure S1(c,d)). As with Mujigae, these observations also support the criteria for RI. Therefore, we designate the time of 0000 UTC 23 July as the onset of the RI of Vicente.
3. Large-scale environment
The time series of the synoptic charts for both typhoons were plotted to explore the continuous evolution of their large-scale environments before RI ( and ). Based on these, we try to distinguish the similarities and differences in the characteristics of their large-scale environments with respect to their induction of RI.
Figure 1. At −12 h (1800 UTC 2 October 2015), for typhoon Mujigae, the (a) 200-hPa jet (shaded; units: m s−1), geopotential height (blue contours; units: 10 gpm), temperature (red dotted lines; units: K), and horizontal winds (vectors; units: m s−1); (c) 500-hPa geopotential height (blue contours; units: 10 gpm), temperature (red dotted lines; units: K), and horizontal winds (vectors; units: m s−1); and (e) 850-hPa water vapor flux (shaded; units: g s−1 hPa−1 cm−1), geopotential height (contours; units: 10 gpm), relative humidity (purple contours; units: %), and horizontal winds (vectors; units: m s−1). Panels (b), (d), and (f) are the same as (a), (c), and (e) but at 0 h (0600 UTC 3 October). The black dotted line represents the trough line of the EAT, and the green dashed line shows the STR. The red letters ‘C’ and ‘W’ stand for cold and warm centers, respectively. The black letters ‘L’ and ‘H’ denote low and high pressure, respectively. The red typhoon symbol denotes the TC center at the surface level.
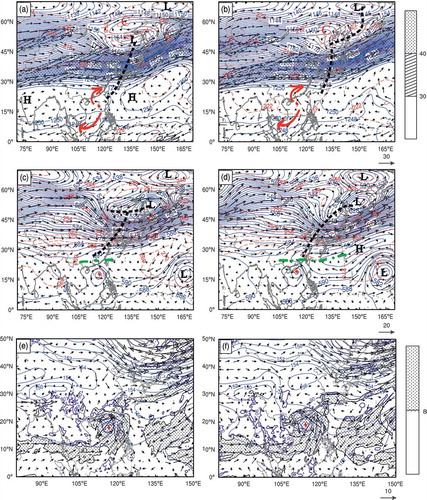
Figure 2. At −12 h (1200 UTC 22 July 2012), for typhoon Vicente, the (a) 200-hPa jet (shaded; units: m s−1), geopotential height (blue contours; units: 10 gpm), temperature (red dotted lines; units: K), and horizontal winds (vectors; units: m s−1); (c) 500-hPa geopotential height (blue contours; units: 10 gpm), temperature (red dotted lines; units: K), and horizontal winds (vectors; units: m s−1); and (e) 850-hPa water vapor flux (shaded; units: g s−1 hPa−1 cm−1), geopotential height (contours; units: 10 gpm), relative humidity (purple contours; units: %), and horizontal winds (vectors; units: m s−1). Panels (b), (d) and (f) are the same as (a), (c), and (e) but at 0 h (0000 UTC 23 July). The black dotted line represents the trough line of the EAT, and the green dashed line shows the STR. The red letters ‘C’ and ‘W’ stand for cold and warm centers, respectively. The black letters ‘L’ and ‘H’ denote low and high pressure, respectively. The red typhoon symbol denotes the TC center at the surface level.
3.1. Synoptic situation for mujigae
shows the 200-, 500-, and 850-hPa fields from the GFS analysis data for Mujigae before and at onset of RI. At −12 h (1800 UTC 2 October; )), the East Asian Trough (EAT) develops vigorously at 200 hPa, the trough line extends to the northeast of China, and the upper-tropospheric jet axis stretches zonally near 35°N along the airflow spanning the EAT. Double highs develop to the south of the EAT. One of them, the South Asia High (SAH), behind the EAT, extends westwards to 120°E. Two outflow channels — one polewards, forced by the pressure gradient between the EAT and the SAH, and the other equatorwards along the southeastern edge of the SAH system — are established. At 0 h of RI ()), a northeast cold vortex develops while the EAT moves slowly eastwards. The upper-tropospheric jet remains stable north of 30°N. However, the poleward and equatorward outflows around Mujigae are obviously enhanced, accompanied by the merging of the double highs and thus an increase in divergence. This can accelerate the removal of the mass field and strengthen the secondary circulation, enhancing the TC’s primary circulation (Chen et al. Citation2017).
At 500 hPa, the general circulation of the atmosphere shows a meridional pattern, and the northeast cold trough develops vigorously at −12 h ()). The cold air invades into North China, and the western Pacific subtropical high (WPSH) extends to 112°E. It is important to note that the Subtropical Ridge (STR) is located on the northern side of Mujigae, which inhibits the northward movement of Mujigae. At 0 h of RI ()), the northeast cold vortex and trough line are stable and the WPSH is significantly enhanced, with the appearance of a 5950-gpm closed center. Meanwhile, the STR also increases significantly, which strengthens the transport of both water vapor and momentum on the eastern side of Mujigae, and enhances the asymmetric structure of the typhoon.
At 850 hPa, the water vapor transportation towards Mujigae is vigorous, from the Bay of Bengal, at −12 h ()). The relative humidity of the typhoon center exceeds 90%. As RI begins ()), the water vapor transport from the Bay of Bengal increases significantly. In addition, water vapor from the Pacific is also transported to the vicinity of Mujigae.
3.2. Synoptic situation for vicente
shows the synoptic situation for Vicente before and at onset of RI. At 200 hPa, different from the upper-level situation for Mujigae, a two-troughs–one-ridge pattern is located north of 35°N. A stronger trough (the left-hand one) — the Lake Baikal Trough (LBT) — develops vigorously, and the trough line extends to the northwest of China at −12 h relative to the onset of Vicente’s RI (1200 UTC 22 July; )). Two upper-level jet axes are apparent, located in Uzbekistan to Xinjiang (China) and Japan, respectively. The SAH extends to 98°E. Vicente is located at the southeast edge of the SAH. In the mid-low latitudes, there is an upper-tropospheric IT on the northeast side of Vicente. The northeast airflow in front of the IT invades the typhoon circulation, which can result in the intensification of (in this case) Vicente (Shieh et al. Citation2013). Two outflow channels — one westwards and another one equatorwards — are established, giving rise to a strong divergence pattern. As RI starts ()), the LBT moves slowly eastwards. The locations of the two upper-tropospheric jet axes vary little, but the westward and equatorward outflow are obviously enhanced. The upper-tropospheric IT moves to the north-northeast of Vicente.
At 500 hPa, the atmospheric circulation presents a meridional pattern, and the cold vortex develops vigorously in Lake Baikal at −12 h ()). Due to the rapid development of cold advection, cold air intrudes into the northwest of China. The WPSH extends to 112°E. It is also important to note that the STR is located on the north side of the typhoon, which inhibits the northward movement of Vicente. At 0 h of RI ()), the Lake Baikal cold vortex and trough line move eastwards, while the STR is stable.
At 850 hPa, the water vapor channel of Vicente is basically the same as that of Mujigae. There are two obvious water vapor passages on the southwest and east side of Vicente, which provide sufficient water vapor conditions for the development of Vicente. Prior to and at the onset of the RI of Vicente (), the warm moisture flow from the Bay of Bengal produces a rich stream of water vapor for Vicente. The relative humidity near the TC center exceeds 90%, which is conducive to the intensity of Vicente.
By comparing the environmental field conditions of the two typhoons, we can see a considerable difference before and at onset of RI. It should be pointed out that there is an upper-tropospheric IT near Vicente, with a probable close relationship because of its near proximity, directly affecting the outflow mode. In view of whether there is an upper-tropospheric IT before and after the RI of the typhoon, the similarities and differences between the processes and mechanisms of RI are worth exploring.
4. Upper-tropospheric trough interaction prior to and during RI
Due to EFC that has been used successfully in previous studies of trough interactions (Molinari and Vollaro Citation1989; DeMaria, Baik, and Kaplan Citation1993; Hanley Citation2002), we will focus on contributions by upper-tropospheric trough and the large-scale environment to the RI based on the EFC.
4.1. Eddy momentum flux convergence
The definition of eddy momentum flux convergence (EFC) is the same as in DeMaria, Baik, and Kaplan (Citation1993). Positive values of EFC commonly means the approach of a low-value system (here, an upper-tropospheric IT) to the TC and ensure that azimuthal eddies are acting to increase mean angular momentum in the outflow layer.
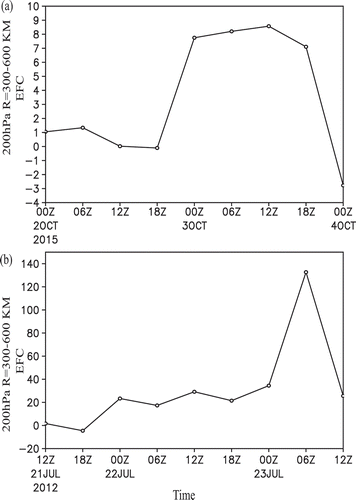
The evolutions of EFC for the two cases at 200 hPa are shown in . DeMaria, Baik, and Kaplan (Citation1993) defined a moderate/strong trough interaction as having EFC of about 10–20 m s−1 d−1/>20 m s−1 d−1. Based on these thresholds, no significant interaction occurs between the upper-level tough and the TC circulation, because the EFC within radii of 300–600 km is less than 10 m s−1 d−1 ()) before RI. Thus, EFC does not provide a useful clue as to the RI of Mujigae, albeit the EAT is strong but far from the TC. The EFC value of Vicente, plotted in ), indicates the occurrence of a strong interaction beginning at 0000 UTC 22 July, with a sharp increase just at the onset time of RI, and climbing to peak values exceeding 130 m s−1 d−1 within 6 h. It suggests that the upper-tropospheric IT plays an important role in the RI process of Vicente.
Figure 3. Time series of EFC (units: m s−1 d−1) at 200 hPa, calculated over radii of 300–600 km: (a) Mujigae; (b) Vicente.
4.2. Upper-tropospheric PV
PV provides a more concise dynamical framework for examining the interactions between the PV reservoir and upper-tropospheric PV anomaly. In this study, Ertel isentropic PV is calculated at the 350-K level (about 200 hPa), following Hoskins, McIntyre, and Robertson (Citation1985).
show the distributions of PV and streamlines at the 350-K isentropic surface for Mujigae, before onset of RI, 12 h and 6 h before, and 0 h and 6 h into RI. ) show the PV anomalies of Mujigae, demonstrating that those nearby were not influenced by synoptic-scale PV advection originated from the upper-tropospheric trough before and after the RI process. At 12 h and 6 h prior to RI (), there is no PV anomaly near the center of Mujigae. At RI onset ()), only an isolated upper-tropospheric positive PV anomaly center is located near Mujiage (in order to better show the upper-tropospheric positive PV anomaly, we present an enlarged diagram of ) in )). The poleward-outflow branch north of the TC () blocks the PV transport pathway from the high-PV reservoir of the environmental field north of 30°N (). The destruction of the upper-tropospheric PV anomaly is a symptom of the onset of RI. As the PV anomaly gets close to the TC center it is annihilated by diabatic heating associated with condensation in updrafts near the TC center (Ventham and Wang Citation2007). During RI, the PV anomaly weakens rapidly during RI ()).
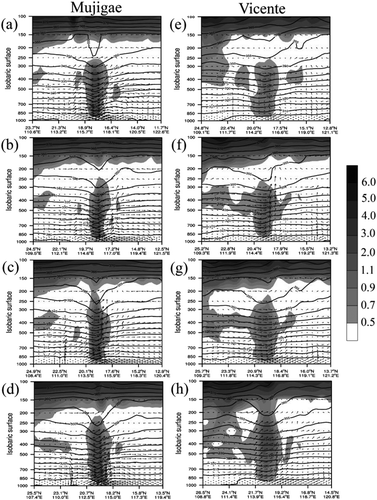
Figure 4. The PV (shaded; units: PVU) and streamlines at 350 K for Typhoon Mujigae, relative to the onset of RI at (a) −12h, (b) −6 h, (c) 0 h and (d) +6 h. Panels (e–h) are the same as (a–d) but for Typhoon Vicente. The red typhoon symbol denotes the TC center at the surface level. The purple lines denote the locations of the vertical cross section used in . (i) Enlarged diagram of the area marked in (c) by the red box, showing the upper-tropospheric PV anomaly near the TC circulation.
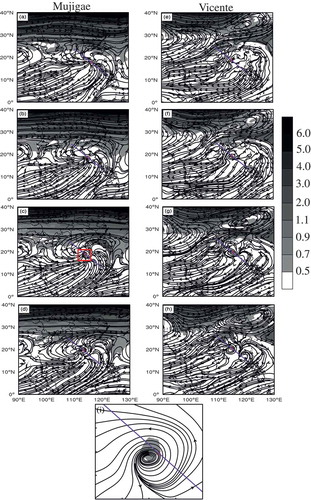
Figure 5. Vertical cross section through the center of Typhoon Mujigae and Vicente along the purple line in . The PV (shaded; units: PVU) is shaded and isentropes (units: K) are contoured. Relative to the onset of RI at (a) −12h, (b) −6 h, (c) 0 h, and (d) +6 h. Panels (e–h) are the same as (a–d).
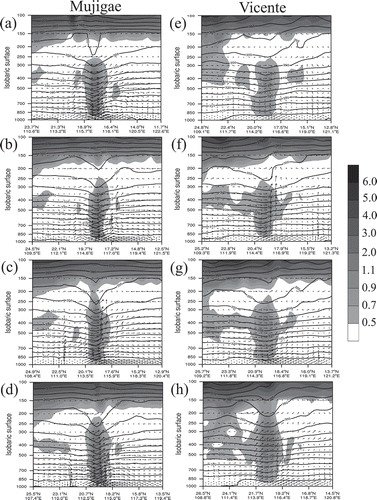
–h) show that the time series of the PV and streamlines at 350 K for Vicente, with the same relative time periods as for the RI of Mujigae. Through the evolution of the upper-tropospheric IT, whose main axis tilts in a northeast–southwest direction, Vicente moves slightly eastwards (). At 12 h prior to RI ()), a PV value exceeding 0.5 PVU is within 500 km of the lower-level circulation. After 6 h ()), a PV anomaly exceeding 0.5 PVU is within 300 km of the TC circulation. As RI begins ()), the PV anomaly near the TC circulation rapidly dissipates. During RI ()), only a small portion of the PV anomaly approaching the TC resembles the picture of interaction between an upper-tropospheric IT and TC Nelson (1985), plotted by Ventham and Wang (Citation2007). –d) depict the evolution of a vertical cross section of PV at the 350-K isentropic surface along the purple line shown in , respectively. At 12 h and 6 h prior to RI (,b)), there is no positive PV anomaly values near the TC circulation in excess of 0.5 PVU located in the upper troposphere (200–250 hPa). At onset of RI ()), the PV values in excess of 0.5 PVU extend upwards to near 200 hPa as a result of the upper-tropospheric PV anomaly, which is caused by the strong updraft from the upper to the middle troposphere, which is also conducive to the RI of the typhoon (Tang et al. Citation2018). Meanwhile, the positive mid-upper-level PV values in excess of 1.1 PVU extend upwards to near 275 hPa. During RI ()), the positive mid-upper-level PV weakens rapidly, along with the development of high PV in the lower levels associated with the rapidly developing Mujigae.
–h) depict the evolution of a cross section of PV at 350 K along the purple line of –h), respectively. At 12 h prior to RI ()), the PV advection values in excess of 0.5 PVU extend downwards to near 450 hPa, approaching Typhoon Vicente but not directly crossing the storm. Within the following 12 h (,g)), the PV anomaly band directly cuts through the storm from the middle troposphere. During RI ()), the 0.5-PVU contourfrom the upper-tropospheric PV reservoir and Vicente connect throughout the troposphere. It is at, or shortly after, this time that the eyewall develops.
By comparing the vertical distribution of Mujigae with that of Vicente, it is not difficult to find that a nearly isolated PV column stands in the inner-core region of Mujigae before and after the onset of RI (,b,d)). Except at the onset time, a strong updraft cuts through the vertical channel between the TC system and upper-tropospheric high-PV reservoir ()). However, for Vicente, the northwestward inflow along the IT ( and 5(e–h)) keeps advecting high-PV air from high-latitude areas during the overall stage. Even a double channel for PV transport is turned on ()), with one from northwest of the middle troposphere and another from the upper troposphere.
4.3. Possible mechanism by which the upper-tropospheric IT causes the RI of vicente
The mechanism of the upper-tropospheric IT causeing the RI of Vicente is considered from three aspects. Firstly, the upper-tropospheric IT is obviously enhanced (and maintained) before (and during) the RI of Vicente (), which provides some predictive clue (and diagnostic sense) for RI. The northeast flow in front of the upper-tropospheric IT increases the westward outflow of Vicente, which is conducive to accelerating the removal of the upper-level mass field and thus strengthening the secondary (in–up–out) circulation, enhancing the TC primary circulation (Chen et al. Citation2017). Secondly, the EFC index, which can embody the trough–TC interaction, is evaluated using the flux convergence of angular momentum by azimuthal eddies (Pfeffer and Challa Citation1981; Holland and Merrill Citation1984; Molinari and Vollaro Citation1989). Positive values of EFC commonly mean the approach of a low-value system (here, an upper-tropospheric IT) to the TC and ensure that azimuthal eddies are acting to increase the mean angular momentum in the outflow layer (Hanley, Molinari, and Keyser Citation2001). If EFC(R=300–600 km) is positive, it represents the transport of angular momentum from 600 km to 300 km. According to DeMaria, Baik, and Kaplan (Citation1993), as the EFC is >20 m s−1 d−1, a strong trough interaction presents. From our case study, the values of EFC(R=300–600 km) exceeding 20 m s−1 d−1 occur before and during the RI of Vicente, which indicates a strong interaction between the upper-tropospheric IT and Typhoon Vicente. Thus, the angular momentum is transferred from 600 km to 300 km, which is conducive to the strengthening of the secondary circulation of the TC by increased upper-level outflows, especially on the azimuthal side close to the approaching trough, which is beneficial for the RI process of Vicente. Finally, –h) show that the upper-tropospheric IT helps to transport the high environmental PV from both the upper-level and high-latitude PV reservoir to Vicente, which would have contributed to the RI of the TC (Bosart et al. Citation2000; Ventham and Wang Citation2007).
5. Conclusion
By using GFS 0.5° reanalysis data, the atmospheric circulation conditions of Mujigae and Vicente were diagnosed and analyzed, and the following conclusions were obtained:
The intensity of Mujigae and Vicente was almost the same before and after the RI process. Despite similar RI rates for the two typhoons, considerable differences in the synoptic-scale environment were present. No significant interaction occurred between the upper-tropospheric tough and Mujigae’s circulation, while strong interaction occurred prior to the RI for Vicente, suggesting the upper-tropospheric IT played an important role in the RI process of Vicente.
The interaction between the upper-tropospheric IT and Vicente was estimated by calculating the EFC. The values of EFC exceeding 20 m s−1 d−1 occurred before and during the RI of Vicente, indicating strong interaction between the upper-tropospheric IT and Typhoon Vicente.
The trough–typhoon interaction was examined by comparing the PV transport processes of the two cases. An isolated upper-tropospheric positive PV column in excess of 0.5 PVU was located near Mujigae’s onset of RI, which was not influenced by synoptic-scale PV advection. However, for Vicente, the upper-tropospheric IT helped transport the high environmental PV from the upper-level and high-latitude PV reservoir to Vicente, which contributed to the RI of the TC.
Supplemental Material
Download PDF (313.9 KB)Acknowledgments
The valuable comments of the three anonymous reviewers, which helped considerably in improving the original manuscript, are greatly appreciated.
Disclosure statement
No potential conflict of interest was reported by the authors.
Supplemental material
Supplemental data for this article can be accessed here.
Additional information
Funding
Related Research Data
References
- Bosart, L. F., C. S. Velden, W. E. Bracken, J. Molinari, and P. G. Black. 2000. “Environmental Influences on the Rapid Intensification of Hurricane Opal (1995) over the Gulf of Mexico.” Monthly Weather Review 128: 322–352. doi:10.1175/1520-0493(2000)128<0322:EIOTRI>2.0.CO;2.
- Chen, X. M., Y. Wang, K. Zhao, and D. Wu. 2017. “A Numerical Study on Rapid Intensification of Typhoon Vicente (2012) in the South China Sea. Part I: Verification of Simulation, Storm-Scale Evolution, and Environmental Contribution.” Monthly Weather Review 145 (3): 877–898. doi:10.1175/MWR-D-16-0147.1.
- CMA. 2012. “Member Report: China.” China Meterelogical Agency. Retrieved November 26: 13–15.
- DeMaria, M., J. J. Baik, and J. Kaplan. 1993. “Upper-Level Eddy Angular Momentum Fluxes and Tropical Cyclone Intensity Change.” Journal of the Atmosphere Science 50: 1133–1147. doi:10.1175/1520-0469(1993)050<1133:ULEAMF>2.0.CO;2.
- DeMaria, M., C. R. Sampson, J. A. Knaff, and K. D. Musgrave. 2014. “Is Tropical Cyclone Intensity Guidance Improving?” Bulletin of the American Meteorological Society 95 (3): 387–398. doi:10.1175/BAMS-D-12-00240.1.
- Franklin, J. L., R. J. Pasch, L. A. Avila, J. L. Beven, M. B. Lawrence, S. R. Stewart, and E. S. Blake. 2006. “Atlantic Hurricane Season of 2004.” Monthly Weather Review 134 (3): 981–1025. doi:10.1175/MWR3096.1.
- Hanley, D., J. Molinari, and D. Keyser. 2001. “A Composite Study of the Interactions between Tropical Cyclones and Upper Tropospheric Troughs.” Monthly Weather Review 129: 2570–2584. doi:10.1175/1520-0493(2001)129<2570:ACSOTI>2.0.CO;2.
- Hanley, D. E. 2002. “The Evolution of a Hurricane–Trough Interaction from a Satellite Perspective.” Weather and Forecasting 17 (4): 916–926. doi:10.1175/1520-0434(2002)017<0916:TEOAHT>2.0.CO;2.
- Holland, G. J., and R. T. Merrill. 1984. “On the Dynamics of Tropical Cyclone Structural Changes.” Quarterly Journal of the Royal Meteorological Society 110: 723–745. doi:10.1002/(ISSN)1477-870X.
- Hoskins, B. J., M. E. McIntyre, and A. W. Robertson. 1985. “On the Use and Significance of Isentropic Potential Vorticity Maps.” Quarterly Journal of the Royal Meteorological Society 111: 877–946. doi:10.1002/qj.49711147002.
- Kaplan, J., and M. DeMaria. 2003. “Large-Scale Characteristics of Rapidly Intensifying Tropical Cyclones in the North Atlantic Basin.” Weather Forecasting 18: 1093–1108. doi:10.1175/1520-0434(2003)018<1093:LCORIT>2.0.CO;2.
- Kimball, S. K., and J. L. Evans. 2002. “Idealized Numerical Simulations of Hurricane–Trough Interaction.” Monthly Weather Review 130 (9): 2210–2227. doi:10.1175/1520-0493(2002)130<2210:INSOHT>2.0.CO;2.
- Molinari, J., and D. Vollaro. 1989. “External Influences on Hurricane Intensity. Part I: Outflow Layer Eddy Momentum Fluxes.” Journal of the Atmosphere Science 46: 1093–1105. doi:10.1175/1520-0469(1989)046<1093:EIOHIP>2.0.CO;2.
- Pfeffer, R. L., and M. Challa. 1981. “A Numerical Study of the Role of Eddy Fluxes of Momentum in the Development of Atlantic Hurricanes.” Journal of the Atmosphere Scienc 38: 2393–2398. doi:10.1175/1520-0469(1981)038<2393:ANSOTR>2.0.CO;2.
- Rappaport E. N., J. L. Franklin, L. A. Avila, S. R. Baig, L. J. Beven, E. S. Blake, C. A. Burr, et al. 2009. “Advances and Challenges at the National Hurricane Center”. Weather and Forecasting 24: 395–419. doi:10.1175/2008WAF2222128.1.
- Shi, J. J., S. Chang, and S. Raman. 1997. “Interaction between Hurricane Florence (1988) and an Upper-Tropospheric Westerly Trough.” Journal of the Atmosphere Science 54: 1231–1247. doi:10.1175/1520-0469(1997)054<1231:IBHFAA>2.0.CO;2.
- Shieh, O. H., M. Fiorino, M. E. Kucas, and B. Wang. 2013. “Extreme Rapid Intensification of Typhoon Vicente (2012) in the South China Sea.” Weather and Forecasting 28 (6): 1578–1587.
- Tang, X. B., F. Ping, S. Yang, M. X. Li, and J. Peng. 2018. “Relationship between Convective Bursts and the Rapid Intensification of Typhoon Mujigae (2015).” Atmosphere Science Letter 19: e811. doi:10.1002/asl.811.
- Ventham, J. D., and B. Wang. 2007. “Large-Scale Flow Patterns and Their Influence on the Intensification Rates of Western North Pacific Tropical Storms.” Monthly Weather Review 135 (3): 1110–1127. doi:10.1175/MWR3327.1.