
ABSTRACT
The combined effect of the Pacific–Japan (PJ) pattern and Mediterranean–northern Eurasia (MnE) pattern on East Asian surface air temperature (SAT) during summer is investigated using the Japanese 55-year reanalysis and Climatic Research Unit SAT data over the period of 1958–2016. The results show that the combination of the two patterns in different phases can result in different SAT anomalies. During the in-phase PJ-MnE years, the overlapping of opposite signs of the atmospheric circulations associated with the PJ and MnE patterns results in weak atmospheric circulation and SAT anomalies in central East Asia; during these years, the significant SAT anomalies are over northern East Asia. In contrast, during the out-of-phase PJ-MnE years, the overlapping of the same signs of the atmospheric circulations associated with the PJ and MnE patterns leads to significant atmospheric circulation and SAT anomalies in central East Asia and northern Asia. The analysis in this study indicates that to better understand and predict the variability of East Asian summer SATs, the combined effect of the PJ and MnE patterns should be taken into account.
GRAPHICAL ABSTRACT
摘要
本文研究发现太平洋–日本遥相关型(PJ)和地中海–欧亚北部遥相关型(MnE)对东亚夏季气温存在显著的协同影响。当PJ和MnE处于同位相时,两者相关的大气环流在东亚中部地区相互叠加抵消,从而对该地区气温的影响较弱,而此时显著的气温异常主要位于东亚北部。相反,当PJ和MnE处于反位相时,两者相关的大气环流在东亚地区相互叠加增强,从而对东亚中部和亚洲北部地区的气温产生显著影响。因此,在东亚夏季气温变化的理解与预测中需要考虑这两个遥相关的协同作用。
1. Introduction
Previous studies have shown that East Asian summer surface air temperature (SAT) is controlled by various local atmospheric circulations: the western Pacific subtropical high (Cui et al. Citation2007; Wang et al. Citation2016; Gao et al. Citation2018), the upper-level westerly jet (Lu, Lin, and Zhang Citation2013; Sun Citation2014; Lin et al. Citation2018), and the Okhotsk high (Ninomiya and Mizuno Citation1985; Sato and Takahashi Citation2007). The combination of these large-scale atmospheric circulations can be represented by the Pacific–Japan (PJ) teleconnection pattern (Choi, Wu, and Cha Citation2010). Therefore, the PJ pattern (Nitta Citation1987, Citation1989) or East Asia–Pacific pattern (Huang and Sun Citation1992), is the dominant atmospheric mode, having considerable impact on summer rainfall and temperature over the region (e.g. Huang and Sun Citation1992; Wakabayashi and Kawamura Citation2004; Yasunaka and Hanawa Citation2006; Kosaka et al. Citation2013). In addition to exerting a direct impact, the PJ pattern also serves as a bridge to transport other remote factors of influence to East Asia. For example, the effects of ENSO and Indian Ocean SST on the East Asian summer climate are related to the PJ pattern (Huang et al. Citation2004; Sun et al. Citation2010; Kosaka et al. Citation2013; Xie et al. Citation2016).
Although these previous studies have indicated that the PJ pattern exerts a dominant impact on the East Asian summer climate, which further helps to improve the prediction of the East Asian summer climate, in some years an anomalous PJ pattern does not lead to anomalous East Asian summer climate (e.g. Hsu and Lin Citation2007; Ogasawara and Kawamura Citation2007), which indicates that there could be some other factors balancing the impact of the PJ pattern on East Asian summer climate.
The East Asian summer climate is not only directly impacted by the PJ-like meridional teleconnection pattern, but also influenced by the zonal teleconnection pattern over Eurasia (e.g. Wu Citation2002; Lu, Oh, and Kim Citation2002; Enomoto Citation2004; Ding and Wang Citation2005; Huang, Liu, and Huang Citation2011; Huang, Liu, and Feng Citation2013; He, Liu, and Wang Citation2017; Wang et al. Citation2017). For the Eurasian zonal teleconnection pattern, the Mediterranean region is special because of its location over the entrance of the Eurasian upper-level westerly jet. Dynamics-based studies have indicated that the upper-level westerly jet is the Rossby waveguide, determining the wave train propagation (e.g. Hoskins and Ambrizzi Citation1993; Ambrizzi, Hoskins, and Hsu Citation1995; Sato and Takahashi Citation2006; Lin et al. Citation2018). Therefore, when the summer North Atlantic Oscillation (SNAO) pattern shifts eastward with the southern center covering the Mediterranean region, it can excite a wave train pattern to propagate eastward and impact the East Asian summer climate (Sun, Wang, and Yuan Citation2008; Yuan and Sun Citation2009; Sun and Wang Citation2012). Sun and Ming (Citation2018) further found that such an SNAO-related zonal teleconnection pattern can modulate the impact of some factors on the East Asian summer climate. Because the NAO generally indicates the meridional dipole pattern over the North Atlantic region, the SNAO-related zonal teleconnection pattern over the Eurasian Continent is named the Mediterranean–northern Eurasian (MnE) pattern. This zonal teleconnection pattern propagates northeastward from the Mediterranean region along a large circular pathway to northern Eurasia and then southeastward to East Asia (e.g. Sun, Wang, and Yuan Citation2008; Sun and Wang Citation2012; Sun et al. Citation2018). Therefore, to better understand the summer climate variability over East Asia, the combined impact of the PJ and SNAO-related MnE patterns on the East Asian summer atmospheric circulation and SAT are explored.
2. Data and methods
The datasets used here are as follows: (1) the atmospheric data are derived from the Japanese 55-year reanalysis (JRA-55) (Kobayashi et al. Citation2015), which has a horizontal resolution of 1.25° × 1.25°; (2) the SAT data are obtained from the Climate Research Unit TS4 dataset (CRU) (Harris et al. Citation2014), gridded at a 0.5°×0.5° resolution. The analysis period is 1958–2016.
The PJ index is defined based on previous studies (Wakabayashi and Kawamura Citation2004; Kawamura and Ogasawara Citation2006) as the difference in the 850-hPa geopotential height anomalies between two grid points ((40°N, 150°E) and (25°N, 125°E)) during summer. In addition, the SLP over the Mediterranean region (30°–50°N, 0°–30°E) is referred to as an index to describe the MnE variability, based on previous studies (Sun, Wang, and Yuan Citation2008; Sun and Wang Citation2012).
3. Individual influences of the PJ and MnE patterns on East Asian summer SAT
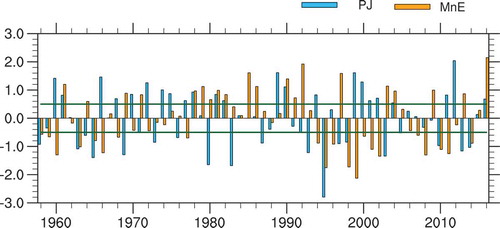
As shown in , the PJ and MnE indices show strong interannual variability. During the period 1958–2016, the correlation coefficient between these two indices is low, with a value of −0.08. This result indicates that the PJ pattern and MnE pattern are orthogonal to each other and exert independent influence on East Asian summer SAT variability.
Figure 1. Normalized time series of the PJ and MnE indices during summer over the period 1958–2016. Solid lines indicate the +0.5/−0.5 standard deviations.
shows the atmospheric circulation pattern regressed against the PJ and MnE index, respectively. As shown in , according to the positive PJ pattern, there is a meridional tripole pattern along the East Asian coast, with two significant negative centers over low and high latitudes and a positive center over midlatitudes. The tripole pattern exhibits a quasi-barotropic structure, with a slight northward tilt with height (Yasunaka and Hanawa Citation2006). Positive/negative geopotential heights are generally related to sunny/cloudy weather, increasing/decreasing insolation at the ground ()), and consequently favor local warming/cooling of SAT over East Asia, respectively (Kubota, Kosaka, and Xie Citation2016; Sun, Wang, and Yuan Citation2011). In addition, the atmospheric dynamics can also change the SAT. Generally, a cyclone/anticyclone favors/prohibits cold-air activity, and therefore the anomalous cyclones/anticyclones in are related to the cold/warm regions in . Therefore, both the radiation and dynamics associated with the positive PJ pattern result in a significant warming over Northeast China and Japan, and a cooling over northern East Asia ()). Such anomalous atmospheric and SAT distributions are consistent with those in previous studies (Nitta Citation1987; Wakabayashi and Kawamura Citation2004; Huang Citation2004).
Figure 2. Regressed geopotential height (shading; units: gpm) and wind (vectors; units: m s−1) anomalies at (a) 850 hPa, (b) 500 hPa, and (c) 200 hPa against the PJ index during summer over the period 1958–2016. (d–f) As in (a–c) but against the MnE index. The dotted areas are geopotential height anomalies significant at the 95% confidence level. Arrows are the wind anomalies significant at the 95% confidence level. The green box in Figure 2(d) represents the domain used to define the MnE index.
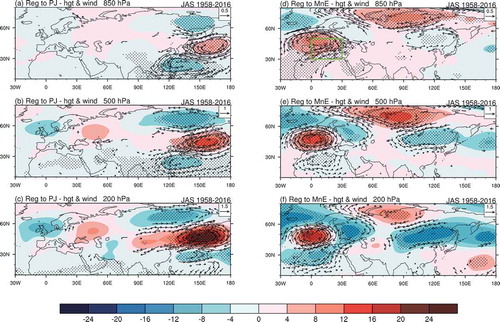
Figure 3. Regression maps of the total radiation flux (units: W m−2) against the (a) PJ and (b) MnE indices during summer over the period 1958–2016. (c, d) As in (a, b) but for the SAT (units: °C). The dotted areas are significant at the 95% confidence level.
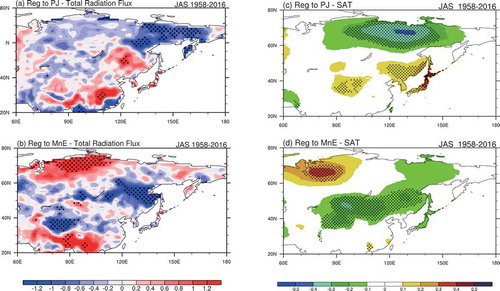
The MnE-related atmospheric circulations are displayed in . There is a wave train pattern along the large circular pathway over the mid-to-high latitudes of the Eurasian continent. The wave activity flux indicates that such a wave train pattern propagating eastward from the Mediterranean region to East Asia (figure not shown) results in significant negative geopotential height anomalies over central East Asia and positive geopotential height anomalies over northern Eurasia along the coasts of the Kara Sea and Laptev Sea. Influenced by such atmospheric circulations, the radiation flux anomalies show two large significant centers ()): the positive center is over northern Eurasia under the anomalous positive geopotential height, and the negative center is observed over central East Asia under the anomalous negative geopotential height, which is similar to the SAT pattern ()). However, the MnE-related significant SAT region over central East Asia ()) is larger than its related significant radiation flux region ()), extending more southwestward to northern China and Mongolia ()). The dynamical process of the MnE-related atmosphere circulation could play an important role in the formation of such an SAT pattern. The anomalous cyclone over central East Asia brings cold air from high latitudes, therefore favoring the cold-air activity and contributing to the cooling over central East Asia, including northern China and Mongolia. In addition, previous studies (e.g. Ding and Wang Citation2005; Sato and Takahashi Citation2006; Sun, Wang, and Yuan Citation2008; Sun Citation2014; Chen et al. Citation2016; Lin et al. Citation2018) have suggested that the upper-level westerly jet plays an important role in the local SAT variability. The easterly anomalies over northern Asia (around 60°N) weaken the polar westerly jet (), also favoring the southward invasion of cold air from high latitudes. Therefore, although the significant radiation flux anomalies are located mainly over Northeast China, the atmospheric dynamics makes the cold air invade northern China and Mongolia, resulting in a significant cold zonal belt over central East Asia. Such atmospheric and SAT patterns are also consistent with those in previous studies (Yuan and Sun Citation2009; Sun and Wang Citation2012; Sun et al. Citation2018).
The variabilities in the PJ pattern and MnE pattern are independent of each other, which is reflected by the low correlation coefficient between the two indices. The spatial distribution of the atmospheric circulation anomalies related to the PJ and MnE patterns shows substantial differences over the Eurasian region (). However, these two pattern-related atmospheric circulation and SAT anomalies overlap over central and northern East Asia. Therefore, it is natural to ask what the impact is of the two-pattern combination on atmospheric circulation and SAT over East Asia. We address this question in the following section.
4. Combined impact of the PJ pattern and MnE on East Asian summer SAT
To investigate the combined effect of the PJ pattern and MnE pattern, depending on their different phases, the analyzed years are categorized into four groups () based on criteria with indices greater/less than +0.5/−0.5 standard deviations. Because the composite anomalies of the atmospheric circulation and SAT in +PJ/+MnE (+PJ/−MnE) years are similar to those in −PJ/−MnE (−PJ/+MnE) years, except with opposite sign, the composite differences between the +PJ/+MnE and −PJ/−MnE (+PJ/−MnE and −PJ/+MnE, respectively) are displayed in the following section to reflect the in-phase (out-of-phase) impact of the combination of the PJ and MnE patterns.
Table 1. List of +PJ/+MnE, +PJ/−MnE, −PJ/+MnE, and −PJ/−MnE years over the period 1958–2016.
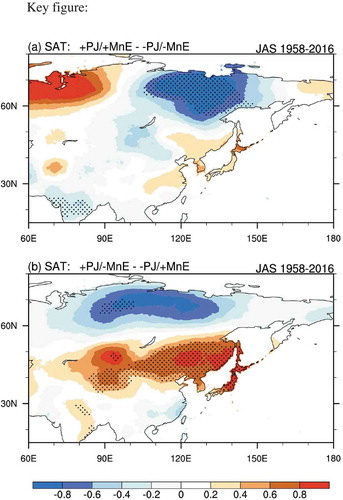
shows the composite difference in the atmospheric circulations during the in-phase and out-of-phase PJ-MnE years, respectively. During the in-phase years (), the positive-phase PJ and MnE patterns are still over the Eurasian continent and western North Pacific, showing a barotropic structure. However, compared to the individual positive-phase PJ and MnE patterns in , the larger differences in the atmospheric circulations are over central to northern East Asia. The positive-phase MnE pattern can result in a significant negative geopotential height anomaly over central East Asia between 40°N and 60°N ()). However, the positive-phase PJ pattern can result in a significant positive geopotential height anomaly over central East Asia between 35°N and 50°N and a negative geopotential height anomaly over northern East Asia north of 60°N ()). Therefore, during the in-phase PJ-MnE years, the destructive superposition of the opposite-sign height anomalies related to the PJ and MnE results in a weaker positive geopotential height anomaly over central East Asia (). Also, the weak geopotential height over central East Asia during the in-phase PJ-MnE years is related to the weak warm SAT anomaly over the region ()). In addition, the MnE-related negative geopotential height anomaly over central East Asia can induce the PJ-related negative geopotential high anomaly over northern East Asia extending southward; therefore, during the in-phase PJ-MnE years, the negative geopotential height anomaly center over northern East Asia ()) extends further southward than that during anomalous PJ years ()). Such anomalous atmospheric circulation results in a southward-extended cold SAT center over northern East Asia ()) compared to that during anomalous PJ years ()). Therefore, during the in-phase PJ-MnE years, there is a weak SAT signal over central East Asia and an extended significant SAT signal over northern East Asia.
Figure 4. Composite differences in the geopotential height (units: gpm) and wind (vectors; units: m s−1) at (a) 850 hPa, (b) 500 hPa, and (c) 200 hPa between the +PJ/+MnE and −PJ/−MnE years during summer over the period 1958–2016. (d–f) As in (a–c) but between the +PJ/−MnE and +PJ/−MnE years. The dotted areas are geopotential height anomalies significant at the 95% confidence level. Arrows are the wind anomalies significant at the 95% confidence level.
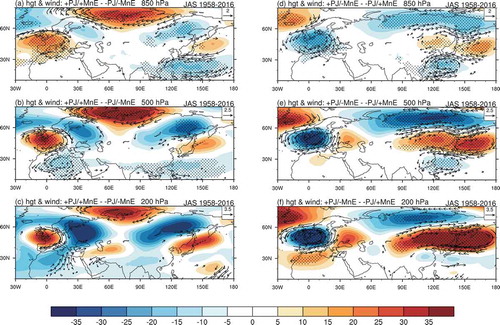
Figure 5. Composite differences in the SAT (units: °C) (a) between the +PJ/+MnE and −PJ/−MnE years and (b) between the +PJ/−MnE and −PJ/+MnE years during summer over the period 1958–2016. The dotted areas are significant at the 95% confidence level.
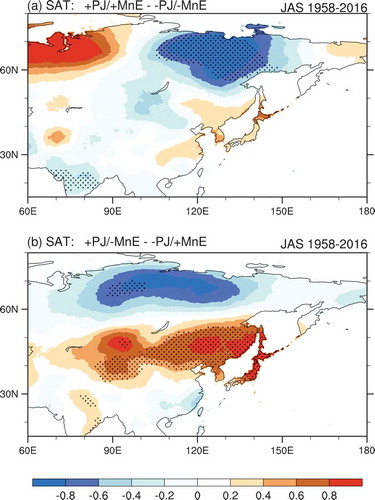
) show the composite difference in the atmospheric circulation during the out-of-phase PJ-MnE years. Compared to the individual PJ and MnE years, the large differences in the atmospheric circulations are also located over central to northern East Asia. First, the negative-phase MnE-related positive geopotential height anomalies overlap with the positive-phase PJ-related positive geopotential height anomalies over central East Asia. The constructive overlap of the geopotential heights with the same sign results in significant positive geopotential height anomalies over central East Asia. Second, the negative geopotential height anomalies along the coast of the Kara Sea and Laptev Sea associated with the negative MnE pattern can induce the westward extension of the positive-phase PJ-related negative geopotential height anomalies over northern East Asia, resulting in a negative zonal belt over northern Asia. Therefore, during out-of-phase PJ-MnE years, the SAT anomalies show a warm zonal belt over central East Asia and a negative zonal belt over northern Asia ()).
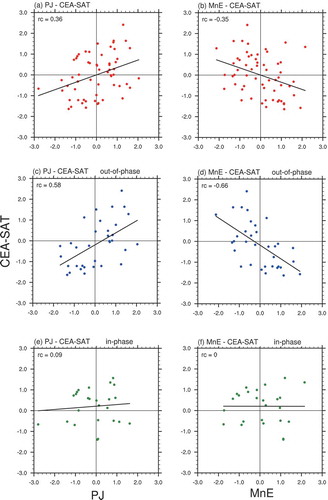
The analysis indicates that the central East Asia SAT is sensitive to the combination of the PJ and MnE patterns. The in-phase (out-of-phase) combination of the two patterns can weaken (strengthen) SAT anomalies over this region. Therefore, to quantitively explore the combined impact of the PJ and MnE patterns on East Asian SATs, the central East Asian SAT is selected. The central East Asian SAT (CEA-SAT) index is defined as the SAT averaged within (40°–50°N, 110°–150°E).
) are scatterplots of the PJ index and MnE index versus the CEA-SAT index during 1958–2016. The results suggest a positive correlation between the PJ pattern and central East Asian SAT and a negative correlation between the MnE pattern and central East Asian SAT, with correlation coefficients of 0.36 and −0.35, respectively, which are both significant at the 99% confidence level. However, the high correlations of the PJ and MnE patterns with CEA-SAT are mainly due to their covariability during the out-of-phase PJ-MnE years. As shown in ), during the years when the PJ index has the opposite sign to the MnE index, the correlation coefficient between the PJ and CEA-SAT indices reaches 0.58, and the correlation coefficient between the MnE and CEA-SAT indices reaches −0.66; both are significant at the 99% confidence level. In contrast, during in-phase PJ-MnE years (), the correlations of the PJ and MnE patterns with CEA-SAT become weak, with values of 0.09 and 0.00, respectively. The analysis of the scatterplots further implies the importance of the PJ-MnE combined impact on East Asian SAT variations.
Figure 6. Scatterplots of the CEA-SAT versus the (a) PJ and (b) MnE indices during summer over the period 1958–2016. (c, d) as in (a, b) but for out-of-phase PJ-MnE years, respectively. (e, f) as in (a, b) but for in-phase PJ-MnE years, respectively.
5. Summary
The PJ pattern is the dominant mode over East Asia and has a profound and direct impact on the East Asian summer climate (e.g. Nitta Citation1987; Huang and Sun Citation1992; Huang Citation2004; Yasunaka and Hanawa Citation2006; Kosaka et al. Citation2013). In addition, the PJ pattern also serves as a link to connect the high predictability of the tropical system with the East Asian climate, consequently contributing to East Asian summer climate prediction (e.g. Huang et al. Citation2004; Wang and Fan Citation2009; Xie et al. Citation2016). Therefore, the PJ pattern is important for East Asian summer climate variability and prediction. On the other hand, an anomalous PJ pattern does not always result in an anomalous summer climate over East Asia, possibly because of the balancing effect of other factors on the East Asian summer climate. Therefore, in this study, the combined effect of the PJ pattern and MnE pattern on East Asian atmospheric circulation and SAT in summer is analyzed.
The positive-phase PJ pattern shows a meridional wave train pattern, with positive (negative) geopotential height anomalies over central (northern) East Asia, which generally leads to a warm center over central East Asia and a cold center over northern East Asia. The positive-phase MnE pattern shows a zonal wave train over the Eurasian continent, with positive (negative) geopotential height anomalies over central East Asia. Therefore, during the in-phase PJ-MnE years, the MnE-related negative geopotential height anomalies can weaken the PJ-related positive geopotential height anomalies over central East Asia and induce the southward extension of PJ-related negative geopotential height anomalies over northern East Asia. Such atmospheric anomalies favor a weak SAT signal over central East Asia and a significant southward extension of the SAT signal over northern East Asia during in-phase PJ-MnE years. On the other hand, during out-of-phase PJ-MnE years, the same sign for the geopotential height anomalies associated with the PJ and MnE patterns can result in a significant dipole in the geopotential height anomaly zonal belt over central East Asia and northern Asia. Consequently, during the out-of-phase PJ-MnE years, there are opposite and significant SAT anomaly zonal belts over central East Asia and northern Asia. The atmospheric patterns generally have interannual and decadal variability; the results in this study mainly reflect the interannual variability, because the analysis on the nine-year high-pass-filtered data obtains similar results (figure not shown).
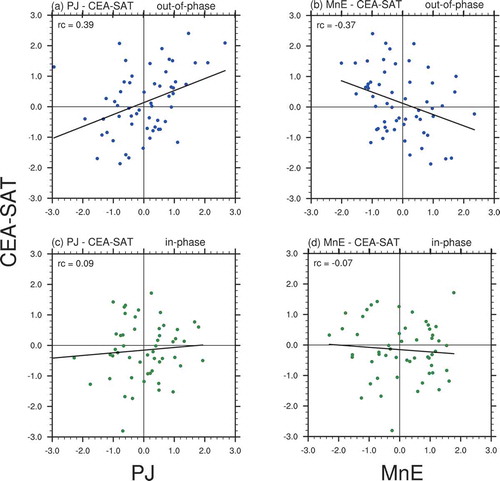
To confirm the robustness of the combined effect of the PJ and MnE patterns on East Asian atmospheric circulation and SAT in summer, the ERA-20C (Poli et al. Citation2016) and CRU SAT data over the period 1901–2010 are used. The long-term data analysis further confirms that the combination of the PJ and MnE during different phase years can result in different anomalous SAT over East Asia (), which is highly consistent with the results obtained from the past half century. The analysis in this study indicates that the combined effect of the PJ and MnE patterns is necessary to better understand and predict East Asian summer atmospheric circulation and SAT variability.
Figure 7. Scatterplots of the CEA-SAT versus the (a) PJ and (b) MnE indices during summers in out-of-phase PJ-MnE years over the period 1901–2010 using ERA-20C SLP and CRU SAT data. (c, d) as in (a, b) but for in-phase PJ-MnE years, respectively.
Disclosure statement
No potential conflict of interest was reported by the authors.
Additional information
Funding
References
- Ambrizzi, T., B. J. Hoskins, and H. H. Hsu. 1995. “Rossby Wave Propagation and Teleconnection Patterns in the Austral Winter.” Journal of the Atmospheric Sciences 52: 3661–3672. doi:10.1175/1520-0469(1995)052<3661:RWPATP>2.0.CO;2.
- Chen, W., X. W. Hong, R. Y. Lu, A. F. Jin, S. Z. Jin, J. Nam, J. H. Shin, T. Goo, and B. Kim. 2016. “Variation in Summer Surface Air Temperature over Northeast Asia and Its Associated Circulation Anomalies.” Advances in Atmospheric Sciences 33: 1–9. doi:10.1007/s00376-015-5056-0.
- Choi, K. S., C. C. Wu, and E. J. Cha. 2010. “Change of Tropical Cyclone Activity by Pacific‐Japan Teleconnection Pattern in the Western North Pacific.” Journal of Geophysical Research 115: D19114. doi:10.1029/2010JD013866.
- Cui, J., J. Li, A. Z. Zhang, and Q. Yan. 2007. “Advances in Studies of Summer Low Temperature in Northeast China.” (in Chinese). Meteorological Monthly 33: 3–9.
- Ding, Q. H., and B. Wang. 2005. “Circumglobal Teleconnection in the Northern Hemisphere Summer.” Journal of Climate 18: 3483–3505. doi:10.1175/JCLI3473.1.
- Enomoto, T. 2004. “Interannual Variability of the Bonin High Associated with the Propagation of Rossby Waves along the Asian Jet.” Journal of the Meteorological Society of Japan 82: 1019–1034. doi:10.2151/jmsj.2004.1019.
- Gao, M. N., B. Wang, J. Yang, and W. J. Dong. 2018. “Are Peak Summer Sultry Heat Wave Days over the Yangtze-Huaihe River Basin Predictable?” Journal of Climate 31: 2185–2196. doi:10.1175/JCLI-D-17-0342.1.
- Harris, I., P. D. Jones, T. J. Osborn, and D. H. Lister. 2014. “Updated High-Resolution Grids of Monthly Climatic Observations-The CRU TS3.10 Dataset.” International Journal of Climatology 34: 623–642. doi:10.1002/joc.3711.
- He, S. P., Y. Liu, and H. J. Wang. 2017. “Connection between the Silk Road Pattern in July and the following January Temperature over East Asia.” Journal of Meteorological Research 31: 378–388. doi:10.1007/s13351-017-6064-z.
- Hoskins, B. J., and T. Ambrizzi. 1993. “Rossby Wave Propagation on A Realistic Longitudinally Varying Flow.” Journal of the Atmospheric Sciences 50: 1661–1671. doi:10.1175/1520-0469(1993)050<1661:RWPOAR>2.0.CO;2.
- Hsu, H. H., and S. M. Lin. 2007. “Asymmetry of the Tripole Rainfall Pattern during the East Asian Summer.” Journal of Climate 20: 4443–4458. doi:10.1175/JCLI4246.1.
- Huang, G. 2004. “An Index Measuring the Interannual Variation of the East Asian Summer Monsoon-The EAP Index.” Advances in Atmospheric Sciences 21: 41–52. doi:10.1007/BF02915679.
- Huang, G., Y. Liu, and R. H. Huang. 2011. “The Interannual Variability of Summer Rainfall in the Arid and Semiarid Regions of Northern China and Its Association with the Northern Hemisphere Circumglobal Teleconnection.” Advances in Atmospheric Sciences 28: 257–268. doi:10.1007/s00376-010-9225-x.
- Huang, R. H., W. Chen, B. L. Yang, and R. H. Zhang. 2004. “Recent Advances in Studies of the Interaction between the East Asian Winter and Summer Monsoons and ENSO Cycle.” Advances in Atmospheric Sciences 21: 407–424. doi:10.1007/BF02915568.
- Huang, R. H., Y. Liu, and T. Feng. 2013. “Interdecadal Change of Summer Precipitation over Eastern China around the Late-1990s and Associated Circulation Anomalies, Internal Dynamical Causes.” Chinese Science Bulletin 58: 1339–1349. doi:10.1007/s11434-012-5545-9.
- Huang, R. H., and F. Y. Sun. 1992. “Impacts of the Tropical Western Pacific on the East Asian Summer Monsoon.” Journal of the Meteorological Society of Japan 70: 243–256. doi:10.2151/jmsj1965.70.1B_243.
- Kawamura, R., and T. Ogasawara. 2006. “On the Role of Typhoons in Generating PJ Teleconnection Patterns over the Western North Pacific in Late Summer.” SOLA 2: 37–40. doi:10.2151/sola.2006-010.
- Kobayashi, S., Y. Ota, Y. Harada, A. Ebita, M. Moriya, H. Onoda, K. Onogi, et al. 2015. “The JRA-55 Reanalysis: General Specifications and Basic Characteristics.” Journal of the Meteorological Society of Japan 93: 5–48. doi:10.2151/jmsj.2015-001.
- Kosaka, Y., S. P. Xie, N. C. Lau, and G. A. Vecchi. 2013. “Origin of Seasonal Predictability for Summer Climate over the Northwestern Pacific.” Proceedings of the National Academy of Sciences 110: 7574–7579. doi:10.1073/pnas.1215582110.
- Kubota, H., Y. Kosaka, and S. P. Xie. 2016. “A 117-Year Long Index of the Pacific-Japan Pattern with Application to Interdecadal Variability.” International Journal of Climatology 36: 1575–1589. doi:10.1002/joc.4441.
- Lin, X. Z., C. F. Li, Z. D. Lin, and R. Y. Lu. 2018. “Close Relationship between the East Asian Westerly Jet and Russian Far East Surface Air Temperature in Summer.” Atmospheric and Oceanic Science Letters 11: 282–286. doi:10.1080/16742834.2018.1467726.
- Lu, R. Y., Z. D. Lin, and Y. C. Zhang. 2013. “Variability of the East Asian Upper-Tropospheric Jet in Summer and Its Impacts on the East Asian Monsoon.” (in Chinese). Chinese Journal of Atmospheric Sciences 37: 331–340.
- Lu, R. Y., J. H. Oh, and B. J. Kim. 2002. “A Teleconnection Pattern in Upper-Level Meridional Wind over the North African and Eurasian Continent in Summer.” Tellus 54A: 44–55. doi:10.3402/tellusa.v54i1.12122.
- Ninomiya, K., and H. Mizuno. 1985. “Anomalous Cold Spell in Summer over Northeastern Japan Caused by Northeasterly Wind from Polar Maritime Airmass. Part 1: EOF Analysis of Temperature Variation in Relation to the Large-Scale Situation Causing the Cold Summer.” Journal of the Meteorological Society of Japan 63: 845–857. doi:10.2151/jmsj1965.63.5_845.
- Nitta, T. 1987. “Convective Activities in the Tropical Western Pacific and Their Impact on the Northern Hemisphere Summer Circulation.” Journal of the Meteorological Society of Japan 65: 373–390. doi:10.2151/jmsj1965.65.3_373.
- Nitta, T. 1989. “Global Features of the Pacific‐Japan Oscillation.” Meteorology and Atmospheric Physics 41: 5–12. doi:10.1007/BF01032585.
- Ogasawara, T., and R. Kawamura. 2007. “Combined Effects of Teleconnection Patterns on Anomalous Summer Weather in Japan.” Journal of the Meteorological Society of Japan 85: 11–24. doi:10.2151/jmsj.85.11.
- Poli, P., H. Hersbach, D. Dee, P. Berrisford, A. J. Simmons, F. Vitart, P. Laloyaux, et al. 2016. “ERA-20C: An Atmospheric Reanalysis of the Twentieth Century.” Journal of Climate 29: 4083–4097. doi:10.1175/JCLI-D-15-0556.1.
- Sato, N., and M. Takahashi. 2006. “Dynamical Processes Related to the Appearance of Quasi-Stationary Waves on the Subtropical Jet in the Midsummer Northern Hemisphere.” Journal of Climate 19: 1531–1544. doi:10.1175/JCLI3697.1.
- Sato, N., and M. Takahashi. 2007. “Dynamical Processes Related to the Appearance of the Okhotsk High during Early Midsummer.” Journal of Climate 20: 4982–4994. doi:10.1175/JCLI4285.1.
- Sun, J. Q. 2014. “Record-Breaking SST over Mid-North Atlantic and Extreme High Temperature over the Jianghuai-Jiangnan Region of China in 2013.” Science Bulletin 59: 3465–3470. doi:10.1007/s11434-014-0425-0.
- Sun, J. Q., and J. Ming. 2018. “Possible Mechanism for the Weakening Relationship between Indian and Central East Asian Summer Rainfall after the Late 1970s: Role of the Mid-to-High-Latitude Atmospheric Circulation.” Meteorology and Atmospheric Physics. doi:10.1007/s00703-018-0586-5.
- Sun, J. Q., J. Ming, M. Q. Zhang, and S. Yu. 2018. “Circulation Features Associated with the Record‐Breaking Rainfall over South China in June 2017.” Journal of Climate 31: 7209–7224. doi:10.1175/JCLI-D-17-0903.1.
- Sun, J. Q., and H. J. Wang. 2012. “Changes of the Connection between the Summer North Atlantic Oscillation and the East Asian Summer Rainfall.” Journal of Geophysical Research 117: D08110. doi:10.1029/2012JD017482.
- Sun, J. Q., H. J. Wang, and W. Yuan. 2008. “Decadal Variations of the Relationship between the Summer North Atlantic Oscillation and Middle East Asian Air Temperature.” Journal of Geophysical Research 113: D15107. doi:10.1029/2007JD009626.
- Sun, J. Q., H. J. Wang, and W. Yuan. 2011. “Decadal Variability of the Extreme Hot Event in China and Its Association with Atmospheric Circulations.” (in Chinese). Climatic and Environmental Research 16: 199–208.
- Sun, X. G., R. J. Greatbatch, W. Park, and M. Latif. 2010. “Two Major Modes of Variability of the East Asian Summer Monsoon.” Quarterly Journal of the Royal Meteorological Society 136: 829–841. doi:10.1002/qj.635.
- Wakabayashi, S., and R. Kawamura. 2004. “Extraction of Major Teleconnection Patterns Possibly Associated with the Anomalous Summer Climate in Japan.” Journal of the Meteorological Society of Japan 82: 1577–1588. doi:10.2151/jmsj.82.1577.
- Wang, H. J., and K. Fan. 2009. “A New Scheme for Improving the Seasonal Prediction of Summer Precipitation Anomalies.” Weather and Forecasting 24: 548–554. doi:10.1175/2008WAF2222171.1.
- Wang, L., P. Q. Xu, W. Chen, and Y. Liu. 2017. “Interdecadal Variations of the Silk Road Pattern.” Journal of Climate 30: 9915–9932. doi:10.1175/JCLI-D-17-0340.1.
- Wang, W. W., W. Zhou, X. Z. Li, X. Wang, and D. X. Wang. 2016. “Synoptic-Scale Characteristics and Atmospheric Controls of Summer Heat Waves in China.” Climate Dynamics 46: 2923–2941. doi:10.1007/s00382-015-2741-8.
- Wu, R. G. 2002. “A Mid-Latitude Asian Circulation Anomaly Pattern in Boreal Summer and Its Connection with the Indian and East Asian Summer Monsoons.” International Journal of Climatology 22: 1879–1895. doi:10.1002/joc.845.
- Xie, S. P., Y. Kosaka, Y. Du, K. M. Hu, J. S. Chowdary, and G. Huang. 2016. “Indo-Western Pacific Ocean Capacitor and Coherent Climate Anomalies in Post-ENSO Summer: A Review.” Advances in Atmospheric Sciences 33: 411–432. doi:10.1007/s00376-015-5192-6.
- Yasunaka, S., and K. Hanawa. 2006. “Interannual Summer Temperature Variations over Japan and Their Relation to Large-Scale Atmospheric Circulation Field.” Journal of the Meteorological Society of Japan 84: 641–652. doi:10.2151/jmsj.84.641.
- Yuan, W., and J. Q. Sun. 2009. “Enhancement of the Summer North Atlantic Oscillation Influence on Northern Hemisphere Air Temperature.” Advances in Atmospheric Sciences 26: 1209–1214. doi:10.1007/s00376-009-8148-x.