
ABSTRACT
This analysis of the multi-model aerosol optical depth (AOD) in eastern China using the Atmospheric Chemistry and Climate Model Intercomparison Project (ACCMIP) datasets shows that the global models underestimate the AOD by 33% and 44% in southern and northern China, respectively, and decrease the relative humidity (RH) of the air in the surface layer to 71%–80%, which is less than the RH of 77%–92% in reanalysis meteorological datasets. This indicates that the low biases in the RH partially account for the errors in the AOD. The AOD is recalculated based on the model aerosol concentrations and the reanalysis humidity data. Improving the mean value of the RH increases the multi-model annual mean AOD by 45% in southern China and by 33% in June–August in northern China. This method of improving the AOD is successful in most of the ACCMIP models, but it is unlikely to be successful in GISS-E2-R, in which the plot of its AOD efficiency against RH strongly deviates from the rest of the models. The effect of the improvement in the modeled RH on the AOD depends on the concentration of aerosols. The shape error in the frequency distribution of the RH is likely to be more important than the error in the mean value of the RH, but this requires further research.
Graphical abstract
摘要
当前全球气候模式普遍低估中国东部气溶胶光学厚度(AOD)。本文表明,模式低估中国东部地表大气相对湿度是AOD低估的原因之一。研究基于国际大气化学气候模式比较计划的干气溶胶质量浓度结果,用再分析湿度数据替换模拟湿度以计算AOD变化。结果表明,替换后我国大气相对湿度增加,多模式平均的华南年均AOD因此增长45%,华北6-8月AOD增长33%。不同模式采用相似的硫酸盐吸湿增长曲线。相对湿度低估对AOD模拟影响程度主要受吸湿颗粒质量浓度和相对湿度概率分布影响,该结论有助于解释我国AOD模拟误差。
1. Introduction
According to the multi-model results from the Atmospheric Chemistry and Climate Model Intercomparison Project (ACCMIP), the model biases in the aerosol optical depth (AOD) range from −30% to 20%. Most of these biases are lower than those in observational AOD datasets from satellites because of the absence of nitrates or secondary organic aerosols (SOAs) in some of the models (Shindell et al. Citation2013) and the low biases in the sulfate concentrations in winter and in the concentration of organic aerosols throughout the year (Chang et al. Citation2018). The concentration biases are relevant to the uncertainties in inventories of anthropogenic emissions (Chang et al. Citation2015; Fan et al. Citation2018) and the limitations of models in describing the aerosol chemistry of winter urban haze in northern China (Chen et al. Citation2016; Huang et al. Citation2014; Zheng et al. Citation2015).
In addition to aerosol concentrations, meteorological conditions also influence the AOD. Eastern China is a typical monsoon region and the AOD is higher in summer than in winter because the humid summer air increases the size of particulates via the uptake of water (Bian et al. Citation2014; Liu et al. Citation2011; Li et al. Citation2013; Zheng et al. Citation2017; Zhao et al. Citation2018; Zhu et al. Citation2019). In winter, the uptake of water by aerosols plays an important part in the growth of secondary aerosols on haze days (Chen et al. Citation2016; Wang et al. Citation2014; Zheng et al. Citation2015). The hygroscopicity of sulfate, the main anthropogenic aerosol, can be simulated using the variant parametric formulas of Köhler theory (Chin et al. Citation2002; Fitzgerald Citation1975; Ghan and Zaveri Citation2007; Tang and Munkelwitz Citation1994; Zhang et al. Citation2014). The particulate hygroscopic growth factor (i.e., the ratio of the wet particulate radius to the dry particulate radius) is a quadratic function of the relative humidity (RH) of the ambient air based on chamber studies (Fitzgerald Citation1975; Tang and Munkelwitz Citation1994). The particulate size dramatically increases under conditions of high RH (e.g., RH >80%). It is difficult to precisely reproduce the Asian monsoon using climate models (Sperber et al. Citation2013) and the bias in the RH partially accounts for the biases in modeling the hygroscopicity of aerosols and the AOD.
This study assesses the influence of the ambient RH on the AOD in eastern China in the ACCMIP models from the perspective of the hygroscopicity of aerosols. The effects of the RH on the AOD reported here are not comprehensive because the effect of the RH on aerosol chemistry is not concerned because of the limitations of the ACCMIP dataset, but it is meaningful to illustrate the adverse impacts of the model bias in the RH on the simulation of the AOD.
2. Data and methods
The analysis is based on aerosol simulations from nine ACCMIP models for the year 2000 downloaded from the British Atmospheric Data Center (http://badc.nerc.ac.uk). The nine models are all two-way coupled chemistry–climate global models, except for CICERO-OsloCTM2, which is a chemistry transport model. Most of the models simulate the mass of aerosols using a bulk approach in which the size distributions of aerosols are prescribed. GISS-E2-R-TOMAS couples TwO-Moment Aerosols Sectional (TOMAS) aerosol microphysics to simulate the aerosol number and mass size distributions. NCAR-CAM5.1 uses three internally mixed log-normal modes to represent the size distributions of aerosols. Aerosol indirect effects are represented in CICERO-OsloCTM2, GFDL-AM3, GISS-E2-R, GISS-TOMAS, HadGEM2, MIROC-CHEM, and NCAR-CAM5.1. More details of the models have been reported in the ACCMIP overview paper of Lamarque et al. (Citation2013). The ACCMIP datasets contain the monthly mass concentrations of sulfate, black carbon, and primary organic aerosols. The CICERO-OsloCTM2, GFDL-AM3, and GISS-E2-R datasets have additional results for nitrates, and the CICERO-OsloCTM2, GISS-E2-R, HadGEM2, and NCAR-CAM5.1 datasets have additional results for SOAs. The CESM-CAM-superfast dataset only provides a result for sulfate, which is discussed in section 3.3.
The AOD model results are evaluated against the 550 nm AOD data retrieved from the Moderate Resolution Imaging Spectroradiometer (MODIS) on the Terra satellite averaged from March 2000 to December 2004. The monthly specific humidity data from the models are transformed into RH values and evaluated against reanalysis monthly RH data for the years 2000–04. The reanalysis RH data are derived from the 6-h GEOS4 reanalysis datasets of specific humidity and air temperature interpolated onto each model gird and vertical layer. The 6-h GEOS4 datasets are generated by NASA’s Global Assimilation and Modeling Office and contain the meteorological fields at 0000, 0600, 1200, and 1800 GMT with a global resolution of 2° (latitude) × 2.5° (longitude) and 55 vertical layers extending from the Earth’s surface to 0.01 hPa. The reanalysis horizontal resolution is close to those in the global models and is suitable for this discussion based on the global model results.
In addition to the original model AOD results, this study calculates the 550 nm AOD based on the model monthly mean aerosols and the 6-h GEOS4 RH results. The AOD calculation is based on Mie theory. Sulfate and nitrate are regarded as ammonium sulfate and ammonium nitrate, respectively, and similar refractive indexes to those reported in Toon, Pollack, and Khare (Citation1976) are used. The refractive indexes of black carbon and organic aerosols are from Chin et al. (Citation2002). The primary organic aerosols (including 30% hydrophilic and 70% hydrophobic aerosols) and SOAs have similar refractive indexes. The aerosol hygroscopicity follows the scheme of Ghan and Zaveri (Citation2007). The AOD is calculated based on the total aerosol mass concentrations in GISS-E2-R-TOMAS and NCAR-CAM5.1. These two models simulate aerosol size distributions but do not provide the aerosol size concentrations in their datasets.
Two AOD calculations are conducted using each model’s monthly aerosol concentration. The first calculation is the BASELINE experiment based on the 6-h RH reanalysis data. The second calculation (EXP2) uses the same 6-h RH data but the monthly mean RH value is adjusted to the monthly mean value of each model. The difference between the BASELINE and EXP results shows the changes in the AOD as a result of the improvement in the mean value of the RH. The models do not provide the size bin concentrations for mineral dust and sea salt, and so this study does not calculate the natural AOD values. The AOD values are summed with the original AODs of mineral dust and sea salt to represent the total AOD in each model.
3. Results
3.1. Model errors in AOD and RH
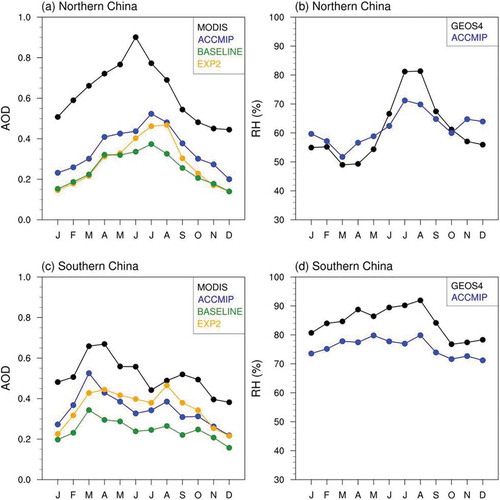
The multi-model mean AOD is strongly underestimated in mainland China (), with annual biases of −44% and −33% in North and South China, respectively. The individual model errors in the two sub-regions range from −64% to 2%. The multi-model mean AOD shows seasonal variation, in agreement with the MODIS data (). The high summer AOD in northern China is due to the large hygroscopic growth of hydrophilic aerosols during the southerly wet monsoon (Li et al. Citation2016). The low model AOD from March to May is due to the low dust AOD, which is a common model error for uncertain dust emissions (Pu and Ginoux Citation2018). In winter, the low AOD is due to the lack of nitrates and SOAs in some of the models (Shindell et al. Citation2013). Additionally, the model chemistry is unable to reproduce the strong growth of sulfate during haze days in urban regions (Chen et al. Citation2016; Huang et al. Citation2014; Zheng et al. Citation2015), which leads to strong low-AOD in northern China even though the RH bias there is not as high as that in southern China.
Figure 1. Annual surface-layer RH (%) and AOD in the multi-model mean values (except CESM-CAM-superfast) for 2000 and their differences with GEOS4 reanalysis data and MODIS data for 2000–04. The frames in (c, f) mark the ranges of northern (31°–41°N, 112°–122°E) and southern (21°–30°N, 108°–122°E) China.
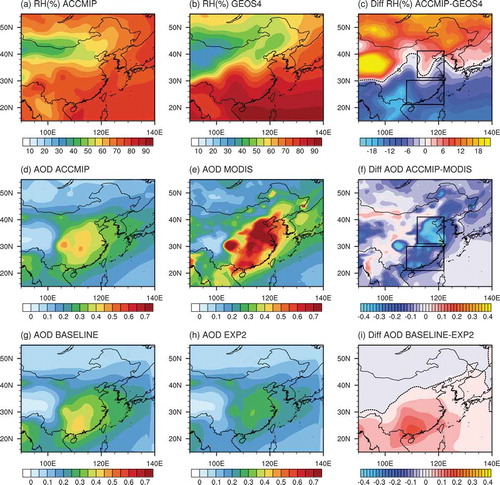
Figure 2. Annual cycles of the AOD and the surface-layer RH (%).
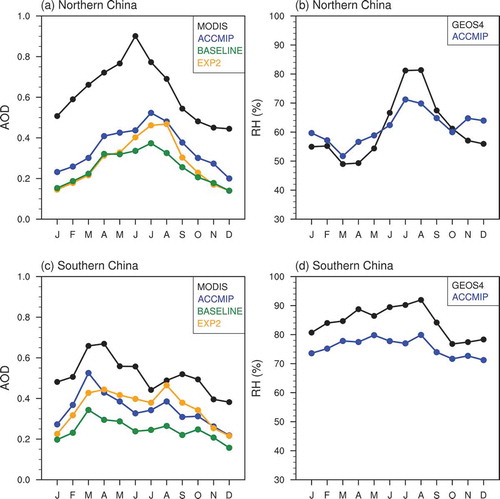
The models underestimate the RH in the surface layer. According to the reanalysis dataset, the surface-layer RH ranges from 77%–92% throughout the year in southern China and 81% in July–August in northern China. Correspondingly, the models produce a lower RH of 71%–80% in the surface layer in southern China, and 71% in northern China, and extend the low bias into the upper layers.
The adverse effects of the RH errors to the AOD can be recognized by the hygroscopicities of sulfates and nitrates. Organic aerosols make up another important portion of the AOD, but its AOD error is a result of the low bias in the concentration of organic aerosols caused by the limitations of the organic chemistry in the models (Tsigaridis et al. Citation2014). Apart from GISS-E2-R and GISS-E2-R-TOMAS, the other models predict sulfate hygroscopicity using a variant parametric formula from Köhler theory, which are reproduced here in a FORTRAN program and the reproduced Köhler curves are shown in ). The two GISS models handle the hygroscopicity of aerosols in different ways. GISS-E2-R parameterizes the wet aerosol size to reproduce precisely the extinction efficiency and asymmetry parameters of the solute aerosols at a laboratory wavelength of 633 nm (Schmidt et al. Citation2006). GISS-E2-R-TOMAS simulates the uptake of water by sulfate using a polynomial fit based on the results of the thermodynamic equilibrium model ISORROPIA (Lee, Adams, and Shindell Citation2015). It is hard to reproduce the hygroscopic growth curves in the two GISS models because of a lack of published data.
Figure 3. (a) Hygroscopic growth factors (GWF) of surface particulates plotted against RH in the ACCMIP models. (b) Probability distribution functions (PDF) of the RH in the surface layer in the reanalysis dataset at 0600 and 1200 GMT June–August 2000–04. (c) PDF of sulfate AOD corresponding to the RH in panel (b). The sulfate AOD is calculated for a dry particulate with a normal distribution of 0.05 ± 2.0 µm, a dry particulate density of 1.769 g cm−3, and a column burden of 41 mg m−2.
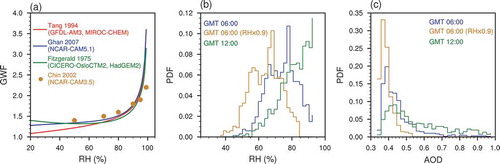
) shows the reproduced hygroscopic growth factor for sulfate, which is the ratio of the wet particulate radius to the dry radius as a function of the ambient RH value in the ACCMIP models. The variant formulas give roughly equivalent quadratic growth curves at high RH values, showing a growth factor of 1.4–1.5 for 70%–80% RH and 1.5–2 for 80%–95% RH. The variant implementations of Köhler theory are therefore unlikely to yield a substantial difference in the AOD for sulfate. The models underestimate the RH of the surface layer beyond 70%, which is the crucial RH value for accelerated hygroscopic growth of sulfate.
3.2. Improvements in AOD as a result of changes in the mean RH
shows that the baseline AOD is lower than the MODIS AOD for the similar causes to the original model results (e.g., low dust in spring and low anthropogenic secondary aerosols in winter), and thus the annual cycle in the baseline resembles the original model mean result. The baseline AOD is lower than the original model AOD because the monthly model results smooth the high concentrations. In southern China, as improving the mean value of the RH in the EXP2 experiment from the models (the multi-model mean value is 76%) to the reanalysis data (84%), the multi-model mean AOD in EXP2 is improved in each month, with an annual increase of 45% ()). In northern China, the model RH is often less than 70% ()) and the annual RH approaches the value in the reanalysis dataset. As a result, the increase in the AOD in EXP2 in northern China is only noticeable (33%) from June to August ()).
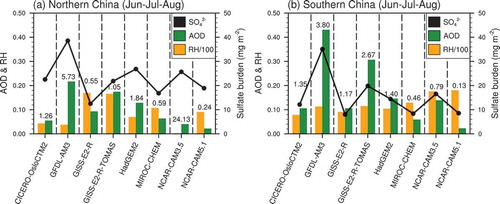
The effectiveness of the RH correction is dependent on two factors. First, the high aerosol concentrations yield a strong improvement in the AOD. shows the difference in the surface-layer RH and the total AOD between the BASELINE and EXP2 results and the ratio of the differences, which denotes the AOD anomaly yielded by one unit change in the RH value. A high ratio is related to the abundance of sulfates. For example, the two GISS models show almost similar increases in the RH, but GISS-E2-R-TOMAS shows a greater increase in the AOD at high sulfate concentrations. The nitrate AOD in GISS-E2-R shows only a small response to the RH improvement because the nitrates in GISS-E2-R are more abundant in winter (Chang et al. Citation2018) when the RH is low. GFDL-AM3 and NCAR-CAM5.1 show higher and lower improving ratios, respectively, consistent with their sulfate burdens. In northern China, NCAR-CAM3.5 shows a slight positive change in the RH and a noticeable increase in the AOD. This model shows opposite changes in the RH between June and July–August. With the accelerating growth in particle size under high RH conditions, the increase in the AOD in July–August overwhelms the effect of the RH reduction in June.
Figure 4. Individual model changes in the surface-layer RH (as a fraction of 1) and the total AOD between the BASELINE and EXP2 results for June–August. The number in each column denotes the ratio of the changes in the AOD and the RH values. The sulfate column burdens (mg m−2) are also shown in the figure.
Another factor affecting the response of the AOD is relevant to the RH frequency distribution. To confirm this, an idealized sulfate AOD is calculated for the multi-model mean sulfate column burden of 41 mg m−2 in southern China under the 6-h RH in the same area at 0600 GMT June–August 2000–04. ,) show that when the mean value of the RH is intentionally decreased from 73% to 63%, the corresponding mean value of the AOD decreases from 0.44 to 0.38, which is a decrease of 14%. AOD values larger than 0.52 are not observed.
In addition to the RH mean value, the shape of the RH distribution affects the AOD. For example, as a result of the low air temperature at night, the RH at 1200 GMT has a high mean value and a strong negative skewness (more extremely high values) than that at 0600 GMT ()). The mean RH increases from 73% at 0600 GMT to 81% at 1200 GMT. Correspondingly, AOD values larger than 0.5 are more abundant at 1200 GMT ()), with an increase in the mean AOD of 25%, higher than the change in the AOD (14%) due to the almost equivalent change in the RH mean value alone.
Urban haze often accompanies conditions of high humidity during winter, in which active heterogeneous reactions favor the strong growth of secondary particulates (Chen et al. Citation2016; Huang et al. Citation2014; Wang et al. Citation2014; Zheng et al. Citation2015). The radiative feedback of aerosols increases the RH of the surface layer (Gao et al. Citation2015), which tends to yield a higher instantaneous RH in extremely high tails. Therefore, the models underestimate the intensity of haze, weaken the radiative feedback of aerosols to the ambient RH, and presumably lower the AOD relevant to hygroscopic growth. Unfortunately, further evaluation of the shape of the RH distribution is difficult based on monthly results. It is suggested that if the models can be developed to give better aerosol concentrations on haze days, then the effect of improving the RH on the AOD results could be more pronounced.
3.3. Sulfate AOD efficiencies
Because hydrophilic particulates have equal opportunities to grow as the RH increases, the growth curve for a single particulate is reflected in the sulfate AOD efficiency — that is, the ratio of the sulfate AOD to the sulfate column burden. shows the sulfate AOD efficiency plotted against the mean ambient RH values below 850 hPa in June–August in the original model results. Apart from GISS-E2-R, the models show a positive relationship, which suggests the sulfate AOD efficiency will possibly increase if the RH is improved in these models. In southern China, the increase in the AOD efficiency is slower than that predicted by Köhler theory because the strong precipitation in this region scavenges aerosols.
Figure 5. Sulfate AOD efficiency (the ratio of the sulfate AOD to the sulfate column burden) plotted against the mean RH below 850 hPa in June–August. The dashed lines represent the reanalysis RH values.
GISS-E2-R-TOMAS shows a sulfate AOD efficiency in agreement with the models that use bulk size approaches and the parametric formulas of Köhler theory. GISS-E2-R simulates a much higher AOD efficiency than the other models. The two GISS models are based on the same atmospheric model framework and have comparable monthly mean RH values. The large difference between their AOD efficiencies is likely relevant to the shapes of the RH distributions and the responses of the planetary boundary layer (PBL) to aerosol radiative forcings (a lower PBL height traps more aerosols in the humid boundary layers). These models are two-way coupled chemistry–climate models. Aerosol radiative feedback may amplify the differences in the shape of the RH distributions and meanwhile decrease the wind speed near the surface (Yang et al. Citation2016; Yang et al. Citation2018), resulting in the strong differences in the AOD efficiency.
4. Summary
The ACCMIP models underestimate the ambient RH in the east of mainland China. The dry air biases decrease the hygroscopic growth of hydrophilic particles, which partly accounts for the low bias in the AOD. The difference in the monthly mean RH between the models and the reanalysis data changes the multi-model annual mean AOD by 45% in southern China and 33% in June and August in northern China. Most of the models agree that increasing the ambient RH increases the AOD efficiency of sulfate in a similar way to the Köhler curve for the hygroscopicity of single sulfate particulate. GISS-E2-R deviates from the other models and predicts the highest sulfate AOD efficiency, which could be due to its shape of RH distribution and PBL feedback to aerosol forcings being different from the other models. The AOD in this model cannot be improved by improving the mean value of the RH.
The study is limited by the monthly timescale of the model results, which prevents further discussion on the impacts of the shape error in the frequency distribution of the RH. The shape of the RH distribution is likely more effective than the mean value in altering the AOD because the aerosol radiative effect increases the concentration of secondary aerosols and the ambient RH on haze days. The hygroscopicity of organic aerosols is not discussed here because the concentration of SOAs is strongly underestimated in the model chemistry. The role of RH in the simulation of the AOD may be more pronounced as the heterogeneous reactions and SOA chemistry are improved in these models. Because a high AOD indicates a strong aerosol radiative effect, the propagation of error between the aerosol chemistry and meteorological conditions in two-way coupled chemistry–atmosphere models is an important topic for research on the effects of aerosols on climate in China.
Disclosure statement
No potential conflict of interest was reported by the author.
Additional information
Funding
References
- Bian, Y. X., C. S. Zhao, N. Ma, J. Chen, and W. Y. Xu. 2014. “A Study of Aerosol Liquid Water Content Based on Hygroscopicity Measurements at High Relative Humidity in the North China Plain.” Atmospheric Chemistry and Physics 14: 6417–6426. doi:10.5194/acp-14-6417-2014.
- Chang, W., H. Liao, J. Xin, Z. Li, D. Li, and X. Zhang. 2015. “Uncertainties in Anthropogenic Aerosol Concentrations and Direct Radiative Forcing Induced by Emission Inventories in Eastern China.” Atmospheric Research 166: 129–140. doi:10.1016/j.atmosres.2015.06.021.
- Chang, W., J. Zhan, Y. Zhang, Z. Li, J. Xing, and J. Li. 2018. “Emission-Driven Changes in Anthropogenic Aerosol Concentrations in China during 1970-2010 and Its Implications for PM2.5 Control Policy.” Atmospheric Research 212: 106–119. doi:10.1016/j.atmosres.2018.05.008.
- Chen, D., Z. Liu, J. Fast, and J. Ban. 2016. “Simulations of Sulfate-Nitrate-Ammonium (SNA) Aerosols during the Extreme Haze Events over Northern China in October 2014.” Atmospheric Chemistry and Physics 16: 10707–10724. doi:10.5194/acp-16-10707-2016.
- Li, C.-C., H. Xiu, D. Zhao-Ze, A. Kai-Hon Lau, and L. Ying. 2013. “Dependence of Mixed Aerosol Light Scattering Extinction on Relative Humidity in Beijing and Hong Kong.” Atmospheric and Oceanic Science Letters 6: 117–121. doi:10.1080/16742834.2013.11447066.
- Chin, M., P. Ginoux, S. Kinne, O. Torres, B. N. Holben, B. N. Duncan, R. V. Martin, J. A. Logan, A. Higurashi, and T. Nakajima. 2002. “Tropospheric Aerosol Optical Thickness from the GOCART Model and Comparisons with Satellite and Sun Photometer Measurements.” Journal of the Atmospheric Sciences 59: 461–483. doi:10.1175/1520-0469(2002)059<0461:TAOTFT>2.0.CO;2.
- Fan, T., X. Liu, P.-L. Ma, Q. Zhang, Z. Li, Y. Jiang, F. Zhang, et al. 2018. “Emission or Atmospheric Processes? an Attempt to Attribute the Source of Large Bias of Aerosols in Eastern China Simulated by Global Climate Models.” Atmospheric Chemistry and Physics 18: 1395–1417. doi:10.5194/acp-18-1395-2018.
- Fitzgerald, J. W. 1975. “Approximation Formulas for the Equilibrium Size of an Aerosol Particle as a Function of Its Dry Size and Composition and the Ambient Relative Humidity.” Journal of Applied Meteorology 14: 1044–1049. doi:10.1175/1520-0450(1975)014<1044:AFFTES>2.0.CO;2.
- Gao, Y., M. Zhang, Z. Liu, L. Wang, P. Wang, X. Xia, M. Tao, and L. Zhu. 2015. “Modeling the Feedback between Aerosol and Meteorological Variables in the Atmospheric Boundary Layer during a Severe Fog-Haze Event over the North China Plain.” Atmospheric Chemistry and Physics 15: 4279–4295. doi:10.5194/acp-15-4279-2015.
- Ghan, S. J., and R. A. Zaveri. 2007. “Parameterization of Optical Properties for Hydrated Internally Mixed Aerosol.” Journal of Geophysical Research: Atmospheres 112: D10201. doi:10.1029/2006JD007927.
- Huang, X., Y. Song, C. Zhao, M. Li, T. Zhu, Q. Zhang, and X. Zhang 2014. “Pathways of Sulfate Enhancement by Natural and Anthropogenic Mineral Aerosols in China.” Journal of Geophysical Research: Atmospheres 119 :14,165–14,179. doi:10.1002/2014JD022301.
- Lamarque, J.-F., D. T. Shindell., B. Josse, P. J. Young, I. Cionni, V. Eyring, D. Bergmann, et al. 2013. “The Atmospheric Chemistry and Climate Model Intercomparison Project (ACCMIP): Overview and Description of Models, Simulations and Climate Diagnostics.” Geoscientific Model Development 6: 179–206. doi:10.5194/gmd-6-179-2013.
- Lee, Y. H., P. J. Adams, and D. T. Shindell. 2015. “Evaluation of the Global Aerosol Microphysical ModelE2-TOMAS Model against Satellite and Ground-Based Observations. .” Geoscientific Model Development 8: 631–667. doi:10.5194/gmd-8-631-2015.
- Li, S., T. Wang, F. Solmon, B. Zhuang, H. Wu, M. Xie, Y. Han, and X. Wang. 2016. “Impact of Aerosols on Regional Climate in Southern and Northern China during Strong/Weak East Asian Summer Monsoon Years.” Journal of Geophysical Research: Atmospheres 121 :4069–4081. doi:10.1002/2015JD023892.
- Liu, P. F., C. S. Zhao, T. Göbel, E. Hallbauer, A. Nowak, L. Ran, W. Y. Xu, et al. 2011. “Hygroscopic Properties of Aerosol Particles at High Relative Humidity and Their Diurnal Variations in the North China Plain.” Atmospheric Chemistry and Physics 11: 3479–3494. doi:10.5194/acp-11-3479-2011.
- Pu, B., and P. Ginoux. 2018. “How Reliable are CMIP5 Models in Simulating Dust Optical Depth?” Atmospheric Chemistry and Physics 18: 12,491–12,510. doi:10.5194/acp-18-21491-2018.
- Schmidt, G. A., R. Ruedy, J. E. Hansen, I. Aleinov, N. Bell, M. Bauer, S. Bauer, et al. 2006. “Present-Day Atmospheric Simulations Using GISS ModelE: Comparison to in Situ, Satellite, and Reanalysis Data.” Journal of Climate 19: 153–192. doi:10.1175/JCLI3612.1.
- Shindell, D. T., J.-F. Lamarque, M. Schulz, M. Flanner, C. Jiao, M. Chin, P. J. Young, et al. 2013. “Radiative Forcing in the ACCMIP Historical and Future Climate Simulations.” Atmospheric Chemistry and Physics 13: 2939–2974. doi:10.5194/acp-13-2939-2013.
- Sperber, K. R., H. Annamalai, I.-S. Kang, A. Kitoh, A. Moise, A. Turner, B. Wang, and T. Zhou. 2013. “The Asian Summer Monsoon: An Intercomparison of CMIP5 Vs. CMIP3 Simulations of the Late 20th Century.” Climate Dynamics 41: 2711–2744. doi:10.1007/s00382-012-1607-6.
- Tang, I. N., and H. R. Munkelwitz. 1994. “Water Activities, Densities, and Refractive Indices of Aqueous Sulfates and Sodium Nitrate Droplets of Atmospheric Importance.” Journal of Geophysical Research: Atmospheres 99: 18,801–18,808. doi:10.1029/94JD01345.
- Toon, O. B., J. B. Pollack, and B. N. Khare. 1976. “The Optical Constants of Several Atmospheric Aerosol Species: Ammonium Sulfate, Aluminum Oxide, and Sodium Chloride.” Journal of Geophysical Research 81: 5733–5748. doi:10.1029/JC081i033p05733.
- Tsigaridis, K., N. Daskalakis, M. Kanakidou, P. J. Adams, P. Artaxo, R. Bahadur, Y. Balkanski, et al. 2014. “The AeroCom Evaluation and Intercomparison of Organic Aerosol in Global Models.” Atmospheric Chemistry and Physics 14: 10845–10895. doi:10.5194/acp-14-10845-2014.
- Wang, Y., L. Yao, L. Wang, Z. Liu, D. Ji, G. Tang, J. Zhang, Y. Sun, B. Hu, and J. Xin. 2014. “Mechanism for the Formation of the January 2013 Heavy Haze Pollution Episode over Central and Eastern China.” Science China Earth Sciences 57: 14–25. doi:10.1007/s11430-013-4773-4.
- Yang, X., C. Zhao, J. Guo, and Y. Wang 2016. “Intensification of Aerosol Pollution Associated with Its Feedback with Surface Solar Radiation and Winds in Beijing.” Journal of Geophysical Research: Atmospheres 121 :4093–4099. doi:10.1002/2015JD024645.
- Yang, X., C. Zhao, L. Zhou, Z. Li, M. Cribb, and S. Yang. 2018. “Wintertime Cooling and a Potential Connection with Transported Aerosols in Hong Kong during Recent Decades.” Atmospheric Research 211: 52–61. doi:10.1016/j.atmosres.2018.04.029.
- Zhang, F., Y. Li, Z. Li, L. Sun, R. Li, C. Zhao, P. Wang, et al. 2014. “Aerosol Hygroscopicity and Cloud Condensation Nuclei Activity during the AC3 Exp Campaign: Implications for Cloud Condensation Nuclei Parameterization.” Atmospheric Chemistry and Physics 14: 13423–13437. doi:10.5194/acp-14-13423-2014.
- Zhao, C., Y. Li, F. Zhang, Y. Sun, and P. Wang. 2018. “Growth Rates of Fine Aerosol Particles at a Site near Beijing in June 2013.” Advances in Atmospheric Sciences 35 (2): 209–217. doi:10.1007/s00376-017-7069-3.
- Zheng, B., Q. Zhang, Y. Zhang, K. B. He, K. Wang, G. J. Zheng, F. K. Duan, Y. L. Ma, and T. Kimoto. 2015. “Heterogeneous Chemistry: A Mechanism Missing in Current Models to Explain Secondary Inorganic Aerosol Formation during the January 2013 Haze Episode in North China.” Atmospheric Chemistry and Physics 15: 2031–2049. doi:10.5194/acp-15-2031-2015.
- Zheng, C., C. Zhao, Y. Zhu, Y. Wang, X. Shi, X. Wu, T. Chen, F. Wu, and Y. Qiu. 2017. “Analysis of Influential Factors for the Relationship between PM2.5 And AOD in Beijing.” Atmospheric Chemistry and Physics 17: 13473–13489. doi:10.5194/acp-17-13473-2017.
- Zhu, J., H. Che, X. Xia, X. Yu, and J. Wang. 2019. “Analysis of Water Vapor Effects on Aerosol Properties and Direct Radiative Forcing in China.” The Science of the Total Environment 650: 257–266. doi:10.1016/j.scitotenv.2018.09.022.