
 ?Mathematical formulae have been encoded as MathML and are displayed in this HTML version using MathJax in order to improve their display. Uncheck the box to turn MathJax off. This feature requires Javascript. Click on a formula to zoom.
ABSTRACT
It is important to be able to characterize the thermal conditions over the equatorial Indian Ocean for both weather forecasting and climate prediction. This study compared the equatorial eastern Indian Ocean (EEIO) temperature and relative humidity profiles from three reanalysis products (JRA-55, MERRA2, and FGOALS-f2) with shipboard global positioning system (GPS) sounding measurements obtained during the Eastern Indian Ocean Open Cruise in spring 2018. The FGOALS-f2 reanalysis product is based on the initialization module of a sub-seasonal to seasonal prediction system with a nudging-based data assimilation method. The results indicated that: (1) both JRA-55 and MERRA2 were reliable in characterizing the temperature profile from 850 to 600 hPa, with a maximum deviation of about <0.5°C. Both datasets showed a large negative deviation below 825 hPa, with a maximum bias of about 2°C at 1000 hPa and 1.5°C at 900 hPa, respectively. (2) JRA-55 showed good performance in characterizing the relative humidity profile above 850 hPa, with a maximum deviation of < 8%, while it showed much wetter conditions below 850 hPa. MERRA2 overestimated the relative humidity in the middle to lower troposphere, with a maximum deviation of about 15% at 925 hPa. (3) The FGOALS-f2 reanalysis product more accurately reproduced the temperature profile in the marine atmospheric boundary layer over the EEIO than that in JRA-55 and MERRA2, but showed much wetter conditions than the GPS sounding observations, with a maximum deviation of up to 20% at 600 hPa. Future applications of GPS sounding datasets are discussed.
Graphical Abstract
摘要
本研究利用2018年春季东印度洋科学考察航次采集的GPS探空数据集,分析了三套再分析资料(JRA-55、MERR2和FGOALS-f2)对赤道东印度洋对流层中低层大气温湿廓线的模拟能力。结果表明:JRA-55和MERRA2能合理地再现850-600hPa之间的温度廓线的特征,最大偏差小于0.5度,但在850hPa以下的偏差增大,最底层的偏差分别达到了2和1.5度;两套再分析资料对850-600hPa之间的湿度扩线也具备较好的再现能力,但在850hPa以下JRA55和MERRA2再分析资料高估了相对湿度,最大湿度偏差可达15%。相对而言,FGOALS-f2分析资料对温度廓线再现能力最好,边界层内的温度偏差明显小于其它两套再分析资料;但FGOALS-f2也存在整层偏湿的问题,最大偏差在600hPa附近,误差接近20%。
1. Introduction
The Indian Ocean is an important region climatically and provides the background conditions (sea surface temperature and atmospheric thermodynamic conditions) for the formation and evolution of numerous weather and climate events, such as typhoons and tropical cyclones (Webster et al. Citation2005), the Madden–Julian Oscillation (Madden Citation1971, Citation1972; Zhang Citation2005), the Indian/Asian summer monsoon (Wang Citation2006), and the Indian Ocean Dipole mode (Saji et al. Citation1999). Most studies of the weather and climate over the Indian Ocean have been conducted using reanalysis datasets or simulation datasets from climate models because few in-situ observations of the atmosphere are available over the Indian Ocean. Previous studies have investigated the quality of reanalysis datasets for reproducing the thermodynamic conditions of the atmosphere based on global positioning system (GPS) sounding measurements taken on land (Zhou and Zhang Citation2009; Jia, Xu, and An Citation2014). However, there is still a need to evaluate the quality of reanalysis datasets and to improve the simulation performance of climate models over oceans.
Among all methods to observe atmospheric conditions, GPS balloon sounding measurements are the cheapest and most easily conducted. Also, they are able to retrieve fine atmospheric stratification datasets in-situ, and have often been used in conventional meteorological observational field campaigns. Such observational data have also been gradually used in regional weather forecasting (Liao, Yu, and Tan Citation2007; He et al. Citation2013), diagnosis of atmospheric conditions (Peng et al. Citation2016), and reanalysis evaluation (Zhou and Zhang Citation2009), amongst other topics.
Marine scientific investigations are the most effective and direct way of gaining knowledge about the oceanic and atmospheric sciences. The Chinese community has conducted several investigations over the South China Sea and Indian Ocean in recent years. Those investigations have provided valuable observational datasets that have been used in the detection of ocean circulation patterns (Chen et al. Citation2017), the generation and assessment of oceanic assimilation datasets (Zeng et al. Citation2016; Zhou et al. Citation2018), the evaluation of the simulation performance of climate models (Shi et al. Citation2017), and the detection of marine atmosphere boundary layer conditions (Peng et al. Citation2016). The Eastern Indian Ocean Open Cruise, sponsored by the South China Sea Institute of Oceanology and supported by the National Science Foundation of China, has been carried out every spring since 2006 (Lin, Qi, and Chen Citation2014; Yang et al. Citation2015; Zeng et al. Citation2015). In the latest cruise (NORC2018-10), which was conducted from 17 March to 15 May 2018, GPS sounders were launched along survey sections of the cruise to determine the vertical structure of the marine atmospheric conditions. This provided a good opportunity for us to investigate the atmospheric conditions based on GPS sounding observations.
LASG/IAP has a long history of developing and applying climate models. The development of the third-generation Flexible Global Ocean–Atmosphere–Land Climate System (FGOALS3) model began in 2012. There are many improvements in computational performance and physical parameterization in the atmospheric component of the latest version (Zhou et al. Citation2015), referred to as FGOALS-f2. A sub-seasonal to seasonal (S2S) prediction system has been set up on the Guangzhou Tianhe2 supercomputer based on FGOALS-f2. This prediction system mainly focuses on the prediction of El Niño–Southern Oscillation events (Bao et al. Citation2019), Arctic sea-ice coverage, and flood-season precipitation in China. The real-time prediction products have been submitted to many organizations, including the National Marine Environmental Forecasting Center, the China Meteorological Administration, and the Sea Ice Prediction Network (Meier et al. Citation2018). FGOALS-f2 reanalysis products come from the initialization of the S2S prediction system from 1981 to 2018 (in real time) with a nudging-based data assimilation method. To determine the model bias and further improve the prediction skill of the FGOALS-f2 S2S prediction system, it is still necessary to investigate the performance of the model in reproducing the atmospheric thermodynamic conditions based on the FGOALS-f2 reanalysis products. GPS sounding observations will help to both evaluate and improve the model’s performance over the tropical eastern Indian Ocean.
In this study, we compared the thermodynamic conditions of the atmosphere (with a focus on the temperature and relative humidity profile) within the middle to lower troposphere (below 600 hPa) over the equatorial eastern Indian Ocean (EEIO) between three reanalysis datasets and the GPS sounding observations during the NORC2018-10 cruise. The three reanalysis datasets were the Japanese 55-year Reanalysis (JRA-55) dataset, the Modern-Era Retrospective Analysis for Research and Applications dataset, version 2 (MERRA2), and the FGOALS-f2 dataset. The aim was to answer the question of whether the JRA-55 and MERRA2 reanalysis datasets, as well as the FGOALS-f2 reanalysis, can be used to reproduce the main characteristics of the temperature and humidity profiles over the EEIO during the NORC2018-cruise. Also, the possible reasons for the different deviations of the three reanalysis datasets in reproducing the main characteristics of the temperature and humidity profiles are discussed.
The remainder of the paper is organized as follows: Section 2 describes the datasets and methods used for the evaluation. Section 3 compares the temperature and relative humidity profiles. A summary of our key findings and some further discussion are provided in section 4.
2. Datasets and methods
2.1. GPS sounding observational datasets
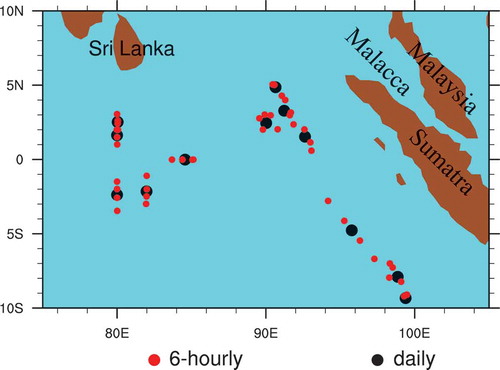
The GPS sounding observation datasets were obtained from the first half of the scientific investigation voyage over the Indian Ocean (NORC2018-10) covering the period 17 March to 17 April 2018. This voyage was scheduled to conduct balloon GPS sounding measurements when the weather conditions were sufficiently safe (stable atmospheric conditions) for the crew to carry out deck operations. The atmospheric detection system used in the voyage was the CF-06-A GPS radiosonde system (Nash et al. Citation2011), which contains a temperature and humidity sensor together with a GPS receiver system and a ground check set. The temperature sensor is a bead thermistor and can survey temperature ranges from −90 to 60°C with an uncertainty of <0.5°C. The humidity sensor is a thin-film capacitor with a survey range from 0 to 100% and an uncertainty of <5%. Xie et al. (Citation2014) reported that both the CF-06-A temperature sensor and the humidity sensor have a relatively stable performance both at nighttime and in daytime over the equatorial tropical Indian Ocean in the middle to lower troposphere (up to 6 km) and provide high-quality measurements in the tropical oceans. The weather balloon was released at about 0200, 0800, 1400, and 2000 LST. In total, more than 100 GPS sounding measurements were made. The 12 dates on which four sounding measurements per day were successfully conducted were selected for comparison. shows the locations of the observation stations on these 12 days. To ensure the reliability of the datasets, some control work was carried out. First, unrealistic values (either too large or small) were eliminated. Then, some standards that have been defined to constrain these datasets based on the continuity assumption were applied, in which the measured datasets did not change very much within a specific height. shows the four standards used for quality control of the balloon GPS sounding data. Here, we take standard 1 as an example to clarify the meaning of each threshold. In standard 1, the threshold for temperature change, relative humidity change, pressure change and zonal or meridional wind change should be less than 2°C, 20%, 1.5 hPa and 8 , within a height change of 10 m. The subsets of the data that were not satisfied by any of the four standards were treated as outliers and eliminated to leave adjusted datasets. The adjusted datasets were then interpolated to the same pressure levels as the reanalysis datasets to facilitate further comparison.
Table 1. Thresholds/standards for the quality control of the balloon GPS sounding measurements.
Figure 1. Locations of the 12 days of selected observations (red: six-hourly location; black: daily mean location).
2.2. Reanalysis datasets
The reanalysis datasets used in this study were the JRA-55 dataset (Kobayashi et al. Citation2015), the MERRA2 dataset (Gelaro et al. Citation2017), and the FGOALS-f2 dataset. Both JRA-55 and MERRA2 have a horizontal resolution of about 60 km, but the former has a vertical resolution of 17 levels from 1000 to 600 hPa, and the latter 15. The time stamps of these two reanalysis datasets are at 0000, 0600, 1200, and 1800 UTC. We averaged the data (the same dates as in observational datasets) to daily mean values for comparison. The FGOALS-f2 reanalysis product has a horizontal resolution of and 32 vertical levels from the surface to 2.17 hPa; however, only 13 standard vertical levels from 1000 to 600 hPa were used in this study. The FGOALS-f2 S2S system assimilates reanalysis data from both the atmosphere and ocean; detailed information about the system can be found in Bao et al. (Citation2019). We used the FGOALS-f2 reanalysis dataset’s time stamps at 0000, 0600, 1200, and 1800 UTC and averaged the data to the daily mean value for comparison.
2.3. Methods
The primary evaluation methods used in this study were mean bias error (MBE) and root-mean-square error (RMSE), where is the GPS sounding measurement and
is the reanalysis dataset on the same day:
3. Results
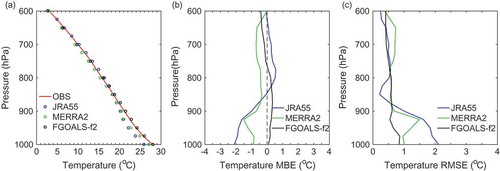
shows the 12-day mean temperature profiles of the GPS sounding measurements and the JRA-55, MERRA2, and FGOALS-f2 datasets, in addition to the mean temperature MBE profiles and mean temperature RMSE profiles for the three reanalysis datasets within the middle to low troposphere. ) shows that the temperature decreased with height and varied from 28 to 3.0°C in the GPS sounding measurements. All three reanalysis datasets reproduced this feature, with some deviations. ) shows that the temperature below 850 hPa in the JRA-55 dataset was lower than GPS sounding observations and the maximum negative bias lay in the bottom layer of the atmosphere (nearly 1000 hPa, about 50–70 m above the sea surface), which is >2°C. Also, the deviation was smaller from 850 to 600 hPa, with a maximum bias of <0.5°C, indicating JRA-55 reproduced the temperature profile over the EEIO well at these levels during the NORC2018-10 open cruise. For MERRA2, the temperature below 600 hPa was lower than the GPS sounding observations and the maximum negative bias lay at 925 hPa, which is about 1.5°C. By contrast, the FGOALS-f2 reanalysis products more reasonably reproduced the mean temperature profiles in the middle to low troposphere during the cruise, with a bias <0.5°C.
Figure 2. (a) Mean temperature profiles of the GPS sounding measurements and the JRA-55, MERRA2, and FGOALS-f2 datasets for the 12 days of observations. (b) Mean temperature MBE profile and (c) mean temperature RMSE profile for the JRA-55, MERRA2, and FGOALS-f2 datasets for the 12 days of observations.
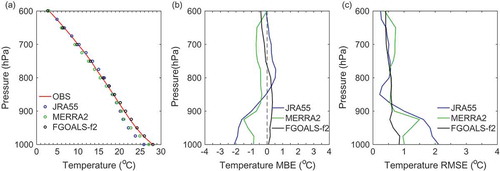
Because the MBE eliminates positive and negative deviations, we further investigated the RMSE for the JRA-55, MERR2, and FGOALS-f2 datasets (in comparison with the GPS sounding observations) to make a comprehensive assessment of their characterization performance. ) shows that the RMSE and MBE below 875 hPa were smaller in the MERRA2 dataset than in the JRA-55 dataset, whereas the RMSE from 850 to 600 hPa was larger in MERRA2 than in JRA-55. This means that the MERRA2 dataset showed a better performance in characterizing the temperature profiles in the lower layers of the atmosphere (below 875 hPa), whereas JRA-55 better captured the temperature profile characterizations in the mid-troposphere over the EEIO (from 850 to 600 hPa) during the cruise. Because the FGOALS-f2 temperature reanalysis products were nudged from the JRA-55 reanalysis datasets, their performance was similar (with a roughly equal RMSE). However, the deviation was much smaller below 900 hPa in FGOALS-f2 than in JRA-55 and MERRA2, meaning the FGOALS-f2 products showed a better performance over the marine atmospheric boundary layer (MABL) during the period of this cruise.
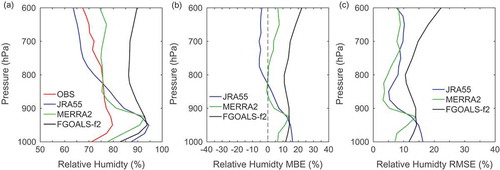
The relative humidity is another important feature in characterizing the thermodynamic conditions in the atmosphere (Kollias et al. Citation2009; Zhang et al. Citation2010, Citation2016), which play an important part in cloud formation and cloud microphysical processes. We derived the relative humidity from the saturation water vapor pressure (), specific humidity and pressure for the reanalysis datasets. shows the results for the comparisons of the relative humidity profiles. ) shows that the relative humidity varied from 80% to 67% from 1000 to 600 hPa and decreased with height above 950 hPa (79.8%) in the GPS sounding measurements during the cruise. All three reanalysis datasets were able to reproduce this feature, but with some deviations. ) shows that the relative humidity was larger than the GPS sounding observations below 850 hPa over the EEIO for the JRA-55 dataset, with a maximum positive deviation of about 17% in the bottom layer of the atmosphere (nearly 1000 hPa, about 50–70 m above the sea surface). Above 850 hPa, the relative humidity was smaller than the GPS sounding observations, but the deviation was relatively small (<8%). The MERRA2 dataset seemed to show wetter conditions in the middle to lower troposphere over the EEIO. The deviation was larger below 850 hPa and had a maximum deviation of about 15% at 925 hPa. The deviation was relatively small (<7%) above 850 hPa. Comparison of the RMSE and MBE for the JRA-55 and MERRA2 datasets with the GPS sounding observations showed that both the RMSE and MBE below 925 hPa were smaller in MERRA2 than in JRA-55, although they both showed a smaller RMSE above 900 hPa. This meant they performed similarly between 900 and 600 hPa over the EEIO, whereas MERRA2 performed better at lower levels of the troposphere (below 900 hPa) during the cruise. The FGOALS-f2 reanalysis products showed wetter conditions than the observations in the middle to lower troposphere. The deviation was more than 10% and 20% at 600 hPa. Specific humidity is not considered in the assimilation process in the FGOALS-f2 reanalysis products, and therefore the deviation showed the simulation bias of the model. The FGOALS-f2 dataset showed a much wetter environment over the EEIO during the cruise, which may have resulted from the simulation bias in the moist atmospheric processes, such as cumulus convection.
Figure 3. (a) Mean relative humidity profiles of the GPS sounding measurements and the JRA-55, MERRA2, and FGOALS-f2 datasets for the 12 days of observations. (b) Mean relative humidity MBE profile and (c) mean relative humidity RMSE profile for the JRA-55, MERRA2, and FGOALS-f2 datasets for the 12 days of observations.
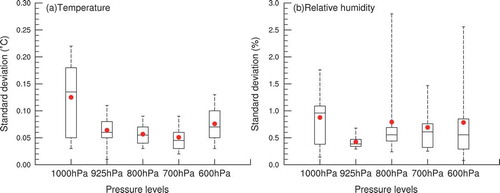
When comparing between the GPS sounding measurements and reanalysis/simulation datasets, the identified deviation may result from the so-called sampling problem because the time stamp used in the observations and the reanalysis/simulation datasets may be different, but with the same temporal resolution (six-hourly interval). For example, the observational data may be recorded at 0200, 0800, 1400, and 2000 UTC to obtain the daily mean values, whereas the reanalysis may sample at 0000, 0600, 1200, and 1800 UTC. To investigate the impact of this problem on the temperature and relative humidity, we conducted a test based on the FGOALS-f2 reanalysis products (hourly outputs). Using a six-hourly interval, the FGOALS-f2 reanalysis products were divided into six samples in one day (24-h output). We then calculated the standard deviation at different levels on each day between these six samples. shows box plots (maximum, upper quartile, median, lower quartile, minimum and mean values of the standard deviation (STD)) for these samples. ) shows that the mean STD for temperature was about 0.125°C at 1000 hPa and the maximum STD was <0.22°C. At other levels, the mean STD was <0.1°C and the maximum STD was <0.15°C. The mean STD for relative humidity was <1% and the maximum was <3% in all middle to lower levels. These results suggest that the impact of the sampling problem caused by daily comparisons of the temperature and relative humidity during the cruise was relatively small and does not significantly affect our conclusions.
Figure 4. Box plot of the standard deviation for (a) temperature and (b) relative humidity at different levels during the cruise. Red dots represent the mean of the standard deviation of each day’s sample on all days.
4. Discussion and conclusions
Summarizing our comparison results, the main conclusions are as follows:
Both JRA-55 and MERRA2 showed reasonable performance in reproducing the temperature and relative humidity profile from 850 to 600 hPa over the EEIO, while both showed a large derivation above 850 hPa.
The FGOALS-f2 reanalysis dataset showed competitive performance in reproducing the temperature profile in the middle (above 900–600 hPa) level of the troposphere over the EEIO, and better performance than both JRA-55 and MERRA2 in the MABL (below 900 hPa) of the atmosphere. However, FGOALS-f2 overestimated the relative humidity in the middle to lower levels of the troposphere, which reached 20% at 600 hPa. The reasons for the better performance of temperature in FGOALS-f2 in the MABL of the atmosphere may result from the use of an air–sea coupled climate model as well as a higher assimilation frequency (daily) for sea surface temperature. Also, the FGOALS-f2 model showed much wetter conditions in the middle to lower levels of the troposphere, meaning there is room to improve the moist atmospheric processes through more accurate model physics schemes and more advanced data assimilation.
In our study, the data quality control procedures that removed the possible outliers would have smoothed the GPS sounding data to some extent, thus artificially reducing the difference between the observations and reanalysis datasets. The same situation would also have occurred in the daily mean comparison between those datasets. A more detailed time-collocated comparison between the GPS sounding measurement and reanalysis datasets should therefore be conducted in the future. Preliminary results for further daytime and nighttime comparisons show that the deviation is similar to that in daily-mean comparisons, albeit with some differences in the detail (not shown). Also, the results reported here relate only to stable atmospheric conditions. Under convective weather conditions, there will be greater spatial and temporal variation of temperature and relative humidity in the real world. The performance of the reanalysis datasets under convective weather conditions should be further investigated when the necessary observational datasets become available. In addition, the results shown are plotted at pressure level, while atmospheric pressure in CF-06-A (GPS sounding measurements) is transferred from the GPS geometric height. The uncertainties related to pressure retrieval may cause additional uncertainties in our results. The GPS sounding observational datasets used in this study still lack data, and GPS balloon observations should be continued during the annual marine survey over the eastern Indian Ocean; plus, the diurnal cycle of the temperature and relative humidity should be investigated further.
Acknowledgments
The authors wish to thank the two anonymous reviewers for their many insightful comments and suggestions, and the South China Sea Institute of Oceanology (SCSIO) for providing the observational measurements. Also, thanks to all crewmembers and sailor members in NORC2018-10.
Disclosure statement
No potential conflict of interest was reported by the authors.
Additional information
Funding
References
- Bao, Q., X. F. Wu, J. X. Li, L. Wang, B. He, X. C. Wang, Y. M. Liu, and G. X. Wu. 2019. “Outlook for El Niño and the Indian Ocean Dipole in Autumn–Winter 2018–2019.” Chinese Science Bulletin (In Chinese) 64 (1): 73–78. doi:10.1360/N972018-00913.
- Chen, G., W. Han, Y. Li, M. J. Mcphaden, J. Chen, W. Wang, and D. Wang. 2017. “Strong Intraseasonal Variability of Meridional Currents near 5°N in the Eastern Indian Ocean: Characteristics and Causes.” Journal of Physical Oceanography 47: 979–998. doi:10.1175/JPO-D-16-0250.1.
- Gelaro, R., W. McCarty, M. J. Suárez, R. Todling, A. Molod, L. Takacs, C. A. Randles, et al. 2017. “The Modern-Era Retrospective Analysis for Research and Applications, Version 2 (MERRA-2).” Journal of Climate 30 :5419–5454. doi:10.1175/JCLI-D-16-0758.1.
- He, G., S. Zhang, G. Chen, and P. Wu. 2013. “Effect of Sounding Intensive Observation Data on Numerical Weather Prediction of Southeast China.” Plateau and Mountain Meteorology Research (In Chinese) 33 (3): 1–7. doi:10.3969/j.issn.1674-2184·2013.03.001.
- Jia, B., H. M. Xu, and Y. G. An. 2014. “Comparisons of Atmospheric Specific Humidity in Reanalysis Datasets and Homogenized Radiosonde Dataset in China.” Meteorological Monthly (In Chinese) 40: 1123–1131. doi:10.7519/j.issn.1000-0526.2014.09.010.
- Kobayashi, S., O. Yukinari, H. Yayoi, E. Ayataka, M. Masami, O. Hirokatsu, O. Kazutoshi, et al. 2015. “The JRA-55 Reanalysis: General Specifications and Basic Characteristics.” Journal of the Meteorological Society of Japan 93 (1): 5–48. doi:10.2151/jmsj.2015-001.
- Kollias, P., M. A. Miller, K. L. Johnson, M. P. Jensen, and D. T. Troyan. 2009. “Cloud, Thermodynamic, and Precipitation in West Africa during 2006.” Journal of Geophysical Research Atmospheres 115. doi:10.1029/2008JD010641.
- Liao, X., X. Yu, and Y. Tan. 2007. “Improvement of Convective Weather Forecasting with Enhanced 14:00 BST Sounding Data.” Meteorological Monthly (In Chinese) 33: 28–32.
- Lin, X. G., Y. Q. Qi, and X. H. Chen. 2014. “Hydrographical Features in the Eastern Indian Ocean during March−May.” Journal of Tropical Oceanography (In Chinese) 33: 1–9. doi:10.3969/j.issn.1009-5470.2014.03.001.
- Madden, R. A. 1971. “Detection of a 40-50 Day Oscillation in the Zonal Wind in the Tropical Pacific.” Journal of Atmospheric Sciences 28: 702–708. doi:10.1175/1520-0469(1971)028<0702:DOADOI>2.0.CO;2.
- Madden, R. A. 1972. “Description of Global-Scale Circulation Cells in the Tropics with a 40-50 Day Period.” Journal of Atmospheric Sciences 29: 1109–1123. doi:10.1175/1520-0469(1972)029<1109:DOGSCC>2.0.CO;2.
- Meier, W., U. S. Bhatt, J. Walsh, E. Blanchard-Wrigglesworth, N. Wayand, R. Thoman, F. Massonnet, et al. 2018. “2018 Sea Ice Outlook Interim Post-Season Report.” https://www.arcus.org/sipn/sea-ice-outlook/2018/InterimPostSeason
- Nash, J., T. Oakley, H. Vömel, and W. Li. 2011. “Report for the 2010 WMO Intercomparison of Radiosonde Systems in Yangjiang, China Published.” http://www.wmo.int/pages/prog/www/IMOP/publications/IOM-107_Yangjiang.pdf
- Peng, S., Y. H. Zhu, K. Huang, X. R. Ding, R. Shi, D. M. Wu, Y. R. Feng, and D. X. Wang. 2016. “Detecting the Structure of Marine Atmospheric Boundary Layer over the Northern South China Sea by Shipboard GPS Sondes.” Atmospheric Science Letters 17: 564–568. doi:10.1002/asl.693.
- Saji, N. H., B. N. Goswami, P. N. Vinayachandran, and T. Yamagata. 1999. “A Dipole Mode in the Tropical Indian Ocean.” Nature 401: 360–363. doi:10.1038/43854.
- Shi, R., J. Chen, X. Y. Guo, L. L. Zeng, J. Li, Q. Xie, X. Wang, and D. X. Wang. 2017. “Ship Observations and Numerical Simulation of the Marine Atmospheric Boundary Layer over the Spring Oceanic Front in the Northwestern South China Sea.” Journal of Geophysical Research Atmosphere 122: 3733–3753. doi:10.1002/2016JD026071.
- Wang, B. 2006. The Asian Monsoon. Chichester: Praxis Publishing. doi:10.1007/3-540-37722-0.
- Webster, P. J., G. J. Holland, J. A. Curry, and H. R. Chang. 2005. “Changes in Tropical Cyclone Number, Duration, and Intensity in a Warming Environment.” Science 309: 1844–1846. doi:10.1126/science.1116448.
- Xie, Q., K. Huang, D. X. Wang, L. Yang, J. Chen, Z. W. Wu, D. N. Li, and Z. Y. Liang. 2014. “Intercomparison of GPS Radiosonde Soundings during the Eastern Tropical Indian Ocean Experiment.” Acta Oceanologica Sinica 33 (1): 127–134. doi:10.1007/s13131-014-0422-9.
- Yang, L., D. Wang, J. Huang, X. Wang, L. Zeng, R. Shi, Y. He, et al. 2015. “Toward a Mesoscale Hydrological and Marine Meteorological Observation Network in the South China Sea.” Bulletin of the American Meteorological Society 96 :1117–1135. doi:10.1175/BAMS-D-14-00159.1.
- Zeng, L., D. Wang, C. Ju, W. Wang, and R. Chen. 2016. “SCSPOD14, a South China Sea Physical Oceanographic Dataset Derived from in Situ Measurements during 1919–2014.” Scientific Data 3: 160029. doi:10.1038/sdata.2016.29.
- Zeng, L., Q. Wang, Q. Xie, P. Shi, L. Yang, Y. Q. Shu, J. Chen, et al. 2015. “Hydrographic Field Investigations in the Northern South China Sea by Open Cruises during 2004–2013”. Science Bulletin 60: 607–615. doi:10.1007/s11434-015-0733-z.
- Zhang, C. 2005. “Madden‐Julian Oscillation.” Reviews of Geophysics 43. doi:10.1029/2004RG000158.
- Zhang, J., H. Chen, X. Xia, and W. Wang. 2016. “Dynamic and Thermodynamic Features of Low and Middle Clouds Derived from Atmospheric Radiation Measurement Program Mobile Facility Radiosonde Data at Shouxian.” Advances in Atmospheric Sciences 33 (1): 21–33. doi:10.1007/s00376-015-5032-8.
- Zhang, J. Q., H. B. Chen, Z. Q. Li, X. H. Fan, L. Peng, Y. Yu, and M. Cribb. 2010. “Analysis of Cloud Layer Structure in Shouxian, China Using RS92 Radiosonde Aided by 95 GHz Cloud Radar.” Journal of Geophysical Research Atmospheres 115. doi:10.1029/2010JD014030.
- Zhou, F. H., R. W. Zhang, R. Shi, J. Chen, Y. K. He, D. X. Wang, and Q. Xie. 2018. “Evaluation of OAFlux Datasets Based on in Situ Air-Sea Flux Tower Observations over the Yongxing Islands in 2016.” Atmospheric Measurement Techniques 11: 6091–6106. doi:10.5194/amt-2017-456.
- Zhou, L., Q. Bao, Y. M. Liu, G. X. Wu, W. C. Wang, X. C. Wang, B. He, H. Y. Yu, and J. D. Li. 2015. “Global Energy and Water Balance: Characteristics from Finite‐Volume Atmospheric Model of the IAP/LASG (FAMIL1).” Journal of Advances in Modeling Earth Systems 7: 1–20. doi:10.1002/2014MS000349.
- Zhou, S. W., and R. H. Zhang. 2009. “Comparison of NCEP/NCAR Reanalysis Data and Radiosonde Data about Temperature and Geopotential Height of Upper Air over the Tibetan Plateau.” Climatic and Environmental Research (In Chinese) 14 (2): 284–292.